


Overview
Source: David Guo, College of Engineering, Technology, and Aeronautics (CETA), Southern New Hampshire University (SNHU), Manchester, New Hampshire
A wing is the major lift-generating apparatus in an airplane. Wing performance can be further enhanced by deploying high-lift devices, such as flaps (at the trailing edge) and slats (at the leading edge) during takeoff or landing.
In this experiment, a wind tunnel is utilized to generate certain airspeeds, and a Clark Y-14 wing with a flap and slat is used to collect and calculate data, such as the lift, drag and pitching moment coefficient. A Clark Y-14 airfoil is shown in Figure 1 and has a thickness of 14% and is flat on the lower surface from 30% of the chord to the back. Here, wind tunnel testing is used to demonstrate how the aerodynamic performance of a Clark Y-14 wing is affected by high-lift devices, such as flaps and slats.
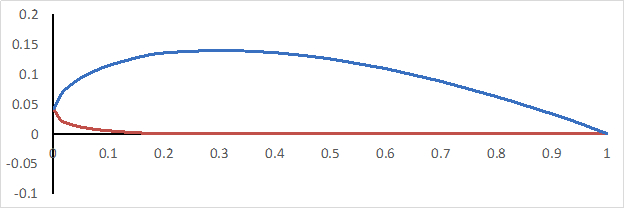
Figure 1. Clark Y-14 airfoil profile.
Principles
An airplane's speed is relatively low during takeoff and landing. To generate sufficient lift, it is necessary to increase the wing area and/or change the airfoil shape on the leading and trailing edges of the wing. To do this, slats are used on the leading edge, and flaps are used on the trailing edge. The flaps and slats can move into or out of the wings. Deploying the flaps and the slats has two effects; it increases the wing area and the effective camber of the airfoil, which increases the lift. In addition, the deployment of flaps and slats also increases the dragof the aircraft. Figure 2 shows cruise, takeoff and landing configurations of a wing with a flap and a slat.

Figure 2. Various wing flap and slat configurations.
During flight, the wing of an airplane is continually subjected to a resultant aerodynamic force and moment, as shown in Figure 3(a). The resultant force, R, can be decomposed into two components. Typically, one component is along the direction of the far-stream velocity, V∞, which is called drag, D, and the other component is perpendicular to the direction, which is called lift, L.
The moment, M, moves the nose of the airplane up or down, thus, it is called the pitching moment. In wind tunnel testing, the normal and axial forces are typically measured directly. The normal, N, and axial forces, A, are related to lift and drag through the angle of attack, α, as shown in Figure 3(b). The angle of attack, is defined as the angle between the far-stream velocity direction and the chord of the wing airfoil.

Figure 3(a). Resultant aerodynamic force and moment.

Figure 3(b). The decomposition of the resultant force, R.
The two force pairs can also be expressed as follows:


where α is the angle of attack.
The non-dimensional lift coefficient, CL, for a wing is defined as:

where L is the lift,  is the dynamic pressure based on the free-stream density, ρ∞, and airspeed, V∞, and S is the reference area of the wing.
Similarly, the non-dimensional drag coefficient for a wing is defined as:

The resultant aerodynamic force from lift and drag is located at a point on the wing (or airfoil) called the center of pressure. However, the location of the center of pressure is not a fixed location, rather, it moves based on the angle of attack. Therefore, it is convenient to move all forces and moments to approximately the quarter chord point (a distance 1/4 of the chord length from the leading edge). This is called the pitching moment about quarter chord, Mc/4.

Figure 4. Pitching moment about quarter chord.
The pitching moment coefficient, CM,c/4, about quarter chord is defined as:

where Mc/4 is the pitching moment about quarter chord, and c is the chord length of the wing.
Wing performance relies on the Reynolds number, Re, which is defined as:

where the parameter μ is the dynamic viscosity of the fluid.
In this demonstration, the performance of a Clark Y-14 wing with a simple flap and a simple slat is evaluated in a wind tunnel, as shown in Figure 4. The wing is installed to a device called a sting balance, which is shown in Figure 5 and measures the normal force, N, and the axial force, A.

Figure 5. Clark Y-14 wing with a flap and a slat.
Subscription Required. Please recommend JoVE to your librarian.
Procedure
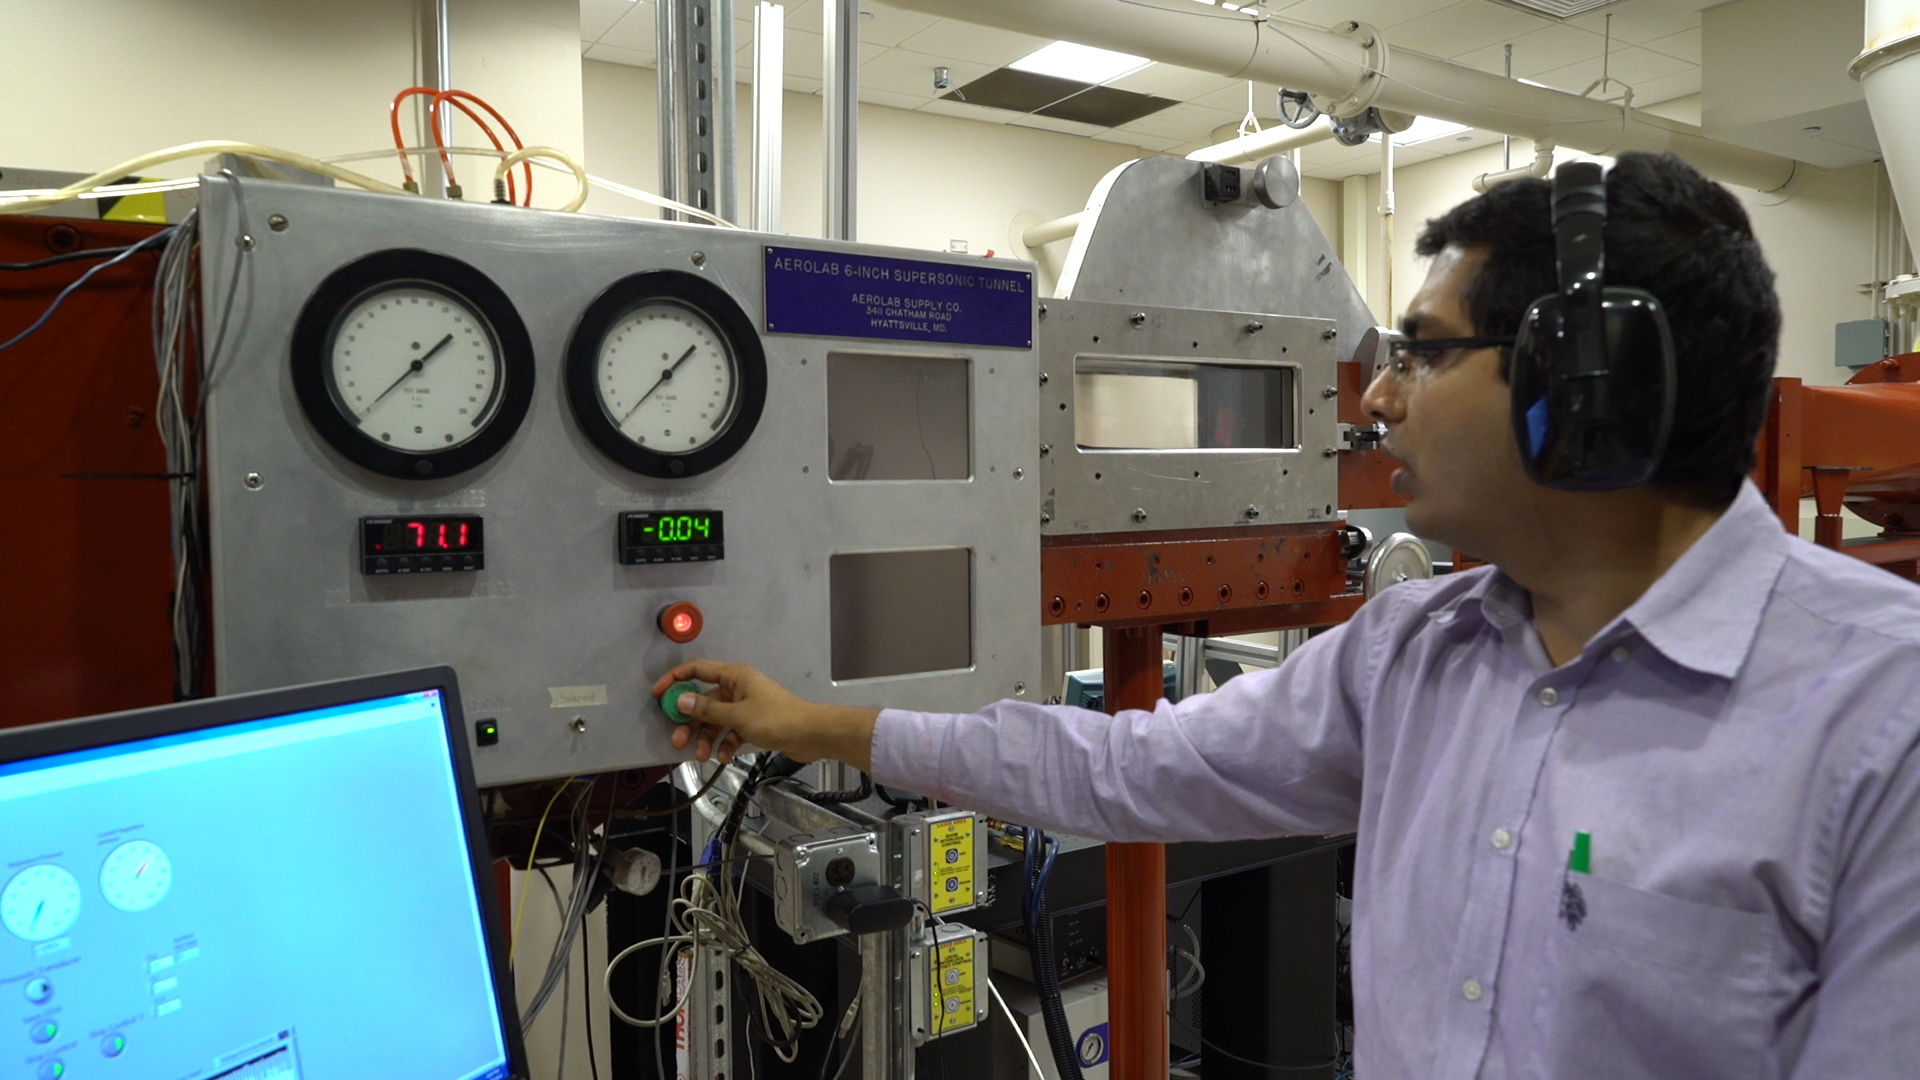
- For this procedure, use an aerodynamics wind tunnel with a test section of 1 ft x 1 ft and a maximum operating airspeed of 140 mph. The wind tunnel must be equipped with a data acquisition system (able to measure angle of attack, normal force, axial force and pitching moment) and a sting balance.
- Open the test section, and install the wing on the sting balance. Start with clean wing configuration.
- Place a handheld inclinometer on the sting balance, and adjust the pitch angle adjustment knob to set the sting balance pitch to horizontal.
- With the sting balance horizontal, tare the angle of attack (it is called pitch angle in the wind tunnel computer data display panel).
- Tare all force, moment and airspeed readings at zero angle of attack.
- Adjust the angle of attack to -8°, and collect no wind measurements by recording all normal force, axial force and pitching moment readings.
- Repeat the no-wind measurements for pitch angles ranging from -8° to 18°, with 2° increments.
- Return the angle of attack to -8°, and run the wind tunnel at 60 mph. Collect readings of the normal force, axial force and pitching moment from -8° to 18° with 2° increments.
- Adjust the wing to the second configuration with the slat adjusted to have about 3/8 in slot. Repeat steps 3 - 8.
- Adjust the wing to the third configuration, with the flap set to 45° with respect to the chord line, and the slat not deployed. Repeat steps 3 - 8.
- Adjust the wing to the fourth configuration with both the slat and flap deployed (Figure 5). Repeat steps 3 - 8.
The wing is the primary lift-generating apparatus in an airplane, and its geometry is key to its performance. First, recall that lift is an aerodynamic force that is generated by a pressure differential between the top and bottom surfaces. The total lift is proportional to the surface area of the wing. Thus, a higher surface area results in increased lift.
Lift is also affected by the geometry of the wing cross section, called an airfoil. Recall that the chord line of the airfoil connects the leading and trailing edges. Another property called the camber describes the asymmetry between the two surfaces. The majority of wings have positive camber, meaning that they are convex. As with surface area, increased camber results in increased lift.
Since wind speed is relatively slow during takeoff and landing, surface area and camber are increased by deploying devices on the wing's leading and trailing edges in order to generate sufficient lift. The device at the leading edge of the airfoil is called a slat, while the device at the trailing edge is called a flap. Slats and flaps can move into or out of the wings as needed.
While the deployment of slats and flaps increases lift, it also increases the drag force on the aircraft, which acts in opposition to lift. We can quantify both of these forces by calculating the lift coefficient and drag coefficient as shown, where L and D are lift and drag, respectively. Rho infinity and V infinity are the free stream density and velocity, while S is the reference area of the wing.
Lift, as a distributive force in nature, can be equalized or simplified into a single concentrated force located at the center of pressure. However, as the angle of attack changes, this location moves forward or aft. So instead, we refer to the aerodynamic center of the wing when discussing forces.
The aerodynamic center of the wing is the location where the pitching moment coefficient is effectively unchanged by varied angle of attack. Another typical way to express pitching moment is to use the pitching moment coefficient. This dimensionless coefficient is calculated as shown, where M C/4 is the pitching moment about the 1/4 chord point.
In our demonstration, we measure the pitching moment at a 1/4 chord, which is close to the aerodynamic center of the wing. In this experiment, we will study a Clark Y-14 airfoil with a simple flat and slat at various angles of attack. We will then analyze lift, drag, and pitching moment to determine performance characteristics at each configuration.
For this experiment, use an aerodynamic wind tunnel with a 1 ft by 1 ft test section and a maximum operating airspeed of 140 mph. The wind tunnel must be equipped with a data acquisition system and a sting balance, which measures both normal and axial forces.
Now, obtain a Clark Y-14 wing model with an attached flap and slat. Begin the test with the clean wing configuration, meaning that neither the flap nor slat are deployed. Now open the test section, and install the wing on the sting balance.
Operate the pitch angle adjustment knob underneath the test section of the wind tunnel to adjust the sting balance pitch to horizontal. Use a handheld inclinometer to measure the pitch angle and adjust the pitch to reach a reading of zero. Close the test section and tare the pitch angle in the wind tunnel display. Then, tare all force, moment, and airspeed readings on the data acquisition system.
Now, adjust the pitch angle, also called the angle of attack, to minus 8°, and make a no-wind measurement by recording all axial force, normal force, and pitching moment readings. Repeat the no-wind measurements for pitch angles ranging from minus 8 to 18° with 2° increments. When all of the no-wind measurements have been made, return the pitch angle to minus 8°.
Now, turn on the wind tunnel and increase the airspeed to 60 mph. Take readings of the axial force, normal force, and pitching moment for pitch angles ranging from minus 8° to 18°, with 2° increments. After you have completed all of the measurements with the clean wing, turn the wind tunnel off and open the test section.
Adjust the wing to a new configuration, with the slat adjusted to have about 3/8 of an inch of slot. Rerun the experiment exactly the same way as for the clean wing, by first making no-wind measurements at minus 8 - 18° pitch angles with 2° increments. Then collect the same measurements at 60 mph.
After you have completed these measurements, modify the wing to a third configuration with the flaps set to 45° with respect to the chord line and the slat not deployed. Then rerun the measurements as before. Finally, adjust the wing to the fourth configuration, where both the slat and flap are deployed, and repeat the experiment.
Now let's interpret the results. To analyze the data, we'll first calculate the non-dimensional lift coefficient at each pitch angle, which is defined as shown. Rho infinity is the free stream density, V infinity is the free stream velocity, and S is the reference area of the wing. All of these values are known.
Lift, L, is calculated as a relation of two force pairs, where N is the normal force and A is the axial force. Both were measured by the sting balance. Alpha is the angle of attack, also called the pitch angle, in this experiment. Now, let's look at a plot of the lift coefficient versus the pitch angle for each of the four configurations.
Comparing the clean wing and the slat configuration curves, we see that the two curves are almost overlapping at low angles of attack. However, the clean wing lift curve peaks at about 12°, but the slat curve continues to increase. This indicates that a slat can be used to increase lift. If we compare the clean wing and the flap lift curves, we see that the flap increases lift over the entire angle of attack range.If both the slat and flap are deployed at the same time, the benefit of both devices are combined and the maximum lift is even higher.
Next, calculate the drag coefficient for each angle, which is defined as shown. Drag, D, is also defined as a relation of the normal and axial force pairs. In comparing the drag coefficient for each configuration, we see that the drag increases dramatically with the flap and slat deployed. The resultant aerodynamic force, R, from drag and lift is located on a point on the wing called the center of pressure.
The center of pressure is not a fixed location, but instead moves with changing angle of attack. Thus, it is more convenient to calculate all forces and moments about the 1/4 chord point. Then, using the pitching moment at 1/4 chord, which is measured by the sting balance, we can calculate the pitching moment coefficient as shown.
Finally, looking at the pitching moment coefficient for each configuration and pitch angle, we see that the pitching moment coefficient goes into the negative regime with the flap deployed. This means that the center of pressure shifts towards the trailing edge with the flap deployed.
In summary, we learned how lift-generating apparatus are used to improve aircraft performance. We then evaluated a Clark Y-14 wing in a wind tunnel to see how a flap and a slat affects lift, drag, and pitching moment.
Subscription Required. Please recommend JoVE to your librarian.
Results
The results of the clean wing configuration are shown in Table 1. Figures 6 - 8 show all three coefficients vs angle of attack, α, for all four configurations. From Figure 6, both the flap and slat enhanced the lift coefficient, but in different ways. Comparing the clean wing and the slat lift curve, the two curves are almost overlapping at low angles of attack. The clean wing lift curve peaks to about 0.9 at 12°, but the slat curve continues to rise to 1. 4 at 18°. This indicates that slats can be used to increase lift. When comparing the clean wing and flap lift curves, the flap increases lift over the entire angle of attack range. And if both the slat and flap are deployed at the same time, the effect is cumulative and the maximum lift is even higher.
In comparing the drag coefficient for each configuration in Figure 7, the drag coefficient increases dramatically when both the flap and slat are deployed. Finally, as shown in Figure 8, the pitching moment coefficient goes into the negative regime when the flap is deployed. This means that the center of pressure shifts towards the trailing edge with the flap deployed.
Table 1. Experimental results for the clean wing configuration.
| Angle of attack (°) | Lift coefficient, CL | Drag coefficient, CD | Pitching moment coefficient, CM,c/4 |
| -8 | -0.022 | 0.015 | -0.129 |
| -6 | -0.029 | 0.014 | -0.059 |
| -4 | 0.096 | 0.016 | -0.059 |
| -2 | 0.208 | 0.011 | -0.054 |
| 0 | 0.353 | 0.006 | -0.065 |
| 2 | 0.460 | 0.004 | -0.053 |
| 4 | 0.548 | 0.032 | -0.051 |
| 6 | 0.708 | 0.015 | -0.062 |
| 8 | 0.789 | 0.025 | -0.061 |
| 10 | 0.849 | 0.031 | -0.061 |
| 12 | 0.873 | 0.045 | -0.056 |
| 14 | 0.856 | 0.058 | -0.089 |
| 16 | 0.803 | 0.080 | -0.125 |
| 18 | 0.803 | 0.092 | -0.128 |

Figure 6. Lift coefficient vs angle of attack, α.

Figure 7. Drag coefficient vs angle of attack, α.

Figure 8. Pitching moment coefficient vs angle of attack, α.
Table 2. Parameters used for calculations.
| Parameters | Values |
| Air density, ρ | 0.00230 slug/ft3 |
| Water density, ρL | 1.935 slug/ft3 |
| Gravitational acceleration, g | 32.17 ft/s2 |
| Viscosity, m | 3.79 x 10⁻⁷ lbf s/ft2 |
| Free-stream airspeed, V∞ | 60 mph |
| Reynolds number, Re | 1.56 x 10⁵ |
| Chord length, c | 3.5 in |
| Wing area, S | 35 in2 |
Subscription Required. Please recommend JoVE to your librarian.
Applications and Summary
Lift generation can be enhanced by the deployment of high-lift devices, such as flaps and slats. Most airplanes are equipped with flaps, and all commercial transport airplanes have both flaps and slats. It is critical to characterize the performance of a wing with flaps and slats during aircraft development.
In this demonstration, a Clark Y-14 wing with a flap and a slat was evaluated in a wind tunnel. The forces and moment measurements were collected to determine the lift, drag and pitching moment coefficients of the wing with and without flap and slat deployment. The results demonstrate that the lift coefficient increases when the flap and slat are deployed. However, this also resulted in a dramatic increase in the drag and pitching moment.
Subscription Required. Please recommend JoVE to your librarian.
References
- John D. Anderson (2017), Fundamentals of Aerodynamics, 6th Edition, ISBN: 978-1-259-12991-9, McGraw-Hill