Summary
A method for estimating the affinity constant of an agonist for the active state (Kb) of a G protein-coupled receptor is described. The analysis provides absolute or relative measures of Kb depending on whether constitutive receptor activation is measurable. Our method applies to various responses downstream from receptor activation.
Abstract
When an agonist activates a population of G protein-coupled receptors (GPCRs), it elicits a signaling pathway that culminates in the response of the cell or tissue. This process can be analyzed at the level of a single receptor, a population of receptors, or a downstream response. Here we describe how to analyze the downstream response to obtain an estimate of the agonist affinity constant for the active state of single receptors.
Receptors behave as quantal switches that alternate between active and inactive states (Figure 1). The active state interacts with specific G proteins or other signaling partners. In the absence of ligands, the inactive state predominates. The binding of agonist increases the probability that the receptor will switch into the active state because its affinity constant for the active state (Kb) is much greater than that for the inactive state (Ka). The summation of the random outputs of all of the receptors in the population yields a constant level of receptor activation in time. The reciprocal of the concentration of agonist eliciting half-maximal receptor activation is equivalent to the observed affinity constant (Kobs), and the fraction of agonist-receptor complexes in the active state is defined as efficacy (ε) (Figure 2).
Methods for analyzing the downstream responses of GPCRs have been developed that enable the estimation of the Kobs and relative efficacy of an agonist 1,2. In this report, we show how to modify this analysis to estimate the agonist Kb value relative to that of another agonist. For assays that exhibit constitutive activity, we show how to estimate Kb in absolute units of M-1.
Our method of analyzing agonist concentration-response curves 3,4 consists of global nonlinear regression using the operational model 5. We describe a procedure using the software application, Prism (GraphPad Software, Inc., San Diego, CA). The analysis yields an estimate of the product of Kobs and a parameter proportional to efficacy (τ). The estimate of τKobs of one agonist, divided by that of another, is a relative measure of Kb (RAi) 6. For any receptor exhibiting constitutive activity, it is possible to estimate a parameter proportional to the efficacy of the free receptor complex (τsys). In this case, the Kb value of an agonist is equivalent to τKobs/τsys 3.
Our method is useful for determining the selectivity of an agonist for receptor subtypes and for quantifying agonist-receptor signaling through different G proteins.
Protocol
1. Measurement of agonist concentration-response curves: no constitutive activity
- For estimation of relative agonist Kb values (RAi), a series of at least two agonist concentration-response curves is required. Any in vitro assay for the functional response of a GPCR can be measured provided that the concentration of agonist can be controlled and a single type of receptor mediates the response. Suitable cell-based assays include measurement of cAMP 4,7 and inositolphosphate accumulation 8,9 in a cell line expressing a recombinant receptor. Examples of whole tissue assays include measurement of contraction of smooth muscle 10 or M2 muscarinic receptor- and β1-adrenoceptor-mediated changes in contraction of the field-stimulated rat left atrium 11.
- Choose a series of agonists for analysis including a highly efficacious agonist (e.g., endogenous ligand). In a given experiment, measure complete concentration-response curves for each agonist. If the number of agonists is too large to complete the assay in a single experiment, divide the agonists into subgroups, each consisting of a manageable number of agonists for a single experiment. For each subgroup, measure the concentration-response curve of the highly efficacious agonist together with those of the other agonists in the subgroup (see Figure 3). Repeat the experiment for each subgroup 3 - 6 times, approximately, depending upon the variability of the data.
- For each concentration-response curve, measure the response in the absence of agonist (basal response), and in the presence of increasing concentrations of agonist. Space the agonist concentrations uniformly on a log scale approximately every 0.3 - 0.7 log10 units, covering the range of responses and defining the maximal response (Emax) (see Figure 3). For experiments on cell lines, each measurement is done in triplicate.
- Subtract the basal response from that measured in the presence of each concentration of agonist. The responses plotted in Figure 3 were calculated in this manner.
2. Preliminary analysis of agonist concentration-response curves: no constitutive activity
- Enter the data from the concentration-response experiments (e.g., Figure 5) into a Data Table in Prism. All of the log agonist concentrations are entered under the column labeled X. The response measurements for the agonist that appears to have the largest Emax value are entered into column A, and those for the other agonist are entered into adjacent lettered columns. Replicate measurements of a concentration-response curves are entered into sub-columns of a given lettered column.
- Select the graph sheet on which the data are plotted, and analyze the data by nonlinear regression analysis using the equation entitled, log(agonist) vs. response - Variable slope (four parameters). Constrain the "Bottom" parameter to zero, and perform the regression analysis. Copy the "Top" (Emax) and log EC50 parameters into an Excel spreadsheet for use in the calculation of initial parameter estimates. The agonist with the largest Emax estimate is designated as the "standard agonist", whereas the other agonists are designated as "test agonists".
-
Calculate the initial estimate of log τKobs (LOGR1) as the negative log EC50 value of the standard agonist (-log EC50').
Calculate the initial estimate of the log RAi value of each test agonist (LOGRA) as log {(Top*EC50')/(Top'*EC50)}, in which the parameters of the standard agonist are denoted with an apostrophe.
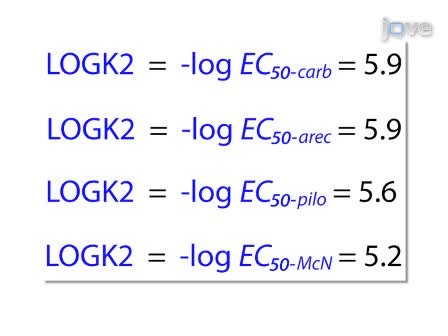
Calculate the log affinity constants of the test agonists (LOGK2 - LOGK5) as the negative log of their respective EC50 values.
3. Estimation of agonist RAi values using nonlinear regression analysis: no constitutive activity
- Enter the data into a Data Table in Prism as described above under 2.1. Make sure that the data for the standard agonist are entered in column A.
- Enter a user-defined equation, "log RAi", into Prism on several lines as shown for the case involving a total of five agonists:
- <A>P=LOGK1
- <A>Q=LOGR
- <~A>Q=LOGR+LOGRA
- <B>P=LOGK2
- <C>P=LOGK3
- <D>P=LOGK4
- <E>P=LOGK5
- Y=Msys/(1+{[(1+10^(X+P))/(10^(X+Q))]^M})
- Enter the initial parameter estimates as follows:
Enter an arbitrarily low value of 0 for the log affinity constant (LOGK1) of the standard agonist.
Enter the initial estimate of LOGR and the affinity constants (LOGK2 - LOGK5) and log RAi values (LOGRA) of the test agonists.
Assign the initial estimate of the transducer slope factor (M) a value of 1.0.
Assign the initial estimate for the maximal response of the system (Msys) a value equivalent to the Emax of the standard agonist (Top′). - Apply the following parameter constraints: LOGK1 constrained to the constant, 0; LOGR1, Msys and M, shared value for all data sets; LOGK2 - LOGK5 and LOGRA, no constraints.
- Initiate nonlinear regression analysis. The results yield the log Kobs and log RAi values of the test agonists. If the standard agonist is a full agonist, then the both the log Kobs and log RAi values are accurate. If the most efficacious agonist (standard agonist) is actually a partial agonist, then the Kobs values of the more efficacious agonists may be overestimated. Nonetheless, the estimates of log RAi are still accurate in this situation.
- If the regression does not converge, the experimenter may wish to plot the theoretical curve defined by the initial parameter estimates. If there are large deviations between the data points and the theoretical curves, check the calculation of the initial parameter estimates. If one or more agonists have Emax values equivalent to that of the standard agonist, it may be necessary to constrain their log Kobs values to 0 for the regression to converge on a solution.
4. Measurement of agonist concentration-response curves in cell-based assays exhibiting constitutive receptor activity
- For estimation of agonist Kb values in absolute units of M-1, cell-based in vitro assays are used that exhibit constitutive receptor activity. Constitutive receptor activity is defined as the increase in response above the basal level caused by expression of the receptor of interest.
- Choose agonists and design the experiment as described above in section 1.2.
- For each concentration-response curve, measure the response in the absence of agonist in non-transfected cells (basal response) and in cells transfected with the receptor of interest (basal response + constitutive response). Measure the response in the presence of different concentrations of the different agonists as described above in Section 1.3.
- Calculate constitutive receptor activity and the response to each concentration of agonist as the measured response minus the basal response in cells not transfected with the receptor. Figure 6 shows responses to various agonists calculated in this manner for a signaling pathway exhibiting very low constitutive activity.
5. Preliminary analysis of agonist concentration-response curves exhibiting constitutive activity
- Enter the data (e.g., Figure 6) into a Data Table in Prism as described in Section 3.1, but also enter the response caused by constitutive receptor activity in the appropriate lettered columns corresponding to a log agonist concentration of -20. A large negative logarithm is entered to approximate an agonist concentration of zero.
- Analyze the data as described above in Section 2.2, but with the "Bottom" parameter constrained so that it is "shared for all data sets." Copy the "Top" (Emax), shared "Bottom" and log EC50 parameters into an Excel spreadsheet for use in the calculation of initial parameter estimates.
- Calculate the initial parameter estimates as follows:
The log affinity constant of the standard agonist (LOGK1) or any full, test agonist must be determined in separate experiments as described previously 3.
Calculate the initial estimate of the log Kobs value of each partial test agonist (i.e., only LOGK2 in this case) as log {(Top'-Top)/(EC50(Top′- Bottom))}, in which "Bottom" denotes the response caused by constitutive receptor activation.
Calculate the initial estimate of log Kb (LOGKb) for each agonist as log {Top/(EC50Bottom)}.
Calculate the initial estimate of log τsys (LOGTsys) as log {Bottom/(Top′ - Bottom)}.
6. Estimation of agonist Kb values for responses exhibiting constitutive receptor activity using nonlinear regression analysis
- Enter the data into a Data Table in Prism as described above under 3.1
- Enter a user-defined equation, "Log Kb", into Prism on several lines as shown for the condition of two agonists:
- <A> LOGKOBS = LOGK1
- <B> LOGKOBS = LOGK2
- A=(10^(X+LOGKOBS))+1
- B=10^(X+LOGTSYS+LOGKB)
- C=(10^(LOGTSYS))
- Y=Msys/{1+[(A/(B+C))^M]}
- Enter the initial parameter estimates as follows:
Enter the affinity constants of each agonist (LOGK1 - enter the value determined under step 5.3).
Enter the Kobs estimates of each test agonist.
Enter the Kb estimates of the agonists.
Enter log τsys (LOGTsys) estimate.
Assign the transducer slope factor (M) and the maximal response of the system (Msys) values of 1.0 and Top' (Emax of the standard agonist), respectively. - Apply the following parameter constraints: LOGTsys, Msys and M, shared value for all data sets; LOGK2 and LOGKb, no constraints.
- Initiate nonlinear regression analysis. The results yield the log Kb of the standard agonist, the log Kobs and log Kb values of partial agonists, and the maximal response of the system (Msys), the τsys value for the free receptor complex (LOGTsys), and the transducer slope factor in the operational model (M).
- If the regression does not converge, follow the steps described above under point 3.6.
7. Representative Results
Figure 5 shows some of our previously published data on muscarinic agonist-induced phosphoinositide hydrolysis in Chinese hamster ovary cells stably expressing the M3 muscarinic receptor 12. The concentration-response curves of selected muscarinic agonists were measured in this assay. The data were analyzed as described above under Section 3 to estimate the Kb value of each agonist, expressed relative to that of oxotremorine-M. These log RAi estimates are, carbachol, -0.56 ± 0.063; arecoline, -0.60 ± 0.074; pilocarpine, -1.20 ± 0.15; and McN-A-343, -1.92 ± 0.31. The theoretical curves represent the least-squares fit of the regression equation to the data (Section 3.2). The corresponding estimates of the maximum response of the system (Msys) and the transducer slope factor (M) were 53.9 ± 1.3 and 1.15 ± 0.09, respectively. The log Kobs values of the agonists, except that of oxotremorine-M were, carbachol, 5.19 ± 0.14; arecoline, 5.49 ± 0.12; pilocarpine, 5.58 ± 0.16 and McN-A-343, 5.27 ± 0.33.
Figure 6 shows the results of experiments on muscarinic agonist-stimulated phosphoinositide hydrolysis in HEK 293 cells stably expressing Gα15 3. Transient expression of the M3 muscarinic receptor caused an increase in basal phosphoinositide hydrolysis, which was attributed to constitutive receptor activity. The data were analyzed to estimate the log Kb values of oxotremorine-M and McN-A-343 as described under Section 6. This analysis yielded log Kb values of 8.30 ± 0.59 and 6.59 ± 0.77 for oxotremorine-M and McN-A-343, respectively. The theoretical curves represent the least-squares fit of the regression equation to the data (see Section 6.2). The estimates of log τsys, Msys and M were -2.29 ± 0.59, 95.8 ± 2.8 and 0.72 ± 0.08, respectively. The estimate of the Kobs value of McN-A-343 was 5.35 ± 0.46.

Figure 1. Relationship between single receptor activity and the average level of activation of the receptor population. Single receptor activity, the theoretical behavior of a single receptor undergoing transitions between active (On) and inactive (Off) states in the presence of an agonist is shown. The affinity constants of the agonist for the active and inactive states are denoted by Kb and Ka, respectively. Population behavior, the theoretical behavior of several receptors undergoing random transitions between active and inactive states in the presence of an agonist is shown. Population average, the average level of receptor activation in a population of receptors in the presence of a specific concentration of agonist is shown. The activation level of the receptor population is known as the stimulus.

Figure 2. Relationship between the receptor activation function and the efficacy (ε) and observed affinity constant (Kobs) of the agonist. Population average, the average level of receptor activation elicited by increasing concentrations of agonist is shown. Receptor activation, the average level of receptor activation is plotted agonist the log concentration of agonist. The negative log concentration of agonist required for half-maximal receptor activation is equivalent to the log observed affinity constant of the agonist (log Kobs). The maximum of the receptor activation function is denoted as efficacy (ε).

Figure 3. Examples of concentration-response curves for the stimulation of [3H]inositolphosphate accumulation by various muscarinic agonists in Chinese hamster ovary cells expressing the human M3 muscarinic receptor. A total of nine agonist concentration-response curves were measured. The experiment can be divided into two parts. For each part, the standard agonist (oxotremorine-M) is always tested together with additional agonists. Thus, two experiments of the type shown in a and b are required to measure the concentration-response curves of nine agonists if only five agonists can be assayed at once. The data are from Ehlert et al. 12.

Figure 4. Examples of concentration-response curves for stimulation of [3H]inositolphosphate accumulation by various muscarinic agonists in HEK 293 cells expressing the human M2 muscarinic receptor and Gα15. Expression of the M2 receptor caused a 30 - 35% [3H]inositolphosphate response, which was attributed to constitutive receptor activity. The data are from Ehlert et al. 12.

Figure 5. Muscarinic agonist-mediated phosphoinositide hydrolysis in Chinese hamster ovary cells stably expressing the human M3 muscarinic receptor. The concentration-response curves of selected muscarinic agonists for stimulating phosphoinositide hydrolysis are shown. Mean values from three experiments ± SEM are shown. The data are from Ehlert et al. 12.

Figure 6. Oxotremorine-M- and McN-A-343-mediated phosphoinositide hydrolysis in HEK 293 cells expressing Gα15 and the M3 muscarinic receptor. Phosphoinositide hydrolysis is expressed relative to the Emax of oxotremorine-M. In the absence of agonist, phosphoinositide hydrolysis attributed to expression of the M3 receptor accounted for approximately 2% of the response. The means of three experiments ± SEM are shown. The data are from Ehlert et al. 3.
Subscription Required. Please recommend JoVE to your librarian.
Discussion
Because our method for estimating RAi (relative Kb value) only requires the measurement of agonist concentration-response curves, our analysis can be done anytime these curves are measured.
If day-to-day variation in the response of the experimental preparation (e.g., cells or tissue) is large, the response measurements of each concentration-response curve can be normalized relative to the "Top" estimate of the standard agonist for each day's experiment. An estimate of Top and log EC50 is estimated for each replicate concentration-response curve of the standard agonist by regression analysis as described in Sections 2 and 5. The response values of all of the agonist concentration-response curves on a given day are normalized relative to the Top estimate of the standard agonist for that day. These normalized data are then analyzed as described above beginning at Section 3.
The accuracy of estimating Kb depends on an accurate estimation of constitutive receptor activity. In our case, transfection of the M3 receptor in HEK 293 cells caused an increase in phosphoinositide hydrolysis that ranged from about 500 - 1,000 cpm of [3H]inositolphosphates measured in the presence of lithium in cells pre-labeled with [3H]inositol. The maximal response to carbachol was approximately 50,000 - 60,000 cpm. Had the constitutive response been larger and less variable, our estimate of the Kb values of the oxotremorine-M and McN-A-343 would have been more accurate. The estimate of Kb also depends on having an accurate estimate of the transducer slope factor (M) in the operational model. Consequently, more accuracy could have been achieved if the concentrations of agonist were more closely spaced as recommended under section 1.3. Running additional agonists in the experiment also greatly increases the accuracy of the estimate of M, and hence, of Kb.
If there are different active states of the receptor that signal through different coupling proteins (e.g., G proteins), then our method of analysis provides an accurate estimation of agonist Kb and RAi values for each effector pathway 3,6. If more than one active state contributes to a single measured response, then our method of estimation of RAi and Kb represents a weighted average of different active states depending upon their relative abundance and activity 3.
Constitutive receptor activity can be induced by over expressing the GPCR and its complementary G protein 13. This may change the observed affinity and efficacy of the agonist-receptor complex and may cause non-physiological signaling. But changes in the nature of the response and the observed affinity and efficacy of the receptor population do not imply changes in the fundamental quantal states of the receptor, only a change in their number and probability of isomerization. Thus, G proteins are not so much a determinant of drug effects so much as a window onto different effector-selective states of the receptor. If our method of analysis is applied to specific GPCR signaling assays involving a single effector (e.g., G protein) it should be possible to measure agonist Kb values for effector-selective states of the receptor - the ultimate measure of agonist bias.
Subscription Required. Please recommend JoVE to your librarian.
Disclosures
No conflicts of interest declared.
Acknowledgments
This work was supported by a National Institutes of Health Grant GM 69829.
References
- Stephenson, R. P. A modification of receptor theory. British Journal of Pharmacology. 11, 379-393 (1956).
- Furchgott, R. F. The use of b-haloalkylamines in the differentiation of receptors and in the determination of dissociation constants of receptor-agonist complexes. Advances in Drug Research. 3, 21-55 (1966).
- Ehlert, F. J., Suga, H., Griffin, M. T. Analysis of agonism and inverse agonism in functional assays with constitutive activity: Estimation of orthosteric ligand affinity constants for active and inactive receptor states. J. Pharmacol. Exp. Ther. 33, 671-686 (2011).
- Griffin, M. T., Figueroa, K. W., Liller, S., Ehlert, F. J. Estimation of Agonist Activity at G Protein-Coupled Receptors: Analysis of M2 Muscarinic Receptor Signaling through Gi/o,Gs, and G15. J. Pharmacol. Exp. Ther. 321, 1193-1207 (2007).
- Black, J. W., Leff, P. Operational models of pharmacological agonism. Proceedings of the Royal Society of LondonSeries B: Biological Sciences. 220, 141-162 (1983).
- Tran, J. A., Chang, A., Matsui, M., Ehlert, F. J. Estimation of relative microscopic affinity constants of agonists for the active state of the receptor in functional studies on M2 and M3 muscarinic receptors. Mol. Pharmacol. 75, 381-396 (2009).
- Schultz, J., Hamprecht, B., Daly, J. W. Accumulation of adenosine 3':5'-cyclic monophosphate in clonal glial cells: labeling of intracellular adenine nucleotides with radioactive adenine. Proceedings of the National Academy of Sciences of the United States of America. 69, 1266-1270 (1972).
- Berridge, M. J., Downes, C. P., Hanley, M. R. Lithium amplifies agonist-dependent phosphatidylinositol responses in brain and salivary glands. Biochemical Journal. 206, 587-595 (1982).
- Kendall, D. A., Hill, S. J. Methods in Neurotransmitter Receptor Analysis. , Raven Press. Yamamura, H.I. 68-87 (1990).
- Pulido-Rios, M. Vitro Isolated Tissue Functional Muscarinic Receptor Assays. Current Protocols in Pharmacology. 48, 4-15 (2010).
- Kenakin, T. Current Protocols in Pharmacology. Enna, S. J. , John Wiley & Sons. (2001).
- Ehlert, F. J., Griffin, M. T., Sawyer, G. W., Bailon, R. A. simple method for estimation of agonist activity at receptor subtypes: comparison of native and cloned M3 muscarinic receptors in guinea pig ileum and transfected cells. Journal of Pharmacology and Experimental Therapeutics. 289, 981-992 (1999).
- Burstein, E. S., Spalding, T. A., Brann, M. R. Pharmacology of muscarinic receptor subtypes constitutively activated by G proteins. Mol. Pharmacol. 51, 312-319 (1997).