

Summary
Microbial biofilms are generally constituted by distinct subpopulations of specialized cells. Single-cell analysis of these subpopulations requires the use of fluorescent reporters. Here we describe a protocol to visualize and monitor several subpopulationswithin B. subtilis biofilms using fluorescence microscopy and flow cytometry.
Abstract
Biofilm formation is a general attribute to almost all bacteria 1-6. When bacteria form biofilms, cells are encased in extracellular matrix that is mostly constituted by proteins and exopolysaccharides, among other factors 7-10. The microbial community encased within the biofilm often shows the differentiation of distinct subpopulation of specialized cells 11-17. These subpopulations coexist and often show spatial and temporal organization within the biofilm 18-21.
Biofilm formation in the model organism Bacillus subtilis requires the differentiation of distinct subpopulations of specialized cells. Among them, the subpopulation of matrix producers, responsible to produce and secrete the extracellular matrix of the biofilm is essential for biofilm formation 11,19. Hence, differentiation of matrix producers is a hallmark of biofilm formation in B. subtilis.
We have used fluorescent reporters to visualize and quantify the subpopulation of matrix producers in biofilms of B. subtilis 15,19,22-24. Concretely, we have observed that the subpopulation of matrix producers differentiates in response to the presence of self-produced extracellular signal surfactin 25. Interestingly, surfactin is produced by a subpopulation of specialized cells different from the subpopulation of matrix producers 15.
We have detailed in this report the technical approach necessary to visualize and quantify the subpopulation of matrix producers and surfactin producers within the biofilms of B. subtilis. To do this, fluorescent reporters of genes required for matrix production and surfactin production are inserted into the chromosome of B. subtilis. Reporters are expressed only in a subpopulation of specialized cells. Then, the subpopulations can be monitored using fluorescence microscopy and flow cytometry (See Fig 1).
The fact that different subpopulations of specialized cells coexist within multicellular communities of bacteria gives us a different perspective about the regulation of gene expression in prokaryotes. This protocol addresses this phenomenon experimentally and it can be easily adapted to any other working model, to elucidate the molecular mechanisms underlying phenotypic heterogeneity within a microbial community.
Protocol
1. Labeling B. subtilis and Biofilm Formation Assay
- Amplify by PCR the promoter region of the gene of interest. We show as example the cloning of PtapA, the promoter of the genes responsible for the production of TasA matrix protein 26. Clone PtapA into pkm008 vector (created by the Rudner lab, Harvard Medical School. Boston, USA) (Fig. 2).
- Linearize the plasmids by enzymatic digestion (Enzyme recommended, XhoI).
- Induce natural competence in B. subtilis strain 168 by following the one-step protocol previously described by Harwood and Cutting 27.
- Add the linearized plasmids into the culture of competent cells and select for spectinomycin resistance after two hours of incubation.
- Strains obtained have inserted the construct into the neutral amyE locus of B. subtilis by double recombination (Fig 4). To create a double-labeled strain, integrate the second reporter into the neutral locus lacA by using the plasmid pDR183 we present in the figure 3. Insert this reporter using the same technique we described above for the insertion of reporters cloned in pKM008.
- Transfer the reporter from the strain 168 to NCIB3610 that is able to form biofilms. Use the SPP1 phage transduction protocol 28,29. Grow donor strain in TY medium (LB+10mM MgSO4+10μM MnSO4). Mix 200 μl of the culture with 100 μl of phage stock dilution. Add 3 ml of soft agar after 30 min of incubation and allow phage halos to arise at 37 °C.
- Collect the soft agar. Centrifuge it and pass the supernatant thought a syringe 0.22 μm filter. Use this supernatant to infect a culture of the recipient strain grown in TY medium. Add 30 μl to 10 ml of culture diluted 1:10. Incubate for 30 min and select for antibiotic resistance after 24 h of incubation.
- Select a colony and grow it overnight on LB at 37 °C.
- Spot 3 μL of the overnight culture on solid biofilm-inducing medium MSgg 1.5 % agar 30. Allow cells to grow during 72 hours at 30 °C (Figure 3). After three days of growth, biofilms formed on the surface of the MSgg agar developed a complex morphological architecture in the surface of the agar.
2. Biofilm Dispersion and Cell Fixation
- Remove the biofilm form the surface of the MSgg agar using a toothpick or tweezers. The consistency of the biofilm should allow you to to peel it off from the surface of the agar in one piece.
- Place the biofilm in 3 ml of PBS buffer and disperse the biofilm by repetitive passage through a pipette or a needle. Alternatively, biofilm dispersion can be done using mild sonication. Mild sonication requires 12 pulses with an output of 3 and amplitude of 0.7 seconds.
- Fix samples prior cell-single analysis. Resuspend 300 μL of the cell suspension in 1 ml of 4% paraformaldehyde solution and incubate at room temperature for exactly seven minutes.
Composition of 4% paraformaldehyde solution:
2 g of paraformaldehyde
50 ml of PBS buffer
4 μl 10 N NaOH
Filter the solution through a 0.22 um filter and aliquot - Wash cells after fixation in PBS buffer three times and resuspend them in 300 μL of PBS buffer.
3. Fluorescence Microscopy
- Pour 200 μL of 0.8% agarose over a microscope slide and carefully cover it with another slide. Remove the upper slide softly after 2 minutes to obtain a layer of agarose attached to the slide of the bottom.
- Spot 2 μL of fixed cells on the surface of the agarose layer and cover it with a microscope cover glass.
- Place the sample in the fluorescence microscope. We use a Fluorescence microscope Leica DMI6000B equipped with a Leica CRT6000 iIlumination system. The filters for YFP are Ex: BP500/20, Em: BP535/30 and for CFP are Ex: BP426/20, Em: 480/40
- Expose your sample to an excitation fluorescence between 50-200 ms. Set the excitation period according to a negative control which shows no fluorescence in the conditions selected for the experiment.
- Refer the fluorescence image to the same image obtained with bright field. Merge the two images in one picture. Results obtained from flow fluorescence microscopy using a single-labeled strain harboring the reporter PtapA-YFP are represented in figure 6.
4. Quantification of Single Cells Using Flow Cytometry
- Disperse the sample of fixed cells using mild sonication. Sonicate the sample performing 2 series of 12 pulses with an output of 5 and amplitude of 0.7 seconds, to disperse clumps into single cells without causing cell lysis. Confirm the efficiency of cell dispersion by light microscopy.
- Dilute sample 1:100 in PBS buffer before flow cytometry analysis. We use a flow cytometer BD FACS Canto II. For YFP fluorescence, use a laser excitation at 488 nm coupled with a 530/30 filter. For CFP fluorescence, use the laser excitation at 405 nm coupled with a 408/40 filter.
- Calibrate the flow cytometer machine with two negative controls. A sample of PBS buffer with no cells in suspension should serve as negative control for the size of the particles sensed by the flow cytometer. A sample labeled with no fluorescence reporter should be serve as negative control for the fluorescence sensitivity of the flow cytometer.
- Place the sample labeled with the fluorescent reporter in the flow cytometer. For each sample, analyze at least 50,000 events with a flow rate between 300 and 3000 events per second.
- Capture data using FACS Diva software (BD Biosciences) and analyze it using FlowJo 8.5.2 software. Refer fluorescence signals to the control that shows no fluorescence.
- Present the data monitoring the fluorescence signal of a single-labeled strain in a two-axes graphic. Plot the fluorescence signal detected in the X axis and the number of cells expressing the different levels of fluorescence in the Y axis. Results obtained from flow cytometry analysis using a single-labeled strain harboring the reporter PtapA-YFP are represented in figure 8.
- Present the data monitoring the fluorescence signal of a double-labeled strain in a three-axes graphic. Plot the fluorescence signal of each one of the channels monitored in X and Y axes (for example, GFP would be measured in the X-axis and CFP in the Y-axis). Plot in the Z-axis the number of cells expressing each reporter and present them as contour isolines that would be perpendicular to the plane of the paper (Fig. 9 and 10).
4. Representative Results
When B. subtilis grows on a plate of the biofilm-inducing medium MSgg, biofilm formation is observed after three days of incubation at 30 °C 30. The biofilm shows strong consistency and it could be peeled off from the surface of the agar in one piece. Moreover, the biofilm shows a complex morphological architecture that is indicative of the distinct participating cell subpopulations (Fig. 5). For instance, production of the extracellular matrix in biofilms results in the formation of wrinkles on the surface of the colony. This feature can be correlated with the differentiation of the subpopulation of matrix producers 19. Similarly, the raising of aerial structures on the surface of the biofilm is indicative of the presence of a subpopulation of sporulating cells, since the spores localized in the apical area of these structures 30.
Examples of visualization of cell differentiation in a single-labeled and a double-labeled strain using fluorescence microscopy are represented in figure 6 and 7, respectively. The single-labeled strain harbors the fluorescent reporter PtapA-CFP that is expressed in the subpopulation of matrix producing cells. This subpopulation is responsible to produce and secrete the extracellular matrix that constitutes the biofilm (Fig. 6). The double-labeled strain harbors the reporter PtapA-CFP 26 and the additional reporter PsrfAA-YFP 31. This second reporter allows to monitor the subpopulation of cells responsible to secrete the signaling molecule surfactin, which triggers the signaling cascade to the differentiation of the matrix producers (Fig. 7). Subpopulation of matrix producers are false colored in blue while the subpopulation of surfactin producers is false colored in yellow.
Flow cytometry analysis using a single-labeled strain harboring the reporter PtapA-YFP is presented in figure 8. Untreated control strain not harboring any fluorescent protein genes showed a single population low relative fluorescence. Cells harboring PtapA-YFP in non biofilm-inducing conditions did not differentiate the subpopulation of matrix producers and the whole population showed low relative fluorescence. In biofilm-inducing condition, a subpopulation of cells with high relative fluorescence occurred, observed as a shoulder to the right of the low relative fluorescence peak 23.
Results obtained from flow cytometry analysis using a double-labeled strain are represented in figure 9 and 10. Figure 9 monitored the subpopulations of matrix producers and surfactin producers using the double-labeled strain PtapA-CFP, PsrfAA-YFP. As control of background fluorescence we used a strain not harboring any fluorescent protein genes. Next, we detected each subpopulation of matrix producers and surfactin producers in each fluorescence channel, using single-labeled strains as controls. The double-labeled strain PtapA-CFP, PsrfAA-YFP showed two subpopulations of cells expressing high levels of the fluorescent reporters. Each population is framed, showing that there is no overlap in the expression of the reporters between the two subpopulations of specialized cells 15. Similarly, flow cytometry analysis using double-labeled strain Pskf-YFP, PtapA-YFP is presented in figure 10. The reporter for the gene skf monitors the differentiation of the subpopulation of cannibals 32, which has been described to differentiate coordinately with the subpopulation of matrix producers 24. In this case, the double-labeled strain showed a single subpopulation of fluorescent cells expressing both YFP and CFP. This indicated that both cell differentiation pathways are coordinately activated in the same subpopulation.

Figure 1. Overall scheme of the Experiment. The protocol is divided in three main steps. The first step requires labeling the strain of B. subtilis with the reporter fusion that monitors the subpopulation of interest. Second, grow labeled strains in biofilm-inducing conditions. Third, disperse the biofilm and carry out single-cell analysis of the population using fluorescence microscope and flow cytometry.

Figure 2. Schematic representation of the integration vector pKM008. This vector integrates the reporter fusion of interest into the neutral locus amyE by double recombination. The promoter of interest (PtapA) is cloned into vector using the restriction sites EcoRI and HindIII. Then, the expression of the cfp gene is under the control of the promoter PtapA. The orientation of the genes in the plasmid is represented as an arrow.

Figure 3. Schematic representation of the integration vector pDR183. This vector integrates the reporter fusion of interest into the neutral locus lacA by double recombination. The fusion of interest (PtapA-cfp) is cloned into vector using the restriction sites EcoRI and BamHI. The orientation of the genes in the plasmid is represented as an arrow.

Figure 4. Scheme of the integration of the reporters into the chromosome of B. subtilis by double recombination. (A) B. subtilis chromosome has two neutral loci, amyE and lacA, to integrate reporter fusions without affecting the development of the biofilm. (B) Process of double recombination of pKM008. Linearized plasmid integrates into the genome of B. subtilis by double recombination. The reporter fusion integrates into the neutral locus in a stable manner.

Figure 5. Biofilm formation of B. subtilis NCIB3610. Process of bioflm formation of the strain B. subtilis NCIB 3610 when growing on the biofilm-inducing medium MSgg during three days at 30 °C. Sequential pictures of the development of biofilm were taken every 12h.

Figure 6. Visualization of the subpopulation of matrix producers under the fluorescence microscope. A sample from a biofilm of B. subtilis PtapA-cfp was fixed and examined under the fluorescence microscope. 200 ms of fluorescence excitation evidenced a subpopulation of cells emitting higher fluorescence than the rest of the cells. We considered this subpopulation as the subpopulation of matrix-producing cells. Scale bar is 3 μm.

Figure 7. Visualization of the subpopulation of matrix producers and surfactin producers under the fluorescence microscope. Sample from a biofilm of the B. subtilis P tapA-cfp, PsrfAA-yfp double-labeled strain was fixed and examined under the fluorescence microscope. Exposure time of 250 ms evidenced two subpopulations of cells emitting higher fluorescence than the rest of the cells. One subpopulation expressed YFP and it was detected exclusively using the YFP channel (false colored in yellow). This is the subpopulation of surfactin producers. Another subpopulation expressed CFP and it was exclusively detected using the CFP channel. This is the subpopulation of matrix producers. Scale bar is 3 μm.

Figure 8. Quantification of the subpopulation of matrix producers using 2-D flow cytometry. Dispersed cells from a biofilm of B. subtilis PtapA-yfp were monitored using flow cytometry. The flow cytometer counted 50.000 events and the fluorescence signal for each event was monitored. Number of cells counted is plotted in Y axis while the intensity of YFP signal is plotted in the X axis. Cells were grown in LB medium to obtain non-biofilm inducing conditions. Cells were grown in MSgg medium to obtain biofilm-inducing conditions. The subpopulation of matrix producers differentiates only in biofilm-inducing conditions. This figure was adapted from López et al., PNAS (2009) 106:280-285.
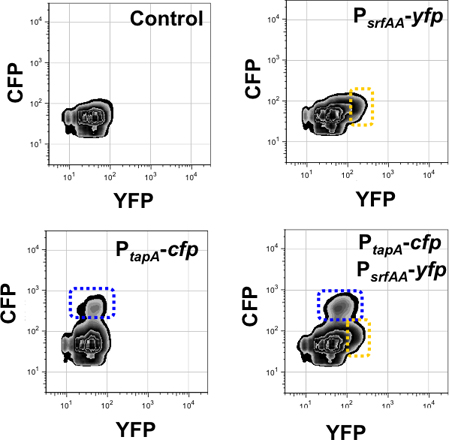
Figure 9. Quantification of the subpopulation of matrix producers and surfactin producers using 3-D flow cytometry. Fluorescence signal of the channels monitored are presented in the X axis (for YFP) and Y axis (for CFP). The Z-axis measures the number of cells expressing each reporter and it is quantified as contour isolines perpendicular to the plane of the paper. The number of events monitored in this experiment was 50.000 events. Left upper panel presents a control of background fluorescence harboring no fluorescent protein genes. Right upper panel detects the subpopulation of surfactin producers in the YFP fluorescence channel (framed in yellow) using a single-labeled strain PsrfAA-YFP. Left bottom panel detects the subpopulation of matrix producers in the CFP fluorescence channel (framed in blue) using a single-labeled strain PtapA-CFP. The double-labeled strain PtapA-CFP, PsrfAA-YFP is monitored in the right bottom panel. It showed two subpopulations that are framed in yellow and blue. This figure was adapted from López et al., Genes and Development (2009) 23:1631-1638.

Figure 10. Quantification of the subpopulation of matrix producers and cannibals using 3-D flow cytometry. Fluorescence signal of the channels monitored are presented in the X axis (for YFP) and Y axis (for CFP). The number of events monitored in this experiment was 50.000. Right upper panel detects the subpopulation of cannibals in the YFP fluorescence channel (framed in yellow) in a single-labeled strain Pskf-YFP. Left bottom panel detects the subpopulation of matrix producers in the CFP fluorescence channel (framed in blue) in a single-labeled strain PtapA-CFP. The double-labeled strain PtapA-CFP, Pskf-YFP showed only one subpopulation of cells in diagonal to the X and Y axes (framed in green). This subpopulation is detected in the YFP and CFP channel because it expresses the two reporters simultaneously. López et al., Genes and Development (2009) 23:1631-1638.
Subscription Required. Please recommend JoVE to your librarian.
Discussion
The fact that bacterial communities show subpopulations of cells expressing specific set of genes evidences the complexity of microbial communities 33,34. This protocol should help to determine whether the expression of any gene of interest is restricted to a particular subpopulation of specialized cells within the microbial community. Visualization of these subpopulations requires the development of new techniques, because traditional methods to monitor gene expression or microarray analysis rate the levels of gene expression to the whole microbial community and fluctuations of gene expression within the microbial community are generally missed.
Fluorescence microscopy and flow cytometry complement ideally for the analysis of cell types to provide a combination of qualitative and quantitative that will define of the subpopulation of interest. Limitations of both techniques make them necessary to refer to each other for the sake of accuracy of the measurements. In the case of fluorescence microscopy, the intensity of the signal from fluorescent cells (and sometimes the size of the subpopulation) varies depending on the exposure time used to excite the samples (normally between 50 and 200 msec). In the case of the flow cytometry however, the small size of the bacterial cells limits the detection and some bacterial cannot be monitored. Due to cell size restrictions, the fluorescence signal emitted by the reporter should be high enough to allow the detection of fluorescence and, precisely because of this, we have experienced problems in the detection of cells expressing reporters with low expression level. However, new flow cytometers now come with a more sensitive detection limit, which allows us to monitor bacterial populations in a more precise manner. Additionally, the higher sensitivity in the detection limit will allow us to assay for cell sorting, to isolate the subpopulation of cells we are interested in and carry out gene expression analysis in this particular subpopulation.
Subscription Required. Please recommend JoVE to your librarian.
Disclosures
We have nothing to disclose.
Acknowledgments
This work is funded by the Young Investigator Research Program, from the Centre for Infectious Disease Research (ZINF) from the University of Würzburg. Juan C Garcia-Betancur is a PhD fellow from the Graduate School of Life Sciences (GSLS) of the University of Würzburg.
References
- Costerton, J. W. Overview of microbial biofilms. J. Ind. Microbiol. 15, 137-140 (1995).
- Davey, M. E., O'Toole, G. A. Microbial biofilms: from ecology to molecular genetics. Microbiol. Mol. Biol. Rev. 64, 847-867 (2000).
- Kolenbrander, P. E. Oral microbial communities: biofilms, interactions, and genetic systems. Annu. Rev. Microbiol. 54, 413-437 (2000).
- O'Toole, G., Kaplan, H. B., Kolter, R. Biofilm formation as microbial development. Annu. Rev. Microbiol. 54, 49-79 (2000).
- Donlan, R. M. Biofilms: microbial life on surfaces. Emerg. Infect. Dis. 8, 881-890 (2002).
- Lopez, D., Vlamakis, H., Kolter, R. Biofilms. Cold Spring Harb. Perspect. Biol. 2, a000398-a000398 (2010).
- Branda, S. S., Vik, S., Friedman, L., Kolter, R. Biofilms: the matrix revisited. Trends Microbiol. 13, 20-26 (2005).
- Branda, S. S., Chu, F., Kearns, D. B., Losick, R., Kolter, R. A major protein component of the Bacillus subtilis biofilm matrix. Mol. Microbiol. 59, 1229-1238 (2006).
- Latasa, C., Solano, C., Penades, J. R., Lasa, I. Biofilm-associated proteins. C. R. Biol. 329, 849-857 (2006).
- O'Gara, J. P. ica and beyond: biofilm mechanisms and regulation in Staphylococcus epidermidis and Staphylococcus aureus. FEMS Microbiol Lett. 270, 179-188 (2007).
- Chai, Y., Chu, F., Kolter, R., Losick, R. Bistability and biofilm formation in Bacillus subtilis. Mol. Microbiol. 67, 254-263 (2008).
- Chen, R., Guttenplan, S. B., Blair, K. M., Kearns, D. B. Role of the sigmaD-dependent autolysins in Bacillus subtilis population heterogeneity. J. Bacteriol. 191, 5775-5784 (2009).
- Guttenplan, S. B., Blair, K. M., Kearns, D. B. The EpsE flagellar clutch is bifunctional and synergizes with EPS biosynthesis to promote Bacillus subtilis biofilm formation. PLoS Genet. 6, e1001243-e1001243 (2010).
- Kearns, D. B., Losick, R. Cell population heterogeneity during growth of Bacillus subtilis. Genes Dev. 19, 3083-3094 (2005).
- Lopez, D., Vlamakis, H., Losick, R., Kolter, R. Paracrine signaling in a bacterium. Genes Dev. 23, 1631-1638 (2009).
- Veening, J. W., Smits, W. K., Hamoen, L. W., Jongbloed, J. D., Kuipers, O. P. Visualization of differential gene expression by improved cyan fluorescent protein and yellow fluorescent protein production in Bacillus subtilis. Appl. Environ. Microbiol. 70, 6809-6815 (2004).
- Veening, J. W., Smits, W. K., Hamoen, L. W., Kuipers, O. P. Single cell analysis of gene expression patterns of competence development and initiation of sporulation in Bacillus subtilis grown on chemically defined media. J. Appl. Microbiol. 101, 531-541 (2006).
- Veening, J. W., Kuipers, O. P., Brul, S., Hellingwerf, K. J., Kort, R. Effects of phosphorelay perturbations on architecture, sporulation, and spore resistance in biofilms of Bacillus subtilis. J. Bacteriol. 188, 3099-3109 (2006).
- Vlamakis, H., Aguilar, C., Losick, R., Kolter, R. Control of cell fate by the formation of an architecturally complex bacterial community. Genes Dev. 22, 945-953 (2008).
- Stewart, P. S., Franklin, M. J. Physiological heterogeneity in biofilms. Nat. Rev. Microbiol. 6, 199-210 (2008).
- Veening, J. W., Smits, W. K., Kuipers, O. P. Bistability, epigenetics, and bet-hedging in bacteria. Annu. Rev. Microbiol. 62, 193-210 (2008).
- Aguilar, C., Vlamakis, H., Guzman, A., Losick, R., Kolter, R. KinD is a checkpoint protein linking spore formation to extracellular-matrix production in Bacillus subtilis biofilms. MBio. 1, (2010).
- Lopez, D., Fischbach, M. A., Chu, F., Losick, R., Kolter, R. Structurally diverse natural products that cause potassium leakage trigger multicellularity in Bacillus subtilis. Proc. Natl. Acad. Sci. U.S.A. 106, 280-285 (2009).
- Lopez, D., Vlamakis, H., Losick, R., Kolter, R. Cannibalism enhances biofilm development in Bacillus subtilis. Mol. Microbiol. 74, 609-618 (2009).
- Arima, K., Kakinuma, A., Tamura, G. Surfactin, a crystalline peptidelipid surfactant produced by Bacillus subtilis: isolation, characterization and its inhibition of fibrin clot formation. Biochem. Biophys. Res. Commun. 31, 488-494 (1968).
- Romero, D., Vlamakis, H., Losick, R., Kolter, R. An accessory protein required for anchoring and assembly of amyloid fibres in B. subtilis biofilms. Mol. Microbiol. 80, 1155-1168 (2011).
- Hardwood, C. R., Cutting, S. M. Molecular Biological Methods for Bacillus. , Wiley. (1990).
- Novick, R. P. Genetic systems in staphylococci. Methods Enzymol. 204, 587-636 (1991).
- Yasbin, R. E., Young, F. E. Transduction in Bacillus subtilis by bacteriophage SPP1. J. Virol. 14, 1343-1348 (1974).
- Branda, S. S., Gonzalez-Pastor, J. E., Ben-Yehuda, S., Losick, R., Kolter, R. Fruiting body formation by Bacillus subtilis. Proc. Natl. Acad. Sci. U.S.A. 98, 11621-11626 (2001).
- Nakano, M. M. srfA is an operon required for surfactin production, competence development, and efficient sporulation in Bacillus subtilis. J. Bacteriol. 173, 1770-1778 (1991).
- Gonzalez-Pastor, J. E., Hobbs, E. C., Losick, R. Cannibalism by sporulating bacteria. Science. 301, 510-513 (2003).
- Aguilar, C., Vlamakis, H., Losick, R., Kolter, R. Thinking about Bacillus subtilis as a multicellular organism. Curr. Opin. Microbiol. 10, 638-643 (2007).
- Shapiro, J. A. Thinking about bacterial populations as multicellular organisms. Annu. Rev. Microbiol. 52, 81-104 (1998).
