

Summary
Time-lapse microscopy of fluorescently labeled autophagy markers allows monitoring of the dynamic autophagy response with high temporal resolution. Using specific autophagy and organelle markers in a combination of 3 different colors, we can follow the contribution of a protein to autophagosome formation in a robust spatial and temporal context.
Abstract
Autophagy is a cellular response triggered by the lack of nutrients, especially the absence of amino acids. Autophagy is defined by the formation of double membrane structures, called autophagosomes, that sequester cytoplasm, long-lived proteins and protein aggregates, defective organelles, and even viruses or bacteria. Autophagosomes eventually fuse with lysosomes leading to bulk degradation of their content, with the produced nutrients being recycled back to the cytoplasm. Therefore, autophagy is crucial for cell homeostasis, and dysregulation of autophagy can lead to disease, most notably neurodegeneration, ageing and cancer.
Autophagosome formation is a very elaborate process, for which cells have allocated a specific group of proteins, called the core autophagy machinery. The core autophagy machinery is functionally complemented by additional proteins involved in diverse cellular processes, e.g. in membrane trafficking, in mitochondrial and lysosomal biology. Coordination of these proteins for the formation and degradation of autophagosomes constitutes the highly dynamic and sophisticated response of autophagy. Live cell imaging allows one to follow the molecular contribution of each autophagy-related protein down to the level of a single autophagosome formation event and in real time, therefore this technique offers a high temporal and spatial resolution.
Here we use a cell line stably expressing GFP-DFCP1, to establish a spatial and temporal context for our analysis. DFCP1 marks omegasomes, which are precursor structures leading to autophagosomes formation. A protein of interest (POI) can be marked with either a red or cyan fluorescent tag. Different organelles, like the ER, mitochondria and lysosomes, are all involved in different steps of autophagosome formation, and can be marked using a specific tracker dye. Time-lapse microscopy of autophagy in this experimental set up, allows information to be extracted about the fourth dimension, i.e. time. Hence we can follow the contribution of the POI to autophagy in space and time.
Introduction
Autophagy is a highly dynamic process, which requires the coordination of a large number of proteins for the final outcome of autophagosome formation1-3. Microscopy is probably the technique most commonly applied for studying autophagy4. The localization of most autophagy proteins has been extensively studied in fixed cells, both by immuno-staining the endogenous proteins and by expression of fluorescently tagged exogenous protein. In addition, Electron Microscopy (EM), alone and in combination with immuno-gold labeling, has described the fine details of these structures5,6 . Despite the fact that these techniques have established our understanding of autophagosome formation in the 3 dimensions of space, they have failed to provide sufficient amount of information about the 4th dimension - time. Live cell imaging overcomes this barrier as it allows following the formation of an autophagosome as close as possible to real time7. This technique was first employed to study autophagy by Yoshimori and colleagues8, and has been increasingly used henceforth.
Time-lapse microscopy captures the localization of the POI in live cells and over a period of time. By comparing this information with a well-characterized autophagy and/or organelle marker, live cell imaging analysis can put the POI in the greater spatial and temporal context of autophagosome formation. Live cell imaging analysis is based on the repetitive capturing of the POI localization along all the steps of autophagosome formation, while imaging of fixed cells is based on a single capture. Therefore, live cell imaging can prove the contribution of the POI at specific steps of autophagosome formation, while imaging of fixed cells can only assume the role of POI, based on its average localization in many autophagosomes simultaneously captured at different stages of their lifecycle.
Although live cell imaging is a method of high analytical power, it has some inherent limitations, which should be taken into consideration. First of all, live cell imaging requires the expression of one or more exogenous fluorescently labeled proteins. Fluorescent tags tend to be big in size and they can sometimes alter the behavior of a protein due to steric reasons. This situation is accentuated for membrane proteins, as they need to function in the limited space of the 2 dimensions of membranes. Of note, autophagosomes are membranous structures, and accordingly their formation requires a large number of membrane-associated proteins.
Another set of problems is connected to the expression levels of the POI. In principle, an exogenous protein should be expressed at levels comparable to the endogenous protein. This ensures that important regulators of its sub-cellular localization will not be saturated, and the analysis will be biologically relevant. Moreover, overexpression of autophagy proteins should be avoided, as when they are expressed above the endogenous levels, they tend to inhibit the autophagy response9. Conversely, since the expression levels of the POI should be high enough to allow following its localization for a good period of time without photo-bleaching, a compromise has to be reached. Achieving the optimal expression levels of an exogenous protein in mammalians cells requires a lot of fine tuning, but it is feasible by establishing and screening cell lines stably expressing different levels of the POI.
The spatial resolution that can be achieved with standard fluorescence microscopy is another limiting factor. Resolution may be limited for a number of reasons, but at best, lateral resolution will be around 250 nm. This means that any objects separated by a distance smaller than this will appear connected (or as a single object) and objects smaller than 250 nm will be represented in the image larger than they actually are. Therefore images should always be interpreted with this in mind and complementary techniques such as EM will be required to resolve fine ultra-structural detail.
Finally, live cell imaging inherently requires exposing a cell to light, potentially for a prolonged period of time. This may alter the physiological responses of a cell, a phenomenon known as photo-toxicity.
We have successfully used live cell imaging of the PI3P-binding protein DFCP1 to describe for the first time that autophagosomes originate from PI3P-rich ring-like structures termed omegasomes, which are in close association with ER strands10,11 . We have clearly shown that LC3-positive structures start forming in close association with omegasomes. We here suggest that employing a cell line stably expressing GFP-DFCP1 for the live cell imaging of the protein of interest, establishes a robust spatial and temporal frame for the characterization of its role in autophagosome formation.
Subscription Required. Please recommend JoVE to your librarian.
Protocol
1. Cell Preparation
- Seed low passage number of HEK-293T cells stably expressing GFP-DFCP1 on 22 mm round coverslips; culture cells overnight in Dulbecco Modified Eagles's Medium (DMEM), to a confluency of 30-40% (aim for a confluency of 80% after 2 days - day of live cell imaging).
2. Cell Transfection
- Prepare the transfection complex mix for each plate, containing 100 μl OptiMEM I reduced serum medium, 3 μl X-tremeGENE 9 DNA Transfection Reagent, and 0.5 μg of pECFP-LC3 plasmid DNA. Mix gently by pipetting up and down and incubate 15 min at room temperature. (Note: we have repeatedly found that other transfection reagents, such as Lipofectamine 2000, have a lot of toxicity, and, in addition, they produce fluorescent particles on their own which interfere with many microscopy techniques.)
- Aspirate the medium from plates and add fresh DMEM pre-warmed at 37 °C.
- Add the transfection complex to cells by pipetting; incubate cells for 24 hr.
3. Cell Incubation with the Organelle Marker (Optional)
- Add mitotracker/lysotracker to DMEM at a final concentration of 75 nM, and keep on ice, in a falcon tube covered with aluminum foil, along the whole experimental day, to avoid light exposure and repetitive freezing and thawing cycles.
- Remove an aliquot of 2 ml of the mitotracker/lysotracker-containing medium and warm up at 37 °C; aspirate medium from transfected cells and replace with mitotracker/ lysotracker-containing medium and incubate cells for 30 - 60 min.
4. Preparation of Incubation Chamber for Live Cell Imaging (Figure 1)
- Clean metal and plastic O-rings with 75% ethanol and apply silicon grease on the rim of the metal O-ring.
- Using forceps remove the coverslip from the plate and dry the excess of medium from the bottom side of the coverslip, to avoid mixing too much medium with the grease, as this will increase the likelihood of leakage.
- Leave the coverslip to rest on the ledge of the plastic O-ring and fit the metal O-ring on top of the plastic O-ring, with the coverslip sandwiched in between, in order to create a closed chamber.
- Top up chamber with the medium from the plate; from this point and on, avoid prolonged incubation of the cells in DMEM medium without a buffering agent, to prevent changes in pH to occur, as the bicarbonate buffer system of DMEM requires artificial CO2 concentration of 5-10% and the CO2 concentration of ambient air is much lower.
5. Starvation of Cells
- Put the incubation chamber on the microscope stage.
- Aspirate the complete medium and wash with 2 ml of starvation medium 3 times, to ensure that no amino acids have remained from the DMEM, which will eventually inhibit the autophagy response; set the timer ON.
6. Microscopy
- An appropriate imaging system configured for live cell wide-field epi-fluorescence will be required. This will typically comprise a research-grade inverted microscope frame, an intense broad-spectrum light source, mirrors and filters specific for the fluorescent protein(s)/dye(s) of interest, a high quality objective lens, a sensitive CCD/sCMOS camera and an incubation chamber. All the major microscope manufacturers offer complete wide-field systems appropriate for live cell imaging, but it is also possible to home-build a system using components from a variety of manufacturers and control it using open source software such as Micro-Manager (http://valelab.ucsf.edu/~MM/MMwiki/). The most important aspect in our opinion is to use a system of high sensitivity so that expression levels of the fluorescent reporters can be kept to a minimum.
- Selecting the appropriate cells to image.
- Select large and flat cells that will allow more autophagosome formation events to be captured. Also, opt for cells that have already started producing a greater number of omegasomes.
- Start the video capture after 30 min or well into autophagy response, in order to capture a larger ratio of autophagosome formation events per video.
- Imaging.
- Use a high magnification lens (100x 1.4 NA).
- Adjust the intensity of excitation light to 10-20% of maximum to prevent photo-bleaching.
- Set the camera (Hamamatsu ORCA ER, pixel size 6.45 μm) to 100-500 msec exposure, 2x2 binning and 100 gain.
- Set the image acquisition rate to 1 frame every 10 sec.
7. Creating Montages of Autophagosome Formation Events with ImageJ
(Note: This can be done in a non-systematic way by simply scanning the merged video for events of interest, but it can also be systematized as outlined below.)
- Open image stacks for the 3 (or 2) captured channels in ImageJ/Fiji.
- Apply green, red and blue LUT (Lookup Tables) to the corresponding channel; merge 3 colors and save.
- From the Analyze tab, select Tools > ROI manager... > Specify, then select a random area of defined size in the first image of the stack.
- From the Image tab, select duplicate, in order to duplicate the selected area of the stack.
- From the Image tab, select Stacks > Make montage... to create a tentative montage containing all the frames captured. Scan all frames in the montage for a complete autophagosome formation event; keep notes of the first and last frame of the event.
- From the Analyze tab, select Tools > ROI manager... select the same area in the first image of the stack for the other 2 colors as well as for the merged colors image and duplicate stacks.
- From the File tab, select New > Image, and set for width according to the number of pixels initially selected using the ROI manager, set for height 4 times the height set in the ROI manager plus 3 pixels for space in between the 3 colors and the merged, and set Slices as the number of frames in each stack.
- From the Image tab, select Stacks > Tools > Insert..., then insert each sub-stack one on top of another, leaving space of 1 pixel in between.
- From the Image tab, select Stacks > Make montage... to create a montage starting and finishing with the first and last frame of the autophagosome formation event captured.
Subscription Required. Please recommend JoVE to your librarian.
Representative Results
In the protocol described, we have used time-lapse microscopy to follow the localization of CFP-tagged LC3 in a cell line stably expressing GFP-tagged DFCP1, under autophagy inducing conditions. The outcome of this experiment is the capture of 2 series or stacks of images, one from the green and one from the blue channel, corresponding to GFP-DFCP1 and CFP-LC3. We have further analyzed these videos using ImageJ, in order to create montages corresponding to single autophagosome formation events, as described in the protocol section. This analysis allowed us to prove that an LC3-positive autophagosome originates from a DFCP1-positive omegasome. In the montage shown in Figure 2, the formation of an omegasome becomes apparent from the second frame, in the form of a small spot. The omegasome starts expanding in order to form the characteristic ring-like structure, and reaches its maximum diameter after 6 min. Next, the omegasome starts collapsing and eventually it disappears, after approximately 10 min. Putting now the formation of the LC3-positive structure or autophagosome in the context of the omegasome formation, we observe that the autophagosome appears after the omegasome, and becomes clearly visible after approximately 1.5 min. The autophagosome starts expanding in close association with the omegasome, first spot and then ring, and when the omegasome starts collapsing the autophagosome buds off. Eventually the autophagosome stays behind, apparently to fuse with the lysosomes, after the omegasome disappears. This analysis provides a clear indication about the functional relationship between the 2 structures, according to which LC3 positive autophagosomes originate from corresponding omegasomes.
In another example, we have added a lysosome tracker in order to capture the temporal and spatial association of the forming autophagosome with lysosomes (Figure 3). Indeed, a few minutes after the collapse of the omegasome, the nascent autophagosome starts associating with lysosomes and eventually it fuses with one lysosome. Fusion of the autophagosome with the lysosome largely quenches CFP-LC3 fluorescence, presumably due to the exposure of the CFP tag in the acidic environment of the lysosome.
However, the same kind of analysis can produce uninterpretable results, due to a variety of reasons. In the example presented in Figure 4, the results become uninterpretable due to a drift in focus. Video starts successfully capturing the formation of an autophagosome, however a drift in focus occurs after the 3 min mark. The video capture continues out of focus for the next 6 min, but eventually the focus is manually corrected after the 9 to 10 min mark. This analysis though, makes impossible to discriminate whether the autophagosome formation event captured when the focus is corrected is the initial event which is almost completed, or a new one that has started after the drift in focus.
Additional problems can be attributed to the confluency of the cultured cells. For instance, when cells are grown at higher than optimal confluency, they are forced to expand on top of an adjacent cell, which makes focusing quite challenging. Moreover, cells that are grown at high confluency tend to be stressed, increasing the levels of background autophagy activity before the initiation of starvation.
Finally, fluorescence-related issues are quite common. CFP has weaker fluorescence activity compared to GFP, and often gets photo-bleached at later stages of the video capturing. Analysis of such videos can lead to false negative conclusions about the spatial association of the POI with forming autophagosomes. However, these problems can be overcome by using one of the variants such as mTurquise2. Another common phenomenon stems from the fact that the fluorescence of red tags is not quenched at the lower pH of lysosomes. Many autophagy proteins physiologically finish their lifecycle into lysosomes, while autophagosomes eventually fuse with lysosomes. Moreover, non-functional proteins are often targeted for degradation in lysosomes. Therefore, one might end up following the non-related association of autophagosomes with lysosomes, instead of an actual physical association of between a red-tagged POI and omegasomes.
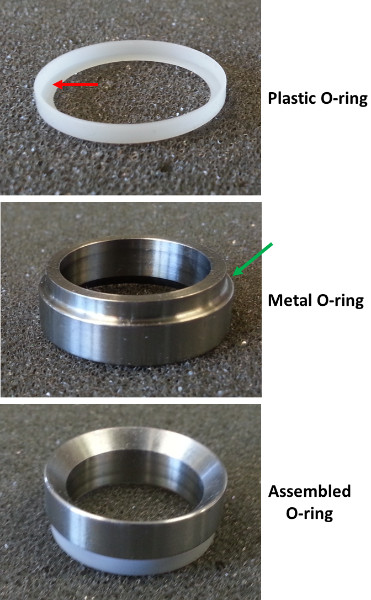
Figure 1. Incubation chamber. The plastic O-ring fits around the rim of the metal O-ring and has at the bottom a thin ledge which extends inwards. The coverslip is placed on the ledge of the plastic O-ring, and then the plastic O-ring is fitted at the bottom of the metal O-ring. This way, the coverslip is sandwiched between the 2 O-rings, creating a closed chamber.

Figure 2. Cells expressing GFP-DFCP1 and CFP-LC3 were starved for 30 min and imaged at a rate of 1 frame every 10 sec. A montage of a representative autophagosome formation event is presented. Signals from green and blue channels are pseudo-colored green and red correspondingly. Arrows indicate the first discernible omegasome and autophagosome. Click here to view larger figure.

Figure 3. Cells expressing GFP-DFCP1 and CFP-LC3, were incubated with lysotracker red, starved for 30 min and imaged at a rate of 1 frame every 15 sec. A montage of a representative autophagosome formation event is presented. Signals from green, red and blue channels are pseudo-colored green, blue and red correspondingly. Arrows indicate the first discernible omegasome and autophagosome. Arrowhead indicates the first capture of autophagosome fusion with the lysosome. Click here to view larger figure.

Figure 4. Cells expressing GFP-DFCP1 and CFP-LC3 were starved for 30 min and imaged at a rate of 1 frame every 10 sec. A montage of an example of sub-optimal capture is presented. Signals from green and blue channels are pseudo-colored green and red correspondingly. Arrows indicate the first discernible omegasome and autophagosome. Click here to view larger figure.
Video 1. Video of the autophagosome formation event presented in Figure 2. The playback rate is 4 frames per second. Click here to view movie.
Video 2. Video of the autophagosome formation event presented in Figure 3. The arrow indicates first, the formation of the omegasome, and second, the fusion of the autophagosome with the lysosome. The playback rate is 4 frames per second. Click here to view movie.
Video 3. Video of the autophagosome formation event presented in Figure 4. The playback rate is 4 frames per second. Click here to view movie.
| Name of Reagent/Material | Company | Catalog Number | Comments |
| DMEM | Invitrogen | 41965 | |
| OptiMEM I | Invitrogen | 31985-062 | |
| MitoTracker Red FM | Invitrogen | M22425 | |
| LysoTracker Red DND-99 | Invitrogen | L-7528 | |
| X-tremeGENE 9 DNA Transfection Reagent | Roche Applied Science | 6365787001 | |
| 22 mm coverslips | VWR | 631-0159 | |
| 35 mm plates | Fisher NUNC | 153066 | |
| Silicon grease | RS Components Ltd. | RS 494-124 | |
| O-rings | Custom made | ||
| Attofluor Cell Chamber | Invitrogen | A-7816 | Suggested alternative to custom-made O-rings |
| Microscope | Olympus | IX81 | Inverted microscope |
| Objective | Olympus | UPLSAPO 100XO | N.A. 1.4, W.D. 0.13, FN 26.5 |
| Camera | Hamamatsu | ORCA-R2 C10600 10B | Progressive scan interline CCD |
| Illuminator | TILL Photonics | Polychrome V | Ultrafast monochromator |
| Incubation chamber | Solent Scientific | Cell^R IX81 | |
| Software | Olympus | SIS xcellence |
Table 1. List of specific reagents and equipment required for the protocol, along with the corresponding provider and catalogue number.
Buffers
| Buffer | Composition | Step Used |
| Starvation medium | 20 mM HEPES pH 7.4 | 5.2 |
| 140 mM NaCl | ||
| 1 mM CaCl2 | ||
| 1 mM MgCl2 | ||
| 5 mM Glucose | ||
| 1% BSA |
Table 2. List of buffers used in this protocol. The buffers used, their composition and the first step at which they are used in the protocol are listed.
Subscription Required. Please recommend JoVE to your librarian.
Discussion
The method described in this protocol allows the visualization of a protein's localization during autophagosome formation. We have tried various methods of visualizing the events described including point-scanning confocal, spinning disk confocal and Total Internal Reflection Fluorescence (TIRF) microscopy. We have found that for general purposes standard wide-field epi-fluorescence provides the best compromise between sensitivity and resolution. This ensures good signal to noise, minimal photo-bleaching/photo-toxicity and fast acquisition. The lack of optical sectioning is not an issue if appropriate regions of the cell are chosen to image i.e. the periphery where the cell is spread and flat. However, it is important that the imaging system used is appropriately configured (both in terms of the hardware used and the system settings).
For best spatial resolution, it is recommended to use a high magnification, high numerical aperture oil immersion lens (water immersion lenses will offer no benefit imaging at close proximity to the coverslip). It is suggested to balance the intensity of illumination (e.g. with neutral density filters), the camera settings (exposure time, binning and gain) to maximize the signal-to-noise and minimize bleaching. This will have to be done empirically, but as a guide, when using a 100x 1.4 NA lens we typically reduce the power of our excitation light to 10-20% of maximum and set the camera (Hamamatsu ORCA ER, pixel size 6.45 μm) to 100-500 msec exposure, 2x2 binning and 100 gain.
The image acquisition rate should be set in the range of 1 frame every 1-10 sec. Acquiring images at higher frame rates will ensure better continuity between images (better temporal resolution) but will expose cells to more light and thus increase photo-bleaching/photo-toxicity.
If imaging more fluorescence channels, it has to be ensured that the delay between channel capture is minimized (reduce exposure time, fit fast filter changers). This will reduce the chances of motion artifacts appearing in the composite image. If motion artifacts are proving difficult to avoid consider using an image splitter (a device to facilitate the simultaneous acquisition of two fluorescence channels using one camera) or a dual camera adapter.
Imaging blue channel requires the selection of suitable filters and mirrors to prevent cross-emission of the blue fluorescence to the green channel. We have successfully used an Olympus CellR microscope, which uses the Till Polychrome V illuminator, enabling specific selection of wavelength, bandwidth and intensity and so is very flexible. However, the light source is 'leaky' with some white light coming through in addition to the selected wavelengths.For this reason we have fitted (multi) bandpass excitation filters in the cubes, so there is additional filtering of the excitation light. The following combination of mirrors/filters was used (all Semrock). For GFP & mCherry: Exciter FF01-479-585, Emitter FF02-525/40 (GFP) and FF01-607/36 (mCherry), Dichroic Mirror FF505/606-Di01. For CFP: Exciter FF01-416/501, Emitter FF01-523/610, Dichroic Mirror FF440/520-Di01. We have also used a different CellR microscope, which has given sub-optimal results, with cross-emission of blue fluorescence to the green channel. This microscope uses a white light source and has a fast filter wheel to select the excitation wavelengths.This means that the wavelength selection is limited to the 8 filters in the wheel, but there is a separate wheel to regulate intensity. The following combination of mirrors/filters was used. For GFP (Semrock): Exciter FF01-470/40, Emitter FF02-525/50, Dichroic Mirror FF495-Di02. For CFP and mCherry: Exciter FF01-427/10 (CFP, Semrock) 572/23 (mCherry, Chroma), Emitter FF01-472/30 (CFP, Semrock) 632/60 (mCherry, Chroma), Dichroic Mirror 89006bs (Chroma).
The significance of this technique compared to other imaging techniques is two-fold: First, it can capture the localization of the protein of interest in live cells, and second, it can increase the information extracted adding the fourth dimension of time. However, as with exogenous proteins there is always the possibility of mislocalization, either due to increased expression levels or due to tagging, therefore live cell imaging should be combined with immuno-staining of the endogenous POI in fixed cells, in order to corroborate the results. Finally, it is worthwhile noting that live cell imaging can be combined with immuno-EM, in order to increase the spatial resolution of the analysis.
Subscription Required. Please recommend JoVE to your librarian.
Disclosures
No conflicts of interest declared.
Acknowledgments
Our work is supported by the Biotechnology and Biological Sciences Research Council. We would like to thank Prof Tamotsu Yoshimori for kindly supplying us with the plasmid for the expression of CFP-LC3.
Materials
| Name | Company | Catalog Number | Comments |
| DMEM | Invitrogen | 41965 | |
| OptiMEM I | Invitrogen | 31985-062 | |
| MitoTracker Red FM | Invitrogen | M22425 | |
| LysoTracker Red DND-99 | Invitrogen | L-7528 | |
| X-tremeGENE 9 DNA Transfection Reagent | Roche Applied Science | 6365787001 | |
| 22 mm coverslips | VWR | 631-0159 | |
| 35 mm plates | Fisher NUNC | 153066 | |
| Silicon grease | RS Components Ltd. | RS 494-124 | |
| O-rings | Custom made | ||
| Attofluor Cell Chamber | Invitrogen | A-7816 | Suggested alternative to custom-made O-rings |
| Microscope | Olympus | IX81 | Inverted microscope |
| Objective | Olympus | UPLSAPO 100XO | N.A. 1.4, W.D. 0.13, FN 26.5 |
| Camera | Hamamatsu | ORCA-R2 C10600 10B | Progressive scan interline CCD |
| Illuminator | TILL Photonics | Polychrome V | Ultrafast monochromator |
| Incubation chamber | Solent Scientific | Cell^R IX81 | |
| Software | Olympus | SIS xcellence |
References
- Mizushima, N. Autophagy: process and function. Genes Dev. 21, 2861-2873 (2007).
- Mizushima, N., Yoshimori, T., Ohsumi, Y. The role of Atg proteins in autophagosome formation. Annual review of cell and developmental biology. 27, 107-132 (2011).
- Klionsky, D. J. Autophagy: from phenomenology to molecular understanding in less than a decade. Nat. Rev. Mol. Cell Biol. 8, 931-937 (2007).
- Klionsky, D. J. Autophagy revisited: a conversation with Christian de Duve. Autophagy. 4, 740-743 (2008).
- Yla-Anttilba, P., Vihinen, H., Jokitalo, E., Eskelinen, E. L. 3D tomography reveals connections between the phagophore and endoplasmic reticulum. Autophagy. 5, 1180-1185 (2009).
- Hayashi-Nishino, M., et al. A subdomain of the endoplasmic reticulum forms a cradle for autophagosome formation. Nat. Cell Biol. 11, 1433-1437 (2009).
- Lippincott-Schwartz, J. Emerging in vivo analyses of cell function using fluorescence imaging (*). Annu. Rev. Biochem. 80, 327-332 (2011).
- Mizushima, N., et al. Dissection of autophagosome formation using Apg5-deficient mouse embryonic stem cells. The Journal of Cell Biology. 152, 657-668 (2001).
- Itakura, E., Mizushima, N. Characterization of autophagosome formation site by a hierarchical analysis of mammalian Atg proteins. Autophagy. 6, 764-776 (2010).
- Axe, E. L., et al. Autophagosome formation from membrane compartments enriched in phosphatidylinositol 3-phosphate and dynamically connected to the endoplasmic reticulum. J Cell Biol. 182, 685-701 (2008).
- Walker, S., Chandra, P., Manifava, M., Axe, E., Ktistakis, N. T. Making autophagosomes: localized synthesis of phosphatidylinositol 3-phosphate holds the clue. Autophagy. 4, 1093-1096 (2008).
