

Summary
Traditional techniques for fabricating polyacrylamide (PA) gels containing fluorescent probes involve sandwiching a gel between an adherent surface and a glass slide. Here, we show that coating this slide with poly-D-lysine (PDL) and fluorescent probes localizes the probes to within 1.6 µm from the gel surface.
Abstract
PA gels have long been used as a platform to study cell traction forces due to ease of fabrication and the ability to tune their elastic properties. When the substrate is coated with an extracellular matrix protein, cells adhere to the gel and apply forces, causing the gel to deform. The deformation depends on the cell traction and the elastic properties of the gel. If the deformation field of the surface is known, surface traction can be calculated using elasticity theory. Gel deformation is commonly measured by embedding fluorescent marker beads uniformly into the gel. The probes displace as the gel deforms. The probes near the surface of the gel are tracked. The displacements reported by these probes are considered as surface displacements. Their depths from the surface are ignored. This assumption introduces error in traction force evaluations. For precise measurement of cell forces, it is critical for the location of the beads to be known. We have developed a technique that utilizes simple chemistry to confine fluorescent marker beads, 0.1 and 1 µm in diameter, in PA gels, within 1.6 μm of the surface. We coat a coverslip with poly-D-lysine (PDL) and fluorescent beads. PA gel solution is then sandwiched between the coverslip and an adherent surface. The fluorescent beads transfer to the gel solution during curing. After polymerization, the PA gel contains fluorescent beads on a plane close to the gel surface.
Introduction
The mechanical interaction of a living cell with its local environment has commonly been studied using PA gels. These substrates rely on a simple, well-characterized protocol established by Dembo and Wang in 19971. One of the main advantages of these substrates is that their stiffness may be tuned by modifying the concentrations of specific components of the gel solution. This provides a desirable platform to study cells’ interaction with environments of different rigidities. When PA gels are coated with extracellular matrix (ECM) proteins, cells adhere to them, generating force. As a result of cell force, the gel deforms as an elastic body. This deformation depends on the magnitude of the force applied by the cells and the elastic properties of the gel. Various studies have employed PA gels to investigate cellular traction forces.
In one variation of PA gel fabrication, fluorescent microspheres (beads) are embedded throughout the gel to quantify cell traction forces on gels of different rigidities2. Upon cell force application, the beads displace from their initial location following gel deformation. The deformation field is measured from the individual bead displacements. This deformation field is utilized with elasticity theory and the elastic properties of the gel to compute the traction forces. These measurements provide insight as to how cells mechanically sense and interact with their local microenvironment3.
In many widely used PA gel fabrication protocols, the beads are intermixed throughout the PA gel in its liquid, unpolymerized state. A fully polymerized PA gel contains fluorescent beads throughout its volume. When computing cell traction forces, beads most near the gel surface (cell-substrate interface) are monitored. The displacements of these beads are assumed to occur on the cell culture surface for simplicity in the force calculation. The actual location of the beads within the depth of the gel is disregarded. However, in an elastic medium (such as PA gel), a bead closer to a point of force application will move more than a bead that is further away from the point. Thus, treating the displacement of a point (at the bead location) distal from the surface as that at the surface results in an underestimation of cellular tractions. The degree of error depends on the distance of the bead from the surface. The error cannot be estimated without the knowledge of the location of the bead.
The need for a simple method to confine beads very near the cell culture surface has been addressed by a few techniques. One way is to increase the density of beads throughout the whole gel such that there are a sufficient number of beads in the top focal plane to measure motion very near the surface. Another technique involves building a confocal imaging chamber for live cell imaging such that the light from only the beads in the upper-most focal plane is collected4. A different method involves overlaying an extremely thin layer of PA gel containing beads on top of an already polymerized gel without beads5. A drawback of each of these techniques is that the precise location of the beads within the gel is not known. This introduces error into the calculation of the displacement field of the beads, and thus the calculation of cell forces. Another technique involves conjugation of beads to the top surface of an already polymerized PA gel using Sulfo-SANPAH6. This technique ensures the beads are indeed only on the top of the PA gel, but the extent to which they are embedded in the depth of the gel is unknown. This could potentially create a local topography for the cells, which could alter cell behavior, as prior work has suggested that cells can sense force several microns away7. Recently, a technique for patterning PA gels with 1 μm diameter fluorescent fibronectin dot markers in a regularized array was established8. In this case, the depth of the fluorescent markers is known, and is essentially zero, as the fibronectin pattern is indirectly printed on the gel surface. However, this method does not provide a continuous environment on which cells can attach, as the ECM protein is limited to 1 μm diameter dots. A method for fully integrating tracker beads within PA gels and confining them to a known location very near the surface has yet to be established.
Here, we develop a technique to constrain sub-μm to μm diameter fluorescent beads to a focal plane very near the cell culture surface within PA gel. A gel is typically cured by sandwiching unpolymerized liquid gel solution between two glass plates. One of the plates is functionalized so that the gel strongly adheres to it. The other is unfunctionalized and is removed after the gel cures. We modify this removable glass surface by coating it with a layer of beads. Upon sandwiching the liquid gel between the functionalized and the bead coated glass surface, the beads transfer to the gel while it is curing. This limits the distance of the beads’ integration into the gel within 1.6 µm of the surface. Glass-bottom Petri dishes are used as the adherent surface on which the gel is cured. To form a flat top gel surface during polymerization, a circular glass cover slip is used to sandwich the gel with the glass-bottom Petri dish. Prior to gel fabrication, the top glass cover slip is coated with poly-D-lysine (PDL), yielding a positive surface charge. The PDL is blown off with compressed air, and a solution of beads in water is deposited on the cover slips. We utilize carboxylated fluorescent microbeads, which carry a negative charge, and interact with the positively charged surface created by treatment with PDL. After blowing the bead solution off the coverslip with compressed air, a single layer of beads remains electrostatically coupled to the dry cover slip. The PDL coating does not affect the adhesiveness of the glass to the gel surface, as the glass slides are undamaged and removed from the PA gel fully intact.
The glass-bottom Petri dishes are made adherent by treatment with 97% 3-aminopropyl-trimethoxysliane and 0.5% glutaraldehyde. PA gels of desired rigidities are created by mixing appropriate concentrations of bisacrylamide and acrylamide via a standard procedure9. A droplet of the gel solution is pipetted onto the glass-bottom Petri dish. The glass cover slip containing the beads is used to sandwich the gel with the Petri dish. When the gel is cured, the top cover slip is removed leaving the beads embedded in the PA gel within 1.6 µm from the surface.
Subscription Required. Please recommend JoVE to your librarian.
Protocol
Fabricating and functionalizing PA gels of varying stiffnesses with fluorescent microspheres embedded near the cell culture surface.
1. Functionalizing the Top Glass Cover Slips
- Clean glass cover slips (#1.0, 12 mm diam.) with soap and water, followed by ethanol to remove extraneous dust.
- Place glass cover slips on a grated surface (i.e. pipette tip holder) such that they are not touching to facilitate ease of interaction with the coverslips.
- Coat the entire surface of the cover slips with Poly-D-Lysine (0.1 mg/ml) for 1 hr (Figure 1A).
- During this time, perform a 1:10,000 dilution of the colloid solution of 0.1 μm diameter, red fluorescent microspheres with deionized (DI) water to obtain a particle density of approximately 1 microsphere per 20 μm2 on the gel surface. See Figure 2 for the results of various dilutions. This dilution can be modified to meet the need of specific experiments.
- Place the diluted solution in an ultrasonic water bath for 30 min.
- After 1 hr, use tweezers to carefully lift each cover slip and blow dry with air. Return the dry cover slips to the grated surface.
- Remove the diluted colloid solution from the ultrasonic bath and pipette 150 μl onto each cover slip. Leave for 10 min (Figure 1B).
- Use tweezers to carefully lift each cover slip and blow dry with air. Return the dry cover slips to the grated surface and store in the dark until ready to use.
2. Preparing PA Gel Directly on Glass Bottom Petri Dishes
- Preheat hotplate to 100 °C.
- Lay out the desired number of glass bottom Petri dishes (35 mm dish with 14 mm micro-well, #1.0) on a flat surface in a chemical fume hood.
- Cover the glass portion of each Petri dish micro-well with 97% 3-aminopropyl-trimethoxysliane (3-APTES) for 7 min for chemical activation. Take caution to avoid inadvertent dripping of the 3-APTES to the surface of the plastic in the Petri dish to avoid degradation of the polystyrene.
- After 7 min, fill the Petri dish with DI water and dispose into waste container.
- Repeat step 2.4 3x for each dish, and then shake the Petri dish to remove extra water. Place the Petri dishes on the hot plate until the glass portion is dry.
- Remove the Petri dishes from the hot plate and return to a flat surface in a chemical fume hood.
- In a chemical fume hood, make a solution of 0.5% glutaraldehyde and cover the glass portion of each Petri dish well with the solution for 30 min. Take caution to avoid inadvertent dripping of the glutaraldehyde to the surface of the plastic in the Petri dish to avoid degradation of the plastic.
- After 30 min, fill the Petri dish with DI water and dispose into waste container to rinse and remove the glutaraldehyde.
- Repeat step 2.4 3x for each dish, and then shake the Petri dish to remove extra water. Place the Petri dishes on the hot plate until the glass portion is dry.
- Before mixing the components of the PA gel solution, move the functionalized glass slides into the chemical fume hood such that they are easily accessible, allowing for the quick sandwiching of the gel with the glass bottom Petri dishes after mixing the gel solution.
- In a 15 ml centrifuge tube, mix 40% bisacrylamide, 2% acrylamide, and acrylic acid in immediate succession in the concentrations listed in Table 1 (adapted from published protocol10) to achieve the desired matrix elasticity.
- Add 100 mM HEPES, 10% ammonium persulfate, and TEMED in quantities listed in Table 1 corresponding to desired matrix elasticity to complete the gel solution.
- Immediately pipette 15 μl of gel solution onto the center of the glass portion of the petri dishes.
- Immediately pick up a functionalized glass cover slip with tweezers.
- Flip the glass cover slip over such that the fluorescent beads are on the side making contact with gel solution.
- Lay the cover slip gently on top of the now-liquid PA gel such that the functionalized side is in contact with the gel (Figure 1C). Note: For best results, a second person is recommended for the role of adding the cover slip in order to avoid possibility of partial polymerization while pipetting liquid PA gel solution onto multiple Petri dishes.
- Flip all Petri dishes over to assist with avoiding gravity effects on fluorescent nanoparticles polymerizing into lower levels of the PA gel.
- Wait for at least 35 min, or until the stock solution of PA gel has visibly polymerized in its centrifuge tube.
- Flip the Petri dishes back over and fill them with PBS to assist with removing the cover slip.
- Carefully make contact with the glass portion of the Petri dish and the outline of the cover slip, using tweezers to scrape the circumference of the cover slip. Perform several cycles until the cover slip is dislodged. Remove the cover slip and dispose in a proper sharps waste container.
- After removing all cover slips, fluorescent beads will have transferred to the gel (Figure 1D). Cover the PA gels completely with PBS, place the Petri dish lid on each dish, and store at 4 °C.
3. Functionalizing PA gel with Fibronectin
- Prepare the following premixed solutions as described in an established protocol11: Soak solution (137 mM NaCl, 5% (v/v) glycerol) and 2x conjugation buffer (0.2 M 2-(N-morpholino)ethanesulfonic acid (MES), 10% (v/v) glycerol, pH 4.5).
- Use a vacuum pump in a biological hood to remove all PBS from the glass-bottom dishes containing the PA gels.
- Pipette soak solution onto each gel such that the gel is completely submerged. Incubate at room temperature for at least 1 hr.
- Warm 1-ethyl-3-[3-dimethylaminopropyl]carbodiimide hydrochloride (EDC) and N-hydroxysulfosuccinimide (NHS) to room temperature.
- Mix 10x solutions of EDC (150 mM, 19 mg/ml in DI water) and NHS (250 mM, 29 mg/ml in DI water).
- Mix 1 part 10x EDC, 1 part 10x NHS, 3 parts DI water, and 5 parts 2x conjugation buffer.
- Use a vacuum pump in a biological hood to remove the soak solution. Make sure all fluid is removed from the gel surface.
- Add enough NHS/EDC solution to cover the gel surface and fill the glass-bottom well of the Petri dish (150–250 μl). Incubate at room temperature for 30 min in the dark.
- Thaw fibronectin at room temperature. Once thawed, mix sterile DI water to create a 50 μg/ml fibronectin solution.
- Use a vacuum pump in a biological hood to remove the NHS/EDC solution. Make sure all fluid is removed from the gel surface.
- Add 150 μl of fibronectin solution to each gel. Incubate at room temperature for 35 min to allow for attachment of fibronectin.
- After 35 min, add PBS to each Petri dish and store at 4 °C for up to 2 weeks.
4. Traction Force Experiments
- Warm cell media, PBS, and trypsin to 37 °C in a water bath.
- Rinse gels 5x with sterile PBS, aspirating the PBS in between rinses, and leave covered in the hood.
- Add 1 ml trypsin per 25 cm2 to flask containing cells. After cells are lifted from flask, dilute the trypsin with cell media and count the cells. Based on gel surface area, determine the number of cells required per gel for a final cell seeding density of 3,000 cells/cm2. Dilute or concentrate suspension such that 150 μl of the cell-media mixture contains this number of cells. Aliquot 150 μl of cell suspension on to each gel.
- Place the Petri dishes containing cells in an incubator for 30 min. Then, carefully remove the Petri dishes and fill the remainder of the Petri dish with media (approximately 2 ml) such that the surface of the dish is completely submerged.
- Place the Petri dishes back in the incubator until image acquisition.
- Prepare the microscope and data acquisition system for imaging: insert the 40x water immersion objective, insert the Differential Interference Contrast (DIC) prism, select the mCherry or equivalent fluorescent filter, and turn on the environmental chamber.
- When prepared for imaging, remove one Petri dish from the incubator and place it gently on the microscope stage. Remove the Petri dish lid for DIC imaging.
- Locate a single cell and capture a single still image of the cell in DIC.
- Without moving the microscope stage, switch the imaging mode to fluorescence. Focus on the fluorescent microspheres and record an image of the microspheres.
- Carefully remove cell media from the Petri dish with a pipette and add 0.05% trypsin-EDTA.
- Image the microspheres under the cell after the cells have detached.
- Use particle image velocimetry (PIV) analysis in ImageJ12 to compute the displacement field due to cellular forces.
Subscription Required. Please recommend JoVE to your librarian.
Representative Results
Confocal imaging was used to determine that the beads were indeed underneath the gel surface and to quantify their precise location within the gel depth. Fluorescent beads of a different wavelength than those inside the gel were allowed to settle on the surface, and the distance between the embedded fluorescent nanoparticles and those on the surface was calculated using a centroid identification algorithm. The location of the bead on the gel surface serves as a reference for the top surface of the gel—where cells apply force upon adherence to the surface. A schematic of the two scenarios considered (green beads in the gel with red beads on the surface, and vice versa) is shown in Figure 3. The algorithm interpolates the z-height of the three-dimensional centroid location. We repeated this process for three stiffness gels (1, 10, and 40 kPa) and two size (diameter) fluorescent beads (0.1 μm red and 1 μm yellow-green). The distance between a bead within the gel and its nearest neighbor of a different wavelength was determined based on its three-dimensional centroid. Figure 4 shows the spatial distribution of beads (on top surface and embedded) and the projected view on the YZ plane. The latter provides the depths of all the beads from the surface of the gel.
The average depth of 0.1 μm beads is 619 nm, 467 nm, 278 nm for PA gels of stiffness 1, 10, and 40 kPa, respectively (Figure 5A). The corresponding depths for 1 μm diameter beads are -20 nm in 40 kPa gels, 12 nm in 10 kPa gels, and 1,255 nm in 1 kPa gels (Figure 5B). Confocal imaging was also performed on gels with beads dispersed throughout the gel as has been traditionally used for PA gels intended for traction force microscopy studies. The depth of beads dispersed throughout the PA gel was measured using the same algorithm previously described and is compared to the depths using the technique we present here. Figure 6 illustrates the variability of bead dispersion within the depth of a PA gel using traditional fabrication methods.
Fibroblasts attach to the PA gel surface when functionalized with fibronectin. The displacement field for a fibroblast cell and the corresponding fluorescent beads layer are shown in Figure 7. Beads near the periphery of the image appear slightly out of focus. This is not a mechanical defect on the part of the gel, as the glass remains fully intact upon removal from the gel. Rather, it is the result of an optical effect due to the water immersion objective used in this experiment. Upon the addition of trypsin to the medium, the cell is released from the surface, resulting in the return of the deformed PA gel surface to its original state. A cross-correlation algorithm was utilized to calculate the deformation field based on bead displacements10. The displacement map illustrates a dominant polarization of the cell traction forces in the y-direction.

Figure 1. Illustration of functionalization process for top glass cover slips with PDL and fluorescent beads. (A) Glass cover slips (blue) are incubated with 0.1 mg/ml PDL (orange) for 1 hr. Compressed air is used to blow the cover slips dry and remove the PDL. (B) Glass cover slips are incubated with a solution of 100 nm diameter fluorescent beads for 5-10 min, and then removed by applying compressed air. One layer of beads remains electrostatically coupled to the coverslip. (C) Coverslips functionalized with beads are used to sandwich PA gel with an activated glass surface. (D) Upon removal of the top cover slip following PA gel polymerization, the beads are located within and very near the surface of the gel. Please click here to view a larger version of this figure.

Figure 2. PA Gel Surface Containing 0.1 μm diameter Fluorescent Beads. Prior to coating the PDL-treated top glass cover slip with beads, the bead solution was diluted (A) 10,000 fold (3.64 x 10⁸ beads/ml) and (B) 20,000 fold (1.82 x 10⁸ beads/ml). Please click here to view a larger version of this figure.
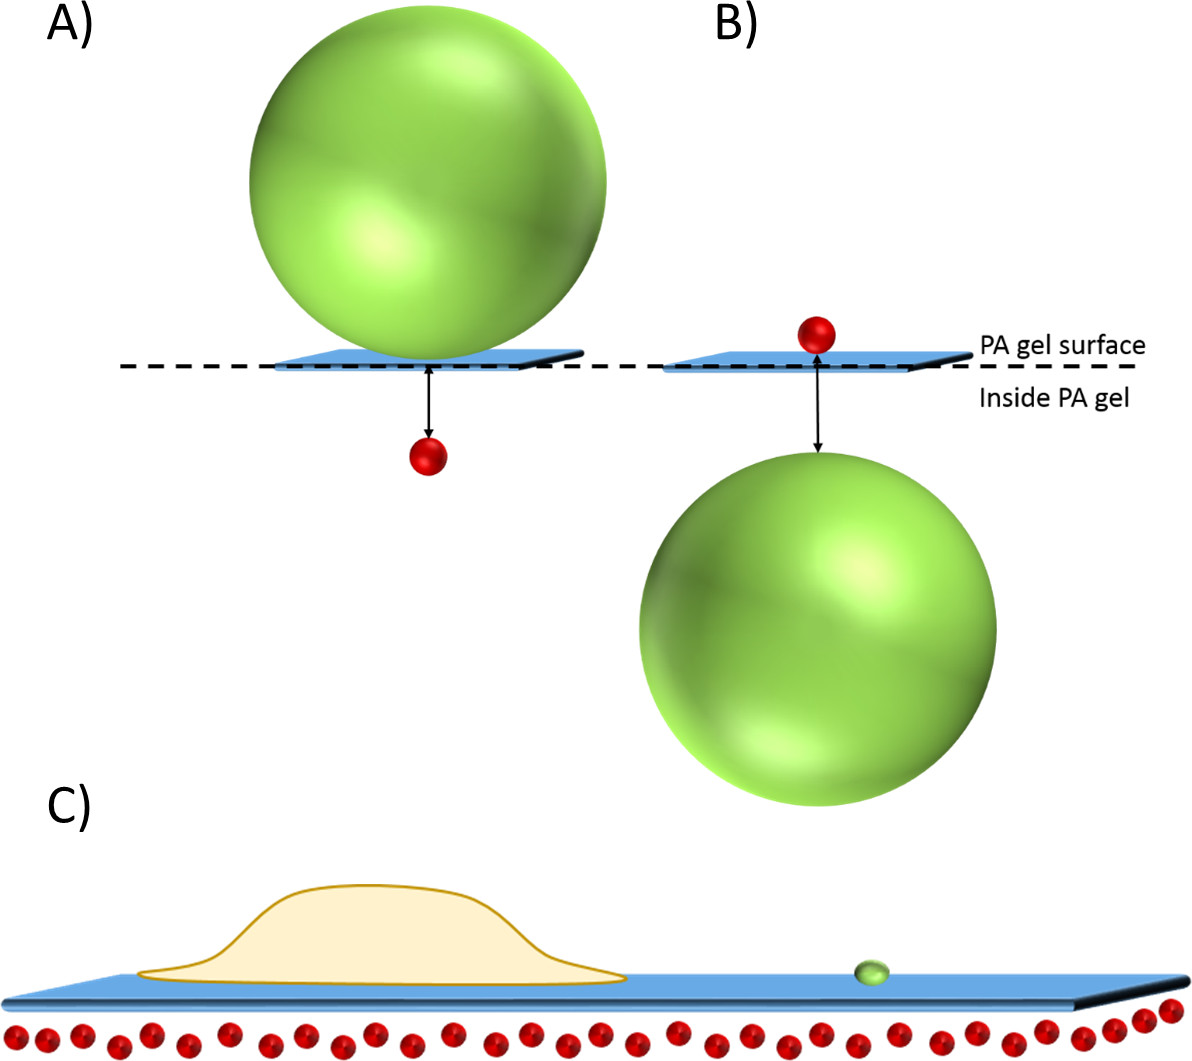
Figure 3. Cell-substrate interface with beads localized near the surface of the gel. A schematic of two scenarios in which bead location within a PA gel was quantified using confocal microscopy and a centroid identification algorithm. The first scenario is shown in (A) Red 100 nm diameter beads inside the gel and green 1 μm diameter beads on the surface, and the second in (B) Green 1 μm-diameter beads inside the gel and red 100 nm diameter beads on the surface. (C) A cartoon illustration of a cell (yellow) adhered to a gel (blue) with red beads localized inside the gel near its surface and a green bead sitting on its surface. Please click here to view a larger version of this figure.

Figure 4. Confocal slice (XY, center) and accompanying YZ (left) projection views of a gel with red 0.1 μm beads embedded in the gel and 1 μm beads on the surface. The units for all axes are in nanometers. Occasional occurrences of red beads above or in the same plane as green beads is attributed to slight overlap in the fluorescence emission spectra for red (mCherry) and green (GFP). Please click here to view a larger version of this figure.

Figure 5. Histograms of the depth of beads confined near the top surface of PA gel. Stiffnesses 1 kPa, 10 kPa, and 40 kPa are represented by blue, red, and black, respectively. A Gaussian curve was fit to each data set and the x-value corresponding to its amplitude is interpreted as the average depth of beads. Two scenarios were tested: (A) 0.1 μm beads inside the gel with 1 μm beads on the surface, and (B) 1 μm beads inside the gel with 0.1 μm beads on the surface. Please click here to view a larger version of this figure.

Figure 6. Histograms of the depth of beads embedded arbitrarily throughout PA gel using a traditional fabrication method (black) and beads localized near the top layer of PA gel using this technique (red) for PA gels of stiffness A) 1 kPa, B) 10 kPa, and C) 40 kPa. Inset shows the depth of the beads in both gel types within the upper most 10 μm of the gel. Please click here to view a larger version of this figure.

Figure 7. Displacement field due to cell traction. (A) Phase contrast image of a fibroblast on 10 kPa gel. (B) Displacement field generated by traction generated by the fibroblast. Color bar indicates bead displacement in nanometers. (C) Fluorescence image of 0.1 μm diameter beads underneath a cell prior to trypsinization. Please click here to view a larger version of this figure.

Figure 8. Illustration of average location of beads inside the gel relative to a different size/wavelength bead sitting on the gel surface. The stiffness of PA gel decreases from left to right (40 kPa, 10 kPa, 1 kPa). (A) Red 0.1 μm diameter beads inside the gel and green 1 μm diameter beads on the surface. (B) Green 1 μm diameter beads inside the gel and red 0.1 μm diameter beads on the surface. Please click here to view a larger version of this figure.

Figure 9. Distribution of theoretical values for τ/μ based on various bead depths. Beads 0.1 μm in diameter were either uniformly dispersed or localized near the surface in (A) 1 kPa gels, (B) 10 kPa gels, and (C) 40 kPa gels. The gold arrow indicates the value of τ/μ for the z = 0 case, in which beads are on the gel surface. Please click here to view a larger version of this figure.
| E (kPa) | 40% Acrylamide (µl) | BIS (concentration) | 2% BIS (µl) | 100 mM HEPES (µl) |
| 0.1 | 625 | 0.00009 | 22.5 | 4225 |
| 0.25 | 625 | 0.0001 | 25 | 4222.5 |
| 0.5 | 625 | 0.00011 | 27.5 | 4220 |
| 0.75 | 625 | 0.0002 | 50 | 4197.5 |
| 1 | 625 | 0.0003 | 75 | 4172.5 |
| 1.5 | 625 | 0.0004 | 100 | 4147.5 |
| 2 | 625 | 0.0005 | 125 | 4122.5 |
| 2.5 | 625 | 0.0006 | 150 | 4097.5 |
| 3 | 625 | 0.0008 | 200 | 4047.5 |
| 3.5 | 625 | 0.0009 | 225 | 4022.5 |
| 4 | 625 | 0.001 | 250 | 3997.5 |
| 4.5 | 625 | 0.0012 | 300 | 3947.5 |
| 5 | 625 | 0.0014 | 350 | 3897.5 |
| 5.5 | 625 | 0.0016 | 400 | 3847.5 |
| 6 | 625 | 0.0018 | 450 | 3797.5 |
| 6.5 | 625 | 0.002 | 500 | 3747.5 |
| 7 | 625 | 0.0022 | 550 | 3697.5 |
| 7.5 | 625 | 0.0024 | 600 | 3647.5 |
| 8 | 1000 | 0.001 | 250 | 3622.5 |
| 10 | 1000 | 0.0013 | 325 | 3547.5 |
| 15 | 1000 | 0.002 | 500 | 3372.5 |
| 20 | 1000 | 0.0027 | 675 | 3197.5 |
| 30 | 1000 | 0.0037 | 925 | 2947.5 |
| 40 | 1000 | 0.0048 | 1200 | 2672.5 |
Table 1. PA Gel Chemical Concentrations based on Young’s Modulus. For a desired PA gel elastic modulus, the listed concentrations of acrylamide, bisacrylamide, and HEPES buffer should be supplemented with 5 μl acrylic acid, 25 μl 10% ammonium persulfate (APS), and 2.5 μl TEMED.
| z (μm) | ux (( τ/μ) μm) |
| 0 | 0.750 |
| 0.5 | 0.394 |
| 1 | 0.237 |
| 1.5 | 0.164 |
| 2 | 0.124 |
| 2.5 | 0.100 |
| 3 | 0.083 |
| 3.5 | 0.071 |
| 4 | 0.062 |
| 4.5 | 0.056 |
| 5 | 0.050 |
Table 2. Displacements as a function of τ/μ corresponding to depth, z, of beads from the gel surface based on Boussinesq theory.
Subscription Required. Please recommend JoVE to your librarian.
Discussion
When using this technique, it is essential that the bead solution is properly diluted and the beads are chosen based on desired diameter, PA gel substrate stiffness, and the size scale of the phenomena that is explored in the desired experiment.
Caution should be taken when diluting the bead solution prior to functionalizing top glass cover slips. The spacing between beads on the gel surface can be altered by changing the dilution factor of the colloid solution. Diluting the solution too much will reduce the number of beads that couple to the cover slip and ultimately reduce the number of beads in the gel. Diluting the solution too little can yield too high a density of beads in the gel such that they are in contact and cannot be distinguished from one another. While it is often impossible to completely avoid the presence of nanoparticle aggregation, the application of ultrasonic waves to the diluted solution effectively minimizes nanoparticle aggregation. We have found that a 10,000 fold dilution of the colloid solution utilized in this protocol gives a bead concentration of 3.64 x 10⁸ beads/ml, and yields a desirable particle density of 0.05 beads/μm2 for 0.1 μm diameter beads. A 1:20,000 dilution (1.82 x 10⁸ beads/ml) yields an average of 52 μm2 per particle. Figure 2 shows images of the surface of gels with different dilutions. It should be noted that there is variability in the number of beads that transfer to the gel. This is due to the variability associated with removing the bead solution from the cover slip with compressed air during functionalization. In general, we have found that increasing the dilution factor by at least a factor of two consistently results in at least a twofold increase in the area per bead.
It is also critical to choose a bead size (diameter) that will result in full immersion of the bead inside the gel upon PA polymerization. Gel stiffness affects the location of beads as shown in Figure 5A. For 0.1 μm diameter beads, the bead depth increases with decreasing stiffness. This could be a result of the inverse relationship between pore size and PA gel stiffness13. For all of the three stiffness gels tested, the beads are consistently localized inside the gel, and within 1 μm of the gel surface as illustrated in Figure 8A. The average location of 1 μm beads within the gel also varies with stiffness. They are embedded deeper (approximately 1.25 μm) into the 1 kPa gels. For the 10 and 40 kPa gels, the location of the top of 1 μm diameter beads ranges from approximately 0.5 μm above to 0.5 μm below the gel (Figure 5) surface, which means the beads occasionally protrude through the top of the gel (Figure 8B). This is detrimental because it introduces topography for the cells, and topography is known to affect cell-substrate interactions14. Thus, it is necessary to be mindful of choosing beads for this technique when preparing gels of a specific rigidity. Of the two bead sizes utilized to characterize this method, 0.1 µm diameter proves the optimum size. Other bead sizes may be utilized in with this technique, but should be calibrated using confocal microscopy as we describe here, to understand the precise depth to which the beads are localized during gel polymerization.
This technique improves spatial resolution of beads in PA gel by increasing the number of distinguishable particles within the field of view. Localizing the beads to a layer near the top of the gel does not significantly affect the composite stiffness of the gel. Isostress composite theory is utilized to compute the composite elastic modulus, Ec, of only the 1 μm-thick layer of gel containing beads as

where Ef is the elastic modulus of the polystyrene beads (3 GPa), Em is the elastic modulus of the gel matrix (10 kPa), and vf and vm are the volume fractions of the beads and gel matrix, respectively. Because the beads comprise only 0.03% of the volume, Ec = 10.0025 kPa is not significantly different than the elastic modulus of an isotropic gel of stiffness 10 kPa. An established method for fabricating PA gels reduces the polymerization time to 30 sec, thus minimizing the effect of gravity on the distribution of beads during polymerization15. Our method relies on the longer (~30 min) polymerization time for the beads to polymerize into the gel such that they do not protrude the gel surface. Because localizing the beads to a single layer does not significantly affect the composite gel stiffness, and the longer polymerization time aids in the transfer of beads into the gel matrix, we do not incorporate any measure to reduce polymerization time in our technique.
Our technique demonstrates how to localize the beads to a known depth inside PA gel, which improves the measurement of substrate deformation, and thus the calculation of cell traction forces. A theoretical approach to quantify the cellular traction forces has been previously reported16,17. This approach treats the gel substrate as a semi-infinite solid in elastic half space. The Boussinesq solution is used to solve the inverse problem of calculating traction forces from a displacement field. We employ a simplified version of the Boussinesq integral to quantify the error in displacement measurement due to beads distal from the gel surface18. The equation for the displacement in a given direction based on an applied shear stress, τ, over a given radius, R, is given by

where ux is the displacement in the x direction, μ is the shear modulus, and z is the depth of the beads from the gel surface. For various locations of beads throughout the depth of the gel, corresponding displacements are shown in Table 2.
For the case shown here, the radius is estimated to be an average focal adhesion size of 1 μm. If the beads are assumed to be coplanar with the cells (z = 0), the displacement is given by 0.75 τ/μ. If the beads are only 1 μm below the gel surface, the displacement is given by 0.24 τ/μ. This represents greater than a threefold reduction in displacement from a bead coplanar with the surface to a location 1 μm below. This introduces error in the calculation of surface traction forces based on the motion of embedded beads whose precise locations within the gel are unknown. The variation in traction defined by τ/μ, as a function of the depth of the beads in the gel for both the proposed and traditional fabrication methods is significant. Figure 9 shows the distribution of forces (given by the ratio τ/μ) based on Boussinesq theory that result from computation utilizing the distribution of bead depths, z, within the optical depth of field when beads are uniformly distributed in the gel and localized near the surface. The most accurate measurement of cell force would result if beads were on the same plane as the cells, where z = 0 and τ/μ = 0.0133. When compared to this case, τ/μ increases by 118%, 80%, and 50% for 1 kPa, 10 kPa, and 40 kPa gels, respectively, when beads are localized near the surface using the technique we propose. When beads are uniformly distributed throughout the gel depth, τ/μ increases an additional 60%, 80%, and 150% beyond the increase induced by localizing beads near the surface, for 1 kPa, 10 kPa, and 40 kPa gels, respectively. This represents a total of nearly 200% error in traction calculations when the beads are distributed throughout the gel depth. Thus, localizing the beads to a known depth inside the gel improves accuracy in displacement measurements and cell traction forces.
The technique described here presents a new way to prepare PA gel substrates for traction force microscopy applications such that the beads are localized near the gel surface. Confining the beads to a known depth within PA gel provides new information about the actual displacement of beads upon cell force application, creating a more accurate picture of how the cells are deforming their underlying substrate.
Subscription Required. Please recommend JoVE to your librarian.
Disclosures
The authors declare that they have no competing financial interests.
Acknowledgments
The authors would like to acknowledge the Interdisciplinary Innovation Initiative Program, University of Illinois, grant 12035. S.K. was funded at UIUC from National Science Foundation (NSF) Grant 0965918 IGERT: Training the Next Generation of Researchers in Cellular and Molecular Mechanics and BioNanotechnology. This work was supported in part by the grant from the nanoBIO node of the National Science Foundation ( ECC-1227034).
Materials
| Name | Company | Catalog Number | Comments |
| Reagents | |||
| 97% 3-Aminopropyl-trimethoxysliane (APTES) | Sigma-Aldrich | 281778 | |
| 70% Glutaraldehyde | Polysciences, Inc. | 111-30-8 | |
| 1 M HEPES buffer solution | Sigma-Aldrich | 83264 | |
| 40% Acrylamide | Sigma-Aldrich | A4058 | |
| 2% Bisacrylamide | Sigma-Aldrich | M1533 | |
| 0.1 µm Fluorescent microspheres (mCherry) | Invitrogen | F8801 | |
| Fibronectin, Human, 1 mg | BD Biosciences | 354008 | |
| Ammonium persulfate | Bio-RAD | 161-0700 | |
| Tetramethylethylenediamine (TEMED) | Bio-RAD | 161-0801 | |
| Poly-D-lysine | Millipore | A-003-E | |
| 1-Ethyl-3-[3-dimethylaminopropyl]carbodiimide hydrochloride (EDC) | Thermo Scientific | 22980 | |
| N-hydroxysulfosuccinimide (NHS) | Thermo Scientific | 24500 | |
| 0.05% Trypsin-EDTA (1X) | Life Technologies | 25300-054 | |
| NaCl | Sigma-Aldrich | S9888 | |
| Acrylic acid | Sigma-Aldrich | 147230 | |
| Glycerol | Sigma-Aldrich | G7757 | |
| 2-(N-morpholino)ethanesulfonic acid (MES) | Sigma-Aldrich | M3671 | |
| Materials | |||
| 35 mm Glass bottom dish with 14 mm micro-well #1 cover glass | In Vitro Scientific | D35-14-1-N | |
| Glass cover slips, 12 mm diam. | Ted Pella, Inc. | 26023 | |
References
- Pelham, R. J., Wang, Y. L. Cell locomotion and focal adhesions are regulated by substrate flexibility. PNAS. 94 (25), 13661-13665 (1997).
- Dembo, M., Wang, Y. L. Stresses at the cell-to-substrate interface during locomotion of fibroblasts. Biophys. J. 76 (4), 2307-2316 (1999).
- Lo, C. M., Wang, H. B., Dembo, M., Wang, Y. L. Cell movement is guided by the rigidity of the substrate. Biophys. J. 79 (1), 144-152 (2000).
- Aratyn-Schaus, Y., Oakes, P. W., Stricker, J., Winter, S. P., Gardel, M. L. Preparation of Complaint Matrices for Quantifying Cellular Contraction. JoVE. , http://www.jove.com/index/Details.stp?ID=2173 (2010).
- Kandow, C. E., Georges, P. C., Janmey, P. A., Beningo, K. A. Polyacrylamide Hydrogels for Cell Mechanics: Steps Toward Optimization and Alternative Uses. Methods in Cell Biol. 83, 29-46 (2007).
- Marinkovic, A., Mih, J. D., Park, J. -A., Liu, F., Tschumperlin, D. J. Improved throughput traction microscopy reveals pivotal role for matrix stiffness in fibroblast contractility and TGF-β responsiveness. Am. J. Physiol. Lung Cell Mol. Physiol. 303 (3), 169-180 (2012).
- Buxboim, A., Rajagopal, K., Brown, A. E. X., Discher, D. E. How deeply cells feel: methods for thin gels. J. Phys.: Condens. Matter. 22 (2010), 194116-194126 (2010).
- Polio, S. R., Rothenberg, K. E., Stamenovic,, Smith, M. L. A micropatterning and image processing approach to simplify measurement of cellular traction forces. Acta Biomaterialia. 8, 82-88 (2012).
- Wang, Y. L., Pelham, R. J. Preparation of a flexible, porous polyacrylamide substrate for mechanical studies of cultured cells. Methods in Enzymol. 298, 489-496 (1998).
- Tse, J. R., Engler, A. J. Preparation of Hydrogel Substrates with Tunable Mechanical Properties. Current Protocols in Cell Biol. , Chapter 10, Unit 1 16 (2010).
- Poellmann, M. J., Wagoner Johnson, A. J. Characterizing and Patterning Polyacrylamide Substrates Functionalized with N-Hydroxysuccinimide. Cell and Mol. Bioengineering. 6 (3), 299-309 (2013).
- Tseng, Q., Duchemin-Pelletier, E., Deshiere, A., Balland, M., Guillou, H., Filhol, O., Théry, M. Spatial organization of the extracellular matrix regulates cell–cell junction positioning. PNAS. 109 (5), 1506-1511 (2012).
- Trappmann, B., Gautrot, J. E., Connelly, J. T., Strange, D. G. T., Li, Y., Oyen, M. L., Cohen Stuart, M. A., Boehm, H., Li, B., Vogel, V., Spatz, J. P., Watt, F. M., Huck, W. T. S. Extracellular-matrix tethering regulates stem-cell fate. Nature Materials. 11, 642-649 (2012).
- Wong, J. Y., Leach, J. B., Brown, X. Q. Balance of chemistry, topography, and mechanics at the cell-biomaterial interface: Issues and challenges for assessing the role of substrate mechanics on cell response. Surface Science. 570 (1-2), 119-133 (2004).
- Mih, J. D., Sharif, A. S., Marinković, A., Symer, M. M., Tschumperlin, D. J. A Multiwell Platform for Studying Stiffness-Dependent Cell Biology. PLoS ONE. 6 (5), e19929 (2011).
- Butler, J. P., Tolić-Nørrelykke, I. M., Fabry, B., Fredberg, J. J. Traction fields, moments, and strain energy that cells exert on their surroundings. Am J Physiol Cell Physiol. 282, 595-605 (2001).
- Tolić-Nørrelykke, I. M., Butler, J. P., Chen, J., Wang, N. Spatial and temporal traction response in human airway smooth muscle cells. Am J Physiol Cell Physiol. 283, 1254-1266 (2002).
- Atanackovic, T., Guran, A. Theory of Elasticity for Scientists and Engineers. , Maple-Vail Book Manufacturing Group. York, PA. (2000).
