

Summary
RNA-sequencing and bioinformatics analyses were used to identify significantly and differentially expressed transcription factors in Lin-CD34+ and Lin-CD34- subpopulations of mouse EMLcells. These transcription factors might play important roles in determining the switch between self-renewing Lin-CD34+ and partially differentiated Lin-CD34- cells.
Abstract
Hematopoietic stem cells (HSCs) are used clinically for transplantation treatment to rebuild a patient's hematopoietic system in many diseases such as leukemia and lymphoma. Elucidating the mechanisms controlling HSCs self-renewal and differentiation is important for application of HSCs for research and clinical uses. However, it is not possible to obtain large quantity of HSCs due to their inability to proliferate in vitro. To overcome this hurdle, we used a mouse bone marrow derived cell line, the EML (Erythroid, Myeloid, and Lymphocytic) cell line, as a model system for this study.
RNA-sequencing (RNA-Seq) has been increasingly used to replace microarray for gene expression studies. We report here a detailed method of using RNA-Seq technology to investigate the potential key factors in regulation of EML cell self-renewal and differentiation. The protocol provided in this paper is divided into three parts. The first part explains how to culture EML cells and separate Lin-CD34+ and Lin-CD34- cells. The second part of the protocol offers detailed procedures for total RNA preparation and the subsequent library construction for high-throughput sequencing. The last part describes the method for RNA-Seq data analysis and explains how to use the data to identify differentially expressed transcription factors between Lin-CD34+ and Lin-CD34- cells. The most significantly differentially expressed transcription factors were identified to be the potential key regulators controlling EML cell self-renewal and differentiation. In the discussion section of this paper, we highlight the key steps for successful performance of this experiment.
In summary, this paper offers a method of using RNA-Seq technology to identify potential regulators of self-renewal and differentiation in EML cells. The key factors identified are subjected to downstream functional analysis in vitro and in vivo.
Introduction
Hematopoietic stem cells are rare blood cells that reside mainly in the adult bone marrow niche. They are responsible for the production of cells required to replenish the blood and the immune systems1. As a kind of stem cells, HSCs are capable of both self-renewal and differentiation. Elucidating mechanisms that control the fate decision of HSCs, toward either self-renewal or differentiation, will offer valuable guidance on the manipulation of HSCs for blood disease researches and clinical usage2. One problem faced by the researchers is that HSCs can be maintained and expanded in vitro to a very limited extent; the vast majority of their progeny are partially differentiated in culture2.
In order to identify key regulators that control the processes of self-renewal and differentiation at a genome-wide scale, we used a mouse primitive hematopoietic progenitor cell line EML as a model system. This cell line was derived from murine bone marrow3,4. When fed with different growth factors, EML cells can differentiate into erythroid, myeloid, and lymphoid cells in vitro5. Importantly, this cell line can be propagated in large quantity in culture medium containing stem cell factor (SCF) and still retaining their multipotentiality. EML cells can be separated into subpopulations of self-renewing Lin-SCA+CD34+ and partially differentiated Lin-SCA-CD34- cells based on surface markers CD34 and SCA6. Similar to short-term HSCs, SCA+CD34+ cells are able of self-renewal. When treated with SCF, Lin-SCA+CD34+ cells can rapidly regenerate a mixed population of Lin-SCA+CD34+ and Lin-SCA-CD34- cells and continue to proliferate6. The two populations are similar in morphology and have similar levels of c-kit mRNA and protein6. Lin-SCA-CD34- cells are capable of propagating in media containing IL-3 instead of SCF3. Unveiling the key regulators in the EML cell fate decision will offer better understanding of cellular and molecular mechanisms in early developmental transition during hematopoiesis.
In order to investigate the underlying molecular differences between the self-renewing Lin-SCA+CD34+ and partially differentiated Lin-SCA-CD34- cells, we used RNA-Seq to identify differentially expressed genes. In particular, we focus on transcription factors, as transcription factors are crucial in determining cell fate. RNA-Seq is a recently developed approach that utilizes the capabilities of next-generation sequencing (NGS) technologies to profile and quantify RNAs transcribed from genome7,8. In brief, total RNA is poly-A selected and fragmented as the initial template.The RNA template is then converted into cDNA using reverse transcriptase. In order to map full-length RNA transcripts, using intact, non-degraded RNA for constructing cDNA library is important. For the purpose of sequencing, specific adapter sequences are added to both ends of cDNA. Then, in most cases, cDNA molecules are amplified by PCR and sequenced in a high-throughput manner.
After sequencing, the resulting reads can be aligned to a reference genome and a transcriptome database. The number of reads that map to the reference gene is counted and this information can be used to estimate the gene expression level. The reads can also be assembled de novo without a reference genome, enabling the study of transcriptomes in non-model organisms9. RNA-seq technology has also been used to detect splice isoforms10-12, novel transcripts13 and gene fusions14. In addition to the detection of protein-coding genes, RNA-Seq can also be used to detect novel and analyze transcription level of non-coding RNAs, such as long non-coding RNA15,16, microRNA17, siRNA etc.18. Because of the accuracy of this method, it has been utilized for detection of single nucleotide variations19,20.
Before the advent of RNA-Seq technology, microarray was the main method used for analyzing gene expression profile. Pre-designed probes are synthesized and subsequently attached to a solid surface to form a microarray slide21. mRNA is extracted and converted to cDNA. During the reverse transcription process, fluorescently labeled nucleotides are incorporated into the cDNA and the cDNA can be hybridized onto the microarray slides. The intensity of the signal collected from a specific spot depends on the amount of cDNA binding to the specific probe on that spot21. Compared with RNA-Seq technology, microarray has several limitations. First, microarray relies on the pre-existing knowledge of gene annotation, while RNA-Seq technology is able to detect novel transcripts at relative high background level, which limits its use when gene expression level is low. Besides, the RNA-Seq technology has much higher dynamic range of detection (8,000 fold)7, whereas, due to background and saturation of signals, the accuracy of microarray is limited for both highly and lowly expressed genes7,22. Finally, microarray probes differ in their hybridization efficiencies, which make the results less reliable when comparing relative expression levels of different transcripts within one sample23. Although RNA-Seq has many advantages over microarray, its data analysis is complex. This is one of the reasons that many researchers still use microarray instead of RNA-Seq. Various bioinformatics tools are required for RNA-Seq data processing and analysis24.
Among several next-generation sequencing (NGS) platforms, 454, Illumina, SOLID and Ion Torrent are the most widely used ones. 454 was the first commercial NGS platform. In contrast to the other sequencing platforms such as illumina and SOLID, the 454 platform generates longer read length (average 700 base reads)25. Longer reads are better for initial characterization of transcriptiome due to their higher assemble efficiency25. The main disadvantage of the 454 platform is its high cost per megabase of sequence. The Illumina and SOLID platforms generate reads with increased numbers and short lengths. The cost per megabase of sequence is much lower than the 454 platform. Due to the large numbers of short reads for the Illumina and SOLID platforms, data analysis is much more computationally intensive. The price of the instrument and reagents for sequencing for the Ion Torrent platform is cheaper and the sequencing time is shorter25. However, the error rate and the cost per megabase of sequence are higher compared to the Illumina and SOLID platforms. Different platforms have their own advantages and disadvantages and require different methods for data analysis. The platform should be chosen based on the sequencing purpose and the availability of funding.
In this paper, we take Illumina RNA-Seq platform as an example. We used EML cell as a model system to investigate the key regulators in EML cell self-renewal and differentiation, and provided a detailed methods of RNA-Seq library construction and data analysis for expression level calculation and novel transcript detection. We have shown in our previous publication that RNA-seq study in EML model system2, when coupled with functional test (e.g. shRNA knockdown) provide a powerful approach in understanding the molecular mechanism of the early stages of hematopoietic differentiation, and can serve as a model for the analysis of cell self-renewal and differentiation in general.
Subscription Required. Please recommend JoVE to your librarian.
Protocol
1. EML Cell Culture and Separation of Lin-CD34+ and Lin-CD34- Cells Using Magnetic Cell Sorting System and Fluorescence-activated Cell Sorting Method
- Preparation of baby hamster kidney (BHK) cell culture medium for stem cell factor collection:
- Culture BHK cells in DMEM medium containing 10% FBS in 25 cm2 flask (Table 1) at 37 °C, 5% CO2 in a cell culture incubator.
- When cells grow to 80 - 90% confluence, wash cells once with 10 ml of PBS. Add 5 ml of 0.25% trypsin-EDTA solution to the monolayer and incubate the cells for 1-5 min at room temperature (RT) until the cells are detached.
- Pipet the solution up and down gently to break up clumps of cells. Add 5 ml of complete DMEM to the flask to stop trypsin activity. Collect cells by centrifugation at 200 x g for 5 min at RT.
- Remove the medium and resuspend the cell pellet in 10 ml of fresh BHK cell culture medium.
- Transfer 2 ml of the cell suspension from the step 1.1.4 to a new 75 cm2 flask and add 48 ml of fresh BHK cell culture medium to the flask.
- Culture the BHK cells for two days and collect the culture medium. Passage the medium through a 0.45 μm filter. Store the medium in -20 °C until further use.
- EML cell culture:
- Culture EML cells (in suspension) in EML basic medium containing BHK cell culture medium (Table 1) at 37 °C, 5% CO2 in a cell culture incubator.
- Maintain the EML cells at low cell density (0.5-5 x 10⁵ cells/ml) with the peak density less than 6 x 10⁵ cells/ml. Split the cells every 2-3 days at the ratio of 1:5. Passage EML cells gently and discard the culture after passaging for 10 generations.
- Depletion of lineage positive cells:
- Harvest the EML cells by centrifugation at 200 x g for 5 min and wash the cells once with PBS. Collect the cells by centrifugation at 200 x g for 5 min.
- Resuspend the cells with PBS and count the cells with a hemocytometer. Determine the antibody concentration in the subsequent cell separation step according to the number of the cells (please refer to the instructions offered by the provider of the cell isolation system).
- Isolate the lineage negative (Lin-) cells using lineage antibody cocktail (cocktail of biotin-conjugated monoclonal antibodies CD5, CD45R (B220), CD11b, Anti-Gr-1(Ly-6G/C), 7-4 and Ter-119) and a magnetic activated cell sorting system according to manufacturer’s instructions.
- Separation of Lin-CD34+ and Lin-CD34- cells:
- Spin down the Lin- cells from the step 1.3.3 at 200 x g for 5 min. Resuspend the cell pellet with PBS and count the cells with a hemocytometer.
- Wash the cells twice with FACS buffer and pellet the cells at 200 x g for 5 min.
- Label five 1.5 ml microcentrifuge tubes with the number 1, 2, 3, 4, 5 respectively. Resuspend the cells with 100 µl FACS buffer per 106 cells (106 cells per tube).
- Add 1 µg of Anti-Mouse CD34 FITC antibody to tube 1 and tube 2 and mix the tubes gently.
- Incubate all tubes at 4 °C for 1 hr in the dark.
- Add 0.25 µg of PE-conjugated Anti-Sca1 antibody and 20 µl of APC-conjugated Lineage Cocktail antibodies to tube 1, 0.25 µg of PE-conjugated Anti-Sca1 antibody to tube 3, and 20 µl of APC-conjugated Lineage Cocktail antibodies to tube 4.
- Mix all the tubes gently and incubate the cells at 4 °C for an additional 30 min in the dark.
- Add 300 µl of FACS buffer to the cells and spin down the cells at 200 x g for 5 min.
- Wash the cells with 500 µl of FACS buffer for three times.
- Resuspend the cell pellet in 500 µl of FACS buffer.
- Use the cells in tubes 2, 3, 4, and 5 for setting up compensation. Isolate Lin-SCA+CD34+ and Lin-SCA-CD34- cells in tube 1 using FACS Aria.
2. RNA Preparation and Library Construction for High-throughput Sequencing
- Isolation, quality analysis and quantification of RNA:
- Extract total RNA from Lin-CD34+ and Lin-CD34- cells respectively using TRIzol following the manufactures’ protocol.
- Remove the contaminated DNA using deoxyribonuclease I (DNase I) following the manufacture’s protocol. Optionally, store the RNA at -80 °C at this step for further use.
- Assess the quality of total RNA using Bioanalyzer according to the instructions offered by the supplier. Use RNA sample with RNA Integrity Number (RIN) lager than 9.
- Library Construction and high-throughput sequencing:
NOTE: This protocol describes RNA-Seq using Illumina platform. For other sequencing platforms, different library preparation methods are required.- Use 0.1-4 µg of high quality total RNA per sample for library preparation. Normally 2 µg of total RNA can be extracted from 105 EML cells.
- Use a RNA-sequencing sample preparation system for RNA purification and fragmentation, first and second strand cDNA synthesis, end repair, 3’ ends adenylation, adapter ligation and PCR amplification, following the detailed standard procedures from the provider’s instructions.
- Positively select PolyA mRNA using oligo-dT magnetic beads and fragment the mRNA.
- Perform reverse transcription using random primers to obtain the cDNA and subsequently synthesize the second strand of cDNA to generate double stranded cDNA.
- Remove the 3' overhangs and fill the 5' overhangs by DNA polymerase. Adenylate 3' ends to prevent cDNA fragments from ligating to one another.
- Add multiplex indexing adapters to both ends of the dscDNA. Perform PCR for the enrichment of DNA fragments.
- Measure the A260/A280 to obtain information about the concentration of library using a spectrophotometer.
- Assess the library quality and measure the size range of DNA fragments using a Bioanalyzer.
3. Data Analysis
For reference of software used in this part, please see (Table 2).
- Data file processing for downstream analysis:
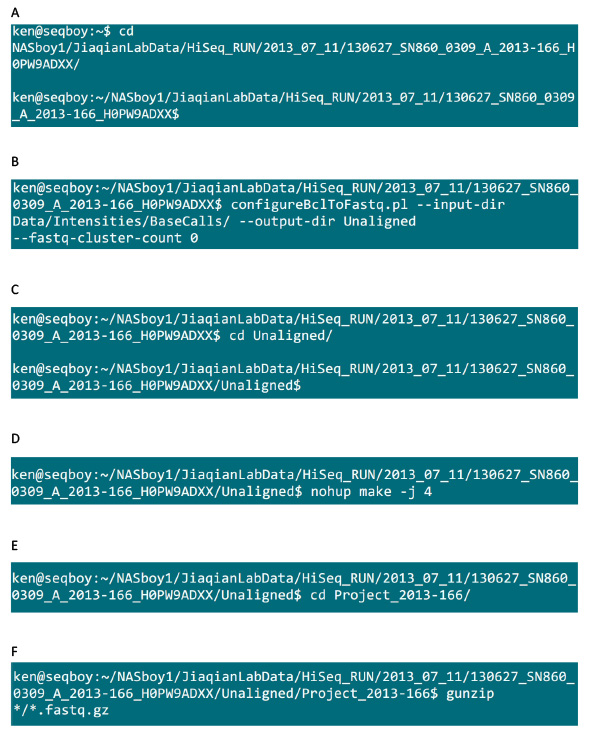
- Convert .bcl (base call file) file to .fastq file using CASAVA software (Illumina, version 1.8.2).
- Fire up the ‘Terminal’ in Linux system. Go to the data folder that contains the data file from an Illumina HiSeq2000 sequencing machine. Suppose the result folder is ‘NASboy1/JiaqianLabData/HiSeq_RUN/2013_07_11/130627_SN860_0309_A_2013-166_H0PW9ADXX/’, type in the command in Figure S1A, and enter the data folder.
- Install CASAVA 1.8.2 in the Linux system. Suppose the outputfolder is ‘Unaligned’, use the command in Figure S1B to prepare the configuration file for converting. Use the option --fastq-cluster-count 0 to ensure only one .fastq file is created for each sample. The generated .fastq file is in .gz format. Unzip it for downstream analysis (Figure S1B).
- After the ‘Unaligned’ folder has been generated, go to the ‘Unaligned’ folder (Figure S1C).
- Use the command in Figure S1D to begin the converting process. The ‘-j’ parameter supplies the cpu number that will be used.
- After the system finished the converting process, go to the result folder under ‘Unaligned’ folder (Figure S1E).
- Use the command in Figure S1F to decompress the .fastq.gz file into .fastq file under each sample folder.
- Convert .bcl (base call file) file to .fastq file using CASAVA software (Illumina, version 1.8.2).
- Detect novel transcripts and evaluate the expression level using Tuxedo Suite26:
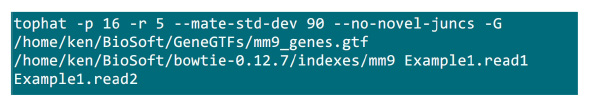
- Map the paired-end RNA-Seq reads to the mouse reference genome (UCSC version mm9, obtained from http://cufflinks.cbcb.umd.edu/igenomes.html) using Tophat software (version 1.3.3)27, which uses the Bowtie read mapper (version 0.12.7)28. Tophat is supplied with “-no-novel-juncs” option to improve estimation accuracy of expression level.
- Put the .fastq files in a folder where the mapping process will be implemented. Suppose there are 2 .fastq files (rename to Example1.read1, Example1.read2) for a paired-end sequencing sample, use the command in Figure S2 to do the mapping (adjust the parameters according to the system setting). The “-p” parameter supplies the cpu number that will be used. The “–r” and “–mate-std-dev” parameters can be obtained from library QC or inferred from a subset of aligned reads (Figure S2).
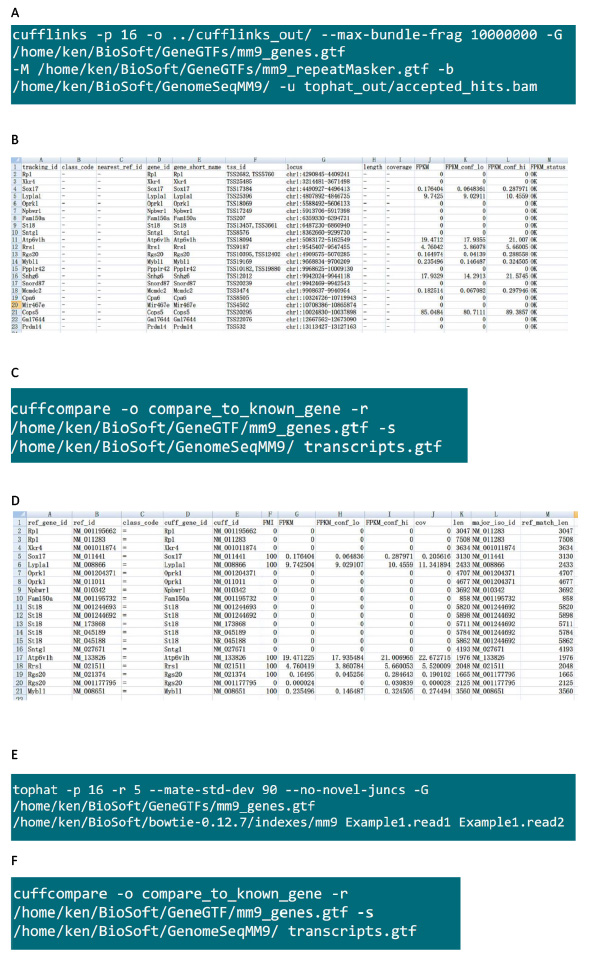
- Assemble the mapped reads into RNA transcripts using the Cufflinks software (version 1.3.0)29. Run Cufflinks using the annotation file of known genes (same .gtf file used by Tophat) and .bam file produced by Tophat.
- After Tophat finished running, in the same folder, use the command in Figure S3A to run cufflinks to construct transcriptome and estimate transcript expression level. The ‘mm9_repeatMasker.gtf’ and genome sequence files in the ‘GenomeSeqMM9’ folder can be obtained from UCSC Genome Browser.
- The resulting genes.expr and transcripts.expr files contain the expression value of genes and transcripts (isoforms). Copy and paste the file contents to an Excel file and manipulate with spreadsheet application (Figure S3B).
- Use the command in Figure S3C to compare the resulting ‘transcripts.gtf’ file to the reference ‘mm9_genes.gtf’ file in order to identify novel transcripts.
- The resulting .tmap file contains the comparison result. Copy and paste the file contents to an Excel file and manipulate with spreadsheet application. Transcripts with class code ‘u’ can be considered as ‘novel’ compared to the reference .gtf file provided (Figure S3D).
NOTE: For downstream analysis convenience, set the FPKM values to 0.1 if the values are under 0.1.
NOTE: Step 3.2.3 - 3.2.6 is optional for those who wish to improve accuracy of novel transcripts’ expression estimation. This will take a much longer time, because mapping and transcriptome construction need to be run more than once.
- Run Tophat using default parameters and then run cufflinks to generated .gtf file using the command in Figure S3E.
- Compare the resulting .gtf file to the reference genome .gtf file using the command in Figure S3F.
- Parse the resulted .tmap file as described in the step 3.2.2.4. Copy and paste the file contents to an Excel file and manipulate with spreadsheet application. Transcripts with class code ‘u’ can be considered as ‘novel’ compared to the reference .gtf file provided.
- After the step 3.2.5, there is a .combined.gtf file in the folder which can be used as the reference .gtf file. A second run of Tophat and cufflinks can be performed as described in the step 3.2.1 and 3.2.2 to obtain a more accurate FPKM estimation of novel transcripts.
- Map the paired-end RNA-Seq reads to the mouse reference genome (UCSC version mm9, obtained from http://cufflinks.cbcb.umd.edu/igenomes.html) using Tophat software (version 1.3.3)27, which uses the Bowtie read mapper (version 0.12.7)28. Tophat is supplied with “-no-novel-juncs” option to improve estimation accuracy of expression level.
- Detect differentially expressed genes using DESeq package30.
- The input of DESeq is a raw read counts table. To obtain such a table, use the htseq-count script distributed with the HTSeq Python package which can be downloaded from HTSeq website (http://www-huber.embl.de/users/anders/HTSeq/doc/count.html).
- Ensure that samtools, python, and htseq-count programsare installed in the system. Obtain raw read count numbers from tophat output by using the command in Figure S4A.
- Prepare ‘Raw_Count_Table.txt’, ‘ExperimentDesign.txt’ files using Excel. Copy and save the content in .txt format for the DESeq R package (Figure S4B).
- Install R program in the system. In the terminal, type ‘R’ and press ENTER.A screen message will appearas showed in Figure S4C.
- Read ‘Raw_Count_Table.txt’, ‘ExperimentDesign.txt’ into R using the command in Figure S4D.
- Load DESeq package using the command in Figure S4E.
- Factorize conditions in R (Figure S4F).
- Use the command in Figure S4G to run negative binominal test on the normalized count table.
- Use the command in Figure S4H to output significant differential expressed genes in a .csv file.
- The input of DESeq is a raw read counts table. To obtain such a table, use the htseq-count script distributed with the HTSeq Python package which can be downloaded from HTSeq website (http://www-huber.embl.de/users/anders/HTSeq/doc/count.html).
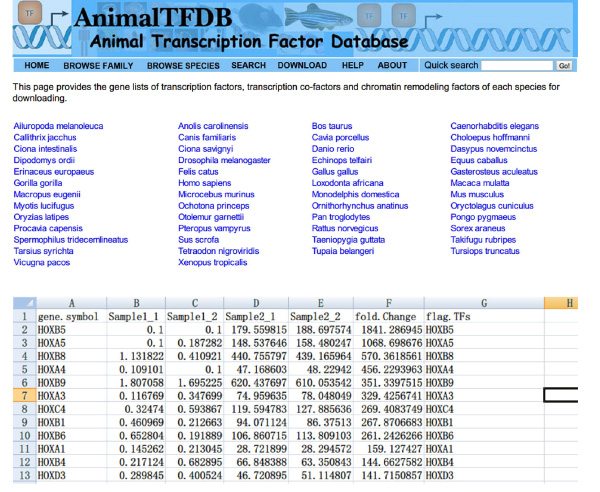
- Lookup transcription factors’ (TFs) FPKM values across samples using Excel. Intersect DE gene table and TFs table. Genes belong to both table are differentially expressed transcription factors.
- Go to the website http://www.bioguo.org/AnimalTFDB/download.php and download the transcription factors. Then lookup the DE transcription factors in the Excel (Figure S5).
- Generating .bigwig file for UCSC genome browser visualization.
- Download ‘bedtools’ software package from the website https://github.com/arq5x/bedtools2 and install the software in the system31. Download the UCSC tools ‘bedGraphToBigWig’ from the website http://hgdownload.cse.ucsc.edu/admin/exe/ and install the software in the system.
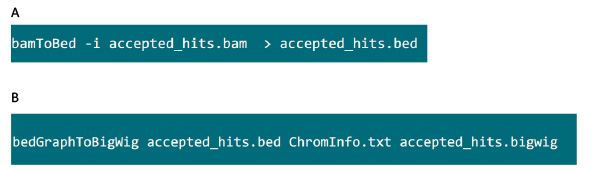
- In the folder containing the .bam file, use the command in Figure S6A to convert .bam file generated by tophat into .bed file.
- After the .bed file is produced, use the command in Figure S6B to generate .bigwig file. The file ‘ChromInfo.txt’ can be obtained from following url: http://hgdownload.cse.ucsc.edu/goldenPath/mm9/database/chromInfo.txt.gz.
- Observe a custom track on UCSC Genome Browser. Refer to the website http://genome.ucsc.edu/goldenPath/help/customTrack.html on how to display a custom track using UCSC genome browser.

Figure S1: Converting .bcl file to .fastq file using CASAVA software.

Figure S2: Mapping reads to reference genome using Tophat.

Figure S3: Detection of novel transcripts and expression level estimation.

Figure S4: Calling differential expressed gene using DESeq package.

Figure S5: Identification of differentially expressed transcription factors.

Figure S6: Converting mapping result for data visualization.
Subscription Required. Please recommend JoVE to your librarian.
Representative Results
In order to analyze differentially expressed genes in Lin-CD34+ and Lin-CD34- EML cells, we used RNA-Seq technology. Figure 1 shows the workflow of the procedures. After isolation of lineage negative cells by magnetic cell sorting, we separated Lin-SCA+CD34+ and Lin-SCA-CD34- cells using FACS Aria. Lin-enriched EML cells were stained with anti-CD34, anti-Sca1 and lineage cocktail antibodies. Only Lin- cells were gated for analysis of Sca1 and CD34 expression. Two populations (SCA+CD34+ and SCA-CD34- EML cells) could be observed by FACS analysis (Figure 2)6.
After cell separation, we extracted total RNA from CD34+ and CD34- cells respectively and analyzed the quality of RNA. The accuracy of RNA-Seq data largely relies on the quality of RNA-Seq library and the quality of total RNA is vital for preparing a high quality library. High quality RNA sample should have an OD 260/280 value between 1.8 and 2.0. In addition to using the spectrophotometer, RNA quality was further assessed with greater accuracy by Bioanalyzer. Figure 3 shows a result of a high quality RNA sample with the RIN equal to 9.4. Only high quality total RNA sample with RIN value greater than 9 was used for mRNA extraction and subsequent library construction procedures.
Ribosomal RNA is the most abundant type of RNA in cell. Currently two main strategies, depletion of rRNA or positively selection of polyadenylated mRNA (poly-A mRNA), are used for enrichment of target RNA before library construction. Non polyadenylated RNA species are lost during the selection of poly-A mRNA. In contrast, rRNA depletion methods such as RiboMinus could preserve non polyadenylated RNA species. The purpose of our study is to look for differentially expressed coding genes in two cell types, thus we used the poly-A mRNA selection method for enrichment of target RNAs before library construction. When library construction was finished, the size of DNA fragments in the library was checked before sequencing using Bioanalyzer. Figure 4 shows a good quality library with the fragment size peaks at about 300 bp.
In the subsequent step, the library was subjected to high-throughput sequencing. In principle, longer read length will be helpful for read mapping. It can reduce the probability that the read is mapped to multiple locations due to similarity among duplicate genes or gene family members. As the pair-end sequencing sequences are from both ends of the fragments, the read length chosen should be less than half of the average fragments length. If the main goal of the experiment is to measure the expression level instead of constructing transcript structure, single-end read (75 or 100 bp) can reduce the cost without losing too much information. Paired-end sequencing is more useful for transcript structure construction and shorter read length can be used to reduce cost. Certainly, when sufficient funding is available, longer read length is preferred.
For differential expression analysis, there are many alternative algorithms other than DESeq. There is also one included in cufflinks package named cuffdiff32. DESeq is one of the most widely used count based DE gene analysis algorithms. DESeq method is based on a well characterized statistics model — negative binomial distribution. In our experience, DESeq is more stable compare to cuffdiff. Early versions of cuffdiff often give significantly different numbers of DE genes. Therefore we used DESeq for DE analysis here.
Because transcription factors are crucial for cell fate determination, we focused on the significantly differentially expressed transcription factors33. The TFs changed >1.5 fold between Lin-CD34+ and Lin-CD34- were found and are shown on the heatmap (Figure 5)2. Notably, the relative expression level of Tcf7 in Lin-CD34+ cells is more than 100 fold higher than that in Lin-CD34- cells. Thus Tcf7 was chosen for further ChIP-Sequencing (Chromatin Immunoprecipitation and sequencing) analysis and functional test to confirm Tcf7’s function in regulation of EML cell self-renewal and differentiation2.

Figure 1: Workflow of the procedures. Lin-CD34+ and Lin-CD34- cells were separated by magnetic cell separation system and fluorescence-activated cell sorting method. Total RNA was extracted followed by mRNA purification and library construction. After analysis of library quality, samples were subjected to high throughput sequencing. Data were analyzed and differentially expressed transcription factors were identified.

Figure 2: Separation of Lin-CD34+ and Lin-CD34- EML cells6. Lin- EML cells were enriched by magnetic cell sorting. Lin- cells were stained with anti-CD34, anti-Sca1 and lineage mixture antibodies. Lin- cells were gated for expression of CD34 and Sca1. Lin-CD34+SCA+ and Lin-CD34-SCA- EML cell populations were sorted.

Figure 3: A representative of high-quality total RNA sample. The quality of total RNA was assessed by Bioanalyzer. The RNA Integrity Number is 9.4 (FU, Fluorescence Units).

Figure 4: Fragments size range of Paired-End library. The DNA size distribution of the library was analyzed using Bioanalyzer. Most fragments are within the size range of 250-500 bp.

Figure 5: Differentially expressed transcription factors (>1.5 fold) between Lin-CD34+ cells and Lin-CD34- cells2. For each cell type, two independent experiments were performed. Up-regulated genes are indicated as red color and down-regulated genes are indicated as green color.
| BHK medium | |
| 100x Antibiotic-Antimycotic | 10 ml |
| 200 mM L-Glutamine | 10 ml |
| FBS | 100 ml |
| DMEM | 880 ml |
| Total volume | 1,000 ml |
| EML Basic medium | |
| IMDM | 390 ml |
| HI horse serum | 100 ml |
| 100 x Penicillin-Streptomycin | 5 ml |
| 200 mM L-Glutamine | 5 ml |
| BHK medium | 75 ml |
| Total Volume | 575 ml |
| Filtrate through 0.45 μM filter | |
| FACS buffer | |
| BSA | 0.50% |
| EDTA | 1 mM |
| Dissolved in PBS and filtrate through 0.45 μM filter | |
Table 1: Buffers and Cell culture mediums.
| Software | Usage | Reference |
| Bowtie 1.2.7 | Used by Tophat for mapping | [28] |
| Tophat 1.3.3 | Mapping reads back to reference genome | [27] |
| Cufflinks 1.3.0 | Transcripts construction and expression level estimation | [29] |
| DESeq 1.16.0 | Differential expression analysis | [30] |
| Bedtools 2.18 | Convert .bam file into .bed file | [31] |
| bedGraphToBigWig | Convert .bed file to .bigwig file | http://genome.ucsc.edu/ |
Table 2: List of software for data analysis.
Subscription Required. Please recommend JoVE to your librarian.
Discussion
Mammalian transcriptome is very complex34-38. RNA-Seq technology plays an increasingly important role in the studies of transcriptome analysis, novel transcripts detection and single nucleotide variation discovery etc. It has many advantages over other methods for gene expression analysis. As mentioned in the introduction, it overcomes the hybridization artifacts of microarray and can be used to identify novel transcripts de novo. One limitation of RNA-sequencing is relative short read length comparing to Sanger sequencing. However, with the rapid improvement of sequencing technology, read length is increasing constantly. In this paper, we provide detailed methods of using this technology to identify potential key regulators in mouse EML cell self-renewal and differentiation.
The first key step for this protocol is EML cell culture. Although EML is a hematopoietic precursor cell line and it can be propagated in large quantity with SCF. The culturing condition of EML cells requires more attention than the usual immortalized cell lines. The cells should be fed and passaged at a regular basis with gentle operation; otherwise the cells could change in their properties of self-renewal and differentiation and undergo cell death. As the first step after collecting enough cells, we isolated lineage negative cells using a magnetic activated cell sorting system. Then we separated CD34+ and CD34- cells using fluorescence-activated cell sorting. The EML cells are normally passaged less than 10 generations before using for RNA extraction and the numbers of CD34+ and CD34- cells should be similar after separation. If the two populations vary greatly in cell number, it is advisable to discard the culture and re-thaw another tube of cell stock for culture.
After separation of CD34+ and CD34- cell, total RNA extraction was performed, another important step for this study. High quality RNA is the base for construction of a high quality library, which promises the accuracy of the sequencing data. In this critical step, any contact with RNase should be avoided. All reagents should be RNase free. It is important to wear gloves at all times while handling RNA. High quality RNA sample has an OD 260/280 value between 1.8 and 2.0. When collecting the aqueous phase containing RNA, be careful not to carry any organic phase with the RNA sample. Any residual organic solvents such as phenol or chloroform in the RNA would result in an OD260/280 value lower than 1.65. If the OD260/280 value is lower than 1.65, precipitate RNA again with ethanol. After washing with 75% ethanol, do not overdry RNA pellet. Drying RNA pellet completely will affect the solubility of RNA and lead to low yield of RNA.
The next key step for this protocol is library preparation. After total RNA extraction, a step of using DNase for removal of contaminated DNA is highly recommended, since DNA contamination might result in wrong estimation of the amount of total RNA used. It is recommended to perform the downstream procedure immediately after RNA isolation, since after long-term storage and freeze-thawing procedure, RNA will degrade to some degree. If the subsequent steps after RNA isolation can not be performed immediately, store the RNA in -80 °C. Before total RNA is used for mRNA purification and cDNA synthesis, the quality should always be checked. Only high quality RNA can be used for library preparation. Using low quality or degraded RNA might lead to over-representation of 3' ends. Before sequencing, library quality was assessed to ensure maximum sequencing efficiency.
In the data analysis part, after performing a run of Cufflinks without a reference transcriptome, we combined the novel transcripts with known transcripts to form a reference .gtf file and run Tophat and cufflinks for the second time. This two-run procedure is recommended, since this provide more accurate FPKM estimation than running only once. After data analysis, the differentially expressed genes were identified. Downstream experiments can be performed to validate the function of genes in vitro and in vivo. In our previous publication2, we chose the significantly differentially expressed transcription factors and identified the genome binding site of these factors by performing chromatin immunoprecipitation and sequencing (ChIP-Seq). In addition, we applied shRNA knockdown assay to test the functional effect of Tcf7. We found that in Tcf7 knockdown cells, up-regulated genes were the genes highly enriched in CD34- cells, while down-regulated genes were found to be significantly enriched in CD34+ cells. Therefore, the gene expression profile of Tcf7 knockdown cells shifted toward a partially differentiated CD34- state.Overall, using EML cell as a model system coupled with RNA-Sequencing technology and functional assays, we identified and confirmed Tcf7 as an important regulator of EML cell self-renewal and differentiation.
Subscription Required. Please recommend JoVE to your librarian.
Disclosures
The authors have nothing to disclose.
Acknowledgments
JQW, SZ, SD and KC are supported by grant from the National Institutes of Health and the Staman Ogilvie Fund—Memorial Hermann Foundation.
Materials
| Name | Company | Catalog Number | Comments |
| Antibiotic-Antimycotic | Invitrogen | 15240-062 | BHK cell culture |
| Anti-Mouse CD34 FITC | eBioscience | 11-0341-81 | FACS sorting |
| Anti-Mouse Ly-6A/E (Sca-1) PE | eBioscience | 12-5981-81 | FACS sorting |
| APC Mouse Lineage Antibody Cocktail | BD Biosciences | 558074 | FACS sorting |
| BD FACSAria Cell Sorter | BD Biosciences | Special offer sysmtem | FACS sorting |
| Corning™ Cell Culture Treated Flasks 75 cm2 | Corning incorporated | 430641 | Cell culture |
| Corning™ Cell Culture Treated Flasks 25 cm2 | Corning incorporated | 430639 | Cell culture |
| Deoxyribonuclease I, Amplification Grade | Invitrogen | 18068-015 | Library preparation |
| DMEM | Invitrogen | 11965-092 | BHK cell culture |
| DPBS | Gibco | 14190 | Cell culture |
| HI FBS | Invitrogen | 16140071 | BHK cell culture |
| Horse Serum | Invitrogen | 16050-122 | EML cell culture |
| IMDM | HyClone | SH30228.02 | EML cell culture |
| L-Glutamine | Invitrogen | 25030-081 | Cell culture |
| Lineage Cell Depletion Kit, mouse | Miltenyi Biotec | 130-090-858 | Isolation of lineage negative cells |
| NanoVue Plus spectrophotometer | GE Healthcare | 28-9569-62 | Quality control |
| Thermo Scientific™ Napco™ 8000 Water-Jacketed CO2 Incubators | Thermo Scientific | 15-497-002 | Cell culture |
| Penicillin-Streptomycin | Invitrogen | 15140-122 | EML cell culture |
| TRIzol® Reagent | Invitrogen | 15596-018 | RNA exraction |
| TruSeq™ RNA Sample Prep Kit v2 -Set B (48 rxn) | Illumina | RS-122-2002 | Library preparation |
| 2100 Electrophoresis Bioanalyzer Instrument | Agilent | G2939AA | Quality control |
| 0.25% Trypsin-EDTA | Gibco | 25200 | Cell culture |
| 0.45 µm Syringe Filters | Nalgene | 190-2545 | Cell culture |
References
- Chambers, S. M., Goodell, M. A. Hematopoietic stem cell aging: wrinkles in stem cell potential. Stem Cell Rev. 3, 201-211 (2007).
- Wu, J. Q., et al. Tcf7 is an important regulator of the switch of self-renewal and differentiation in a multipotential hematopoietic cell line. PLoS genetics. 8, (2012).
- Ye, Z. J., et al. Complex interactions in EML cell stimulation by stem cell factor and IL-3. Proceedings of the National Academy of Sciences of the United States of America. 108, 4882-4887 (2011).
- Tsai, S., Bartelmez, S., Sitnicka, E., Collins, S. Lymphohematopoietic progenitors immortalized by a retroviral vector harboring a dominant-negative retinoic acid receptor can recapitulate lymphoid, myeloid, and erythroid development. Genes Dev. 8, 2831-2841 (1994).
- Weiler, S. R., et al. D3: a gene induced during myeloid cell differentiation of Linlo c-Kit+ Sca-1(+) progenitor cells. Blood. 93, 527-536 (1999).
- Ye, Z. J., Kluger, Y., Lian, Z., Weissman, S. M. Two types of precursor cells in a multipotential hematopoietic cell line. Proc Natl Acad Sci U S A. 102, 18461-18466 (2005).
- Wang, Z., Gerstein, M., Snyder, M. RNA-Seq: a revolutionary tool for transcriptomics. Nature reviews. Genetics. 10, 57-63 (2009).
- Chu, Y., Corey, D. R. RNA sequencing: platform selection, experimental design, and data interpretation. Nucleic acid therapeutics. 22, 271-274 (2012).
- Hornett, E. A., Wheat, C. W. Quantitative RNA-Seq analysis in non-model species: assessing transcriptome assemblies as a scaffold and the utility of evolutionary divergent genomic reference species. BMC genomics. 13, 361 (2012).
- Eswaran, J., et al. RNA sequencing of cancer reveals novel splicing alterations. Scientific reports. 3, 1689 (2013).
- Wang, E. T., et al. Alternative isoform regulation in human tissue transcriptomes. Nature. 456, 470-476 (2008).
- Wu, J. Q., et al. Dynamic transcriptomes during neural differentiation of human embryonic stem cells revealed by short, long, and paired-end sequencing. Proceedings of the National Academy of Sciences of the United States of America. 107, 5254-5259 (2010).
- Loraine, A. E., McCormick, S., Estrada, A., Patel, K., Qin, P. RNA-seq of Arabidopsis pollen uncovers novel transcription and alternative splicing. Plant physiology. 162, 1092-1109 (2013).
- Edgren, H., et al. Identification of fusion genes in breast cancer by paired-end RNA-sequencing. Genome biology. 12, 6 (2011).
- Ilott, N. E., Ponting, C. P. Predicting long non-coding RNAs using RNA sequencing. Methods. 63, 50-59 (2013).
- Sun, L., et al. Prediction of novel long non-coding RNAs based on RNA-Seq data of mouse Klf1 knockout study. BMC bioinformatics. 13, 331 (2012).
- Luo, S. MicroRNA expression analysis using the Illumina microRNA-Seq Platform. Methods in molecular biology. 822, 183-188 (2012).
- Bolduc, F., Hoareau, C., St-Pierre, P., Perreault, J. P. In-depth sequencing of the siRNAs associated with peach latent mosaic viroid infection. BMC molecular biology. 11, 16 (2010).
- Chepelev, I., Wei, G., Tang, Q., Zhao, K. Detection of single nucleotide variations in expressed exons of the human genome using RNA-Seq. Nucleic acids research. 37, 106 (2009).
- Djari, A., et al. Gene-based single nucleotide polymorphism discovery in bovine muscle using next-generation transcriptomic sequencing. BMC genomics. 14, 307 (2013).
- Murphy, D. Gene expression studies using microarrays: principles, problems, and prospects. Advances in physiology education. 26, 256-270 (2002).
- Chen, K., et al. RNA-seq characterization of spinal cord injury transcriptome in acute/subacute phases: a resource for understanding the pathology at the systems level. PLoS one. 8, 72567 (2013).
- Marioni, J. C., Mason, C. E., Mane, S. M., Stephens, M., Gilad, Y. RNA-seq: an assessment of technical reproducibility and comparison with gene expression arrays. Genome research. 18, 1509-1517 (2008).
- Ramskold, D., Kavak, E., Sandberg, R. How to analyze gene expression using RNA-sequencing data. Methods in molecular biology. 802, 259-274 (2012).
- Glenn, T. C. Field guide to next-generation DNA sequencers. Mol Ecol Resour. 11, 759-769 (2011).
- Trapnell, C., et al. Differential gene and transcript expression analysis of RNA-seq experiments with TopHat and Cufflinks. Nature protocols. 7, 562-578 (2012).
- Trapnell, C., Pachter, L., Salzberg, S. L. TopHat: discovering splice junctions with RNA-Seq. Bioinformatics. 25, 1105-1111 (2009).
- Langmead, B., Trapnell, C., Pop, M., Salzberg, S. L. Ultrafast and memory-efficient alignment of short DNA sequences to the human genome. Genome biology. 10, 25 (2009).
- Trapnell, C., et al. Transcript assembly and quantification by RNA-Seq reveals unannotated transcripts and isoform switching during cell differentiation. Nature. 28, 511-515 (2010).
- Anders, S., Huber, W. Differential expression analysis for sequence count data. Genome biology. 11, 106 (2010).
- Quinlan, A. R., Hall, I. M. BEDTools: a flexible suite of utilities for comparing genomic features. Bioinformatics. 26, 841-842 (2010).
- Cheranova, D., et al. RNA-seq analysis of transcriptomes in thrombin-treated and control human pulmonary microvascular endothelial cells. J Vis Exp. , (2013).
- Zhang, H. M., et al. AnimalTFDB: a comprehensive animal transcription factor database. Nucleic acids research. 40, 144-149 (2012).
- Wu, J. Q., et al. Systematic analysis of transcribed loci in ENCODE regions using RACE sequencing reveals extensive transcription in the human genome. Genome Biol. 9, 3 (2008).
- Wu, J. Q., et al. Large-scale RT-PCR recovery of full-length cDNA clones. Biotechniques. 36, 690-696 (2004).
- Wu, J. Q., Shteynberg, D., Arumugam, M., Gibbs, R. A., Brent, M. R. Identification of rat genes by TWINSCAN gene prediction, RT-PCR, and direct sequencing. Genome Res. 14, 665-671 (2004).
- Dewey, C., et al. Accurate identification of novel human genes through simultaneous gene prediction in human, mouse, and rat. Genome Res. 14, 661-664 (2004).
- Wu, J. Characterize Mammalian Transcriptome Complexity. , LAP Lambert Academic Publishing. (2011).
