

Summary
We present a method for the electroretinographic (ERG) analysis of zebrafish larvae utilizing micromanipulation and electroretinography techniques. This is a simple and straightforward method for assaying visual function of zebrafish larvae in vivo.
Abstract
The electroretinogram (ERG) is a noninvasive electrophysiological method for determining retinal function. Through the placement of an electrode on the surface of the cornea, electrical activity generated in response to light can be measured and used to assess the activity of retinal cells in vivo. This manuscript describes the use of the ERG to measure visual function in zebrafish. Zebrafish have long been utilized as a model for vertebrate development due to the ease of gene suppression by morpholino oligonucleotides and pharmacological manipulation. At 5-10 dpf, only cones are functional in the larval retina. Therefore, the zebrafish, unlike other animals, is a powerful model system for the study of cone visual function in vivo. This protocol uses standard anesthesia, micromanipulation and stereomicroscopy protocols that are common in laboratories that perform zebrafish research. The outlined methods make use of standard electrophysiology equipment and a low light camera to guide the placement of the recording microelectrode onto the larval cornea. Finally, we demonstrate how a commercially available ERG stimulator/recorder originally designed for use with mice can easily be adapted for use with zebrafish. ERG of larval zebrafish provides an excellent method of assaying cone visual function in animals that have been modified by morpholino oligonucleotide injection as well as newer genome engineering techniques such as Zinc Finger Nucleases (ZFNs), Transcription Activator-Like Effector Nucleases (TALENs), and Clustered Regularly Interspaced Short Palindromic Repeats (CRISPR)/Cas9, all of which have greatly increased the efficiency and efficacy of gene targeting in zebrafish. In addition, we take advantage of the ability of pharmacological agents to penetrate zebrafish larvae to evaluate the molecular components that contribute to the photoresponse. This protocol outlines a setup that can be modified and used by researchers with various experimental goals.
Introduction
The electroretinogram (ERG) is a noninvasive electrophysiological method that has been used extensively in the clinic for determining the function of the retina in humans. The electrical activity in response to a light stimulus is measured by placing recording electrodes on the outer surface of the cornea. The characteristics of the stimulus paradigm and the response waveform define the retinal neurons contributing to the response. This method has been adapted for use with a number of animal models including mice and zebrafish. The typical vertebrate ERG response has four principal components: the a-wave, which is a cornea-negative potential derived from photoreceptor cell activity; the b-wave, a cornea-positive potential derived from the ON bipolar cells; the d-wave, a cornea-positive potential interpreted as the activity of the OFF bipolar cells; and the c-wave, which occurs several seconds after the b-wave and reflects activity in Müller glia and the retinal pigment epithelium1-4. Additional references for understanding the history and principles of ERG analysis in humans and model animals are the online textbook, Webvision, from the University of Utah and texts such as the Principles and Practice of Clinical Electrophysiology of Vision4,5.
Daniorerio (zebrafish) has long been favored as a model for vertebrate development, due to its rapid maturation and transparency, which allows for noninvasive morphological analysis of organ systems, behavioral assays and both forward and reverse genetic screens (for review, see Fadool and Dowling6). Zebrafish larvae are highly amenable to genetic and pharmacological manipulation, which, when coupled with their high fecundity, make them an excellent animal model for high-throughput biological analyses. The higher ratio of cones to rods in larval zebrafish – roughly 1:1 compared to mice (~3% cones) – make them particularly useful for the study of cone function7-9.
In the vertebrate retina, cones develop before rods10. Interestingly, zebrafish cones are operative as early as 4 dpf, allowing for selective electrophysiological analysis of cones at that stage6,11,12. In contrast, ERG responses in rods appear between 11 and 21 dpf13. Therefore, zebrafish larvae at 4-7 dpf serve functionally as an all-cone retina. However, the native photopic ERG response of 4-7 dpf larvae is dominated by the b-wave. Application of pharmacological agents, such as L-(+)-2-amino-4-phosphono-butyric acid (L-AP4), an agonist for the metabotropic glutamate (mGluR6) receptor expressed by the ON bipolar cells, effectively blocks the generation of the b-wave and reveals the isolated cone mass receptor potential, (the “a-wave”)14-17.
Here we describe a simple and reliable method for ERG analysis using commercially available ERG equipment designed for use with mice that have been adapted for use with zebrafish larvae. This system can be utilized on zebrafish larvae of varying genetic backgrounds, as well as those treated with pharmacological agents, to aid researchers in the identification of signaling pathways that contribute to visual sensitivity and light adaptation16. The experimental procedures outlined in this protocol will guide investigators in the use of ERG analysis to answer a variety of biological questions pertaining to vision, and demonstrate the construction of a flexible ERG setup.
Subscription Required. Please recommend JoVE to your librarian.
Protocol
Animal upkeep and experimental protocols were approved by the Institutional Animal Care and Use Committees of the University of North Carolina at Chapel Hill, and meet all requirements of the NIH Office of Laboratory Animal Welfare and the Association for Assessment and Accreditation of Laboratory Animal Care International.
NOTE: To obtain larvae for ERG analysis, published protocols for standard zebrafish husbandry and maintenance were employed18. Larvae are obtained through natural breeding and housed under a 14 hr light/10 hr dark cycle. This protocol has been optimized for larvae at 5-7 days post-fertilization (dpf), but could ideally be performed on older fish with small modifications to the procedure. Here, use the TL strain of wild-type zebrafish larvae at 5 dpf.
1. Micropipette Production
- Pull several micropipettes using 1.5 x 0.86 mm (outer diameter by inner diameter) fire-polished borosilicate glass capillaries with filament (melting temperature, 821 °C) and a P-97 Flaming/Brown Micropipette Puller fitted with box heat filament. Use the program for fashioning micropipettes described in Table 1.
- Check each micropipette under a microscope with an appropriate graticule ruler to ensure that tips are 10-15 µm in diameter and has a smooth tip opening (i.e., no jagged edges).
- Carefully store micropipettes to prevent tip damage and exposure to dust. Storage options include Petri dishes with lab tape, foam-lined boxes, or commercially available micropipette storage containers.
NOTE: Other micropipette pullers and glass capillaries can be used as long as the correct diameter of the micropipette and a high-quality tip is achieved.
| Pressure | Heat | Pull | Velocity | Time |
| 500 | 560 | - | 30 | 200 |
| 500 | 450 | - | 30 | 200 |
| 500 | 410 | 55 | 40 | 200 |
Table 1: Program for the production of micropipettes using a P-97 Flaming/brown Micropipette Puller fitted with a box heat filament. Micropipettes are made using 1.5 x 1.0 mm2 (outer diameter by inner diameter) fire-polished borosilicate glass capillaries with filament (melting temperature, 821 °C).
2. Buffer Preparation
- Use filtered, oxygenated goldfish Ringer's buffer19 in the microelectrode capillary and to saturate the polyvinyl alcohol (PVA) sponge onto which the larvae are placed for experiments. Alternatively, use E3 embryo media or Hank's Balanced Salt Solution.
- Prepare 10x goldfish Ringer's solution as described in Table 2. Adjust to pH 7.8, and sterilize using a 0.22 µm filter and store the 10x stock at 4 °C.
- Create a working solution on the day of the experiment by diluting the 10x Ringer's solution to 1x with deionized, distilled water. Filter using a 0.22 µm filter system. Oxygenate by bubbling with 95% O2/5% CO2 gas for 10 minutes. Cap tightly afterwards to ensure that the solution remains oxygenated.
| NaCl | 1.25 M |
| KCl | 26 mM |
| CaCl2 | 25 mM |
| MgCl2 | 10 mM |
| glucose | 100 mM |
| HEPES | 100 mM |
Table 2: Preparation of 10x goldfish Ringer’s solution.
3. Electroretinogram Platform
- Perform ERG experiments on an anti-vibration table inside a Faraday cage to improve the signal to noise ratio. Attach a custom steel platform to the anti-vibration table using hex nuts. Place a movable plastic platform with a viscoelastic urethane polymer shock-absorbing bottom on the table under the light source.
- Position the camera with a magnetized stand, aimed down at the movable plastic platform. Position the micromanipulator (which will hold the recording microelectrode) with a second magnetized stand to the right of the movable plastic platform. Ensure that the camera and micromanipulator will not be disturbed by the movement of other equipment and that they do not block illumination from the light source.
- Connect the camera to a video monitor and position it to view the eye of the larva for placing the electrode in the proper position.
- Ensure that the setup is properly grounded with copper wire. To check the noise, place the reference electrode and tip of the recording microelectrode in a 35 mm Petri dish filled with Ringer's solution. Check the electrical noise levels of the setup with an oscilloscope or a built-in feature of the ERG apparatus. Noise levels should be no more than ±10 µV from baseline.
4. Sponge Preparation
- Cut a small rectangle of dry PVA sponge that will fit snugly in a 35 mm Petri dish. The thickness of the sponge should not be greater than the depth of the dish. Use a utility knife with a clean razor blade for cutting.
- Make an additional cut into the sponge to accommodate the reference electrode (either a shallow cut lengthwise on the bottom of the sponge or a butterfly cut vertically through one of the smaller ends).
- Use a chemically resistant marker to mark a small dot on the sponge (where the larva will be placed) that can be used for positioning the camera.
- Soak the PVA sponge in Ringer's solution until saturated. Remove and blot quickly on a paper towel 2-3 times. Place the sponge in a clean 35 mm Petri dish.
- Position the Petri dish containing the sponge on the plastic platform such that the mark can be visualized by the camera.
5. Electrode Preparation
NOTE: The zebrafish setup consists of a reference electrode in contact with the Ringer's solution-saturated PVA sponge and a recording electrode in contact with the cornea. The reference electrode consists of an Ag/AgCl pellet. The recording electrode is a pulled glass micropipette filled with Ringer's solution and held by a microelectrode holder containing an Ag wire.
- Chloride the electrodes by soaking them in 6-9% sodium hypochlorite (bleach) for 5 min (the recording microelectrode wire) or 15 min (the reference electrode). Air dry on a Kimwipe for 5 min.
- Depending on the style of cut made in Step 4.2, place the Ag/AgCl pellet of the reference electrode into (for the vertical butterfly cut) or under (for the shallow cut lengthwise on the bottom) the sponge. Attach the reference electrode lead to the recording system.
- Alternatively, if the ERG setup has space constraints or there are particularly strong photovoltaic artifacts from the Ag/AgCl electrode, connect the reference electrode to the sponge via an agar salt bridge to move the electrode out of the light path.
- Attach ~40 cm of appropriately sized tubing to a 5 ml non-Luer lock syringe. Fill the syringe with Ringer's solution. Microelectrode holders possessing pressure ports typically ship with adaptors to accommodate tubing with inner diameters of 1/16”, 3/32”, 1/8” or 5/32”.
- Fill a 1 ml non-Luer lock syringe with Ringer's solution and, using a Micro-fil, carefully fill the microelectrode holder. Prevent the formation of bubbles.
- Attach the 5 ml syringe to the pressure port of the microelectrode holder with tubing and use it to ensure that the microelectrode holder is full of Ringer's solution. Using the Micro-fil and 1-ml syringe filled with Ringer's solution, fill the micropipette glass from the tip and ensure that no bubbles are present.
- Attach the glass micropipette to the microelectrode holder, being careful to keep the electrode wire straight. Once secured, use the 5 ml syringe to carefully force Ringer's solution through the microelectrode until a tiny amount of solution is visible on the tip. Occasional application of pressure to the syringe (when not applied to cornea) will prevent formation of air bubbles, as well as occlusions due to dust or salt accumulation, in the micropipette tip.
- If the solution comes out as a stream, replace the glass micropipette, as the tip opening is too large or is damaged.
- Carefully place the recording microelectrode in the micromanipulator and attach the lead to the recording system.
6. Electroretinogram Analysis
NOTE: Due to the cone dominance of the larval retina, high quality ERG results can be obtained when preparations for recording are performed under low levels of indirect white light (<1 lux) or with short periods (<1 min) of higher intensity (≤250 lux) working light. A short period of dark adaptation is still required prior to recording (see step 6.7). However, experiments can be performed under dim red or infrared light using an infrared-sensitive camera. All experiments were performed in filter-sterilized (0.22 µm) system water from the UNC Zebrafish AquaCulture Facility but alternative embryo media can be used.
- Cut paper towel squares measuring approximately 1 cm2.
- If measuring isolated cone mass receptor potential, incubate 3-5 larvae in system water with 500 µM (±)-2-Amino-4-phosphonobutyric acid (APB) for 5 min.
NOTE: While APB is a racemic mixture of the active (L) and inactive (R) forms of AP4, it is as effective as L-AP4 and is less expensive. - Anesthetize 3-5 larvae in system water with 0.02% (w/v) Tricaine until unresponsive, about 1-2 min.
- Use a Pasteur pipette and pipette pump to carefully transfer individual larvae onto paper towel squares under a dissecting stereoscope using minimal illumination (≤250 lux for <1 min). Check the position of each larva and choose a candidate that is dorsal side up with an unoccluded eye.
- For extended recordings (>30 min), keep the larva moist by glazing the body up to but not including the head with 3% methylcellulose using a fine camel-hair brush.
- Using forceps, transfer the paper towel square with the larva to the damp PVA sponge.
- For extended recordings (>30 min), apply a continuous stream of water-saturated 100% O2 gas over the larva by bubbling the gas through an airstone in a side-arm flask containing distilled water. Position the tubing exiting the flask side-arm that conveys the humidified oxygen near the larva's head.
NOTE: Step 6.4.1 and step 6.5.1 will prolong the life of the fish16.
- For extended recordings (>30 min), apply a continuous stream of water-saturated 100% O2 gas over the larva by bubbling the gas through an airstone in a side-arm flask containing distilled water. Position the tubing exiting the flask side-arm that conveys the humidified oxygen near the larva's head.
- Under minimal illumination, use the micromanipulator and camera to position the microelectrode tip at the midpoint between the nasal and caudal ends of the eye and gently press onto the dorsal limit of the cornea.
NOTE: Misplacement of the electrode tip to the far distal areas of the cornea can result in ERG waveforms of reversed polarity. - Allow larva to dark-adapt for 5-10 min.
- Record test flash responses to light provided from an LED light source or optical stimulator using the available stimulation and recording equipment. Adjust protocol parameters such as flash intensity, flash length, flash color, background intensity and color and filter settings to fit the experiment.
- When finished with the experiment, euthanize larvae according to AVMA/IACUC guidelines.
Subscription Required. Please recommend JoVE to your librarian.
Representative Results
Typically, ERGs are recorded from zebrafish larvae at 5 dpf, since a number of studies have published ERG recordings at this stage9,16,20. Larval responses were measured under dark-adapted conditions with no background illumination using a 20 msec stimulus of white LED light. We utilized a commercially available ERG system consisting of a Ganzfeld light stimulator and computer controller/recorder. The stimulator uses a tightly controlled proprietary pulse width modulation (PWM) system to control the luminance of both the background and flash stimulus. Responses were recorded using a proprietary fully differential amplifier with a hardware anti-aliasing filter driving a 16-bit analog to digital converter (ADC). Stimulus and response recordings were controlled by proprietary software included with the equipment according to the manufacturer’s protocol. Our equipment was programmed to utilize a sampling rate of 1 kHz, digital Bessel cascade filters set to a bandpass of between 0.312 Hz and 300 Hz, and a 60 Hz notch filter to remove excess noise. In the dark-adapted larva the b-wave increases in amplitude with increasing light intensities (Figure 1). The a-wave is typically obscured by the b-wave and cannot be reliably detected. The b-wave can be blocked by incubating the larvae with the metabotropic glutamate receptor (mGluR6) agonist, 4-phosphono-butyric acid (APB). This allows for the cone mass receptor potential (or “a-wave”) to be detected. This “a-wave” response increases in amplitude with increasing intensities of light (Figure 2).
Additional paradigms can be utilized to test visual parameters beyond basic visual function and sensitivity. Through the use of a dual flash paradigm, one can measure the ability of the cone photoresponse to recover from the initial stimulus (Figure 3A). As the interstimulus interval (ISI) increases, the amplitude of the second response increases, indicating recovery from the initial stimulus (Figure 3B). The APB-isolated “a-wave” traces presented are the average of three sweeps and conform to published reports of the zebrafish larval ERGs utilizing similar stimulation paradigms2,9,16.
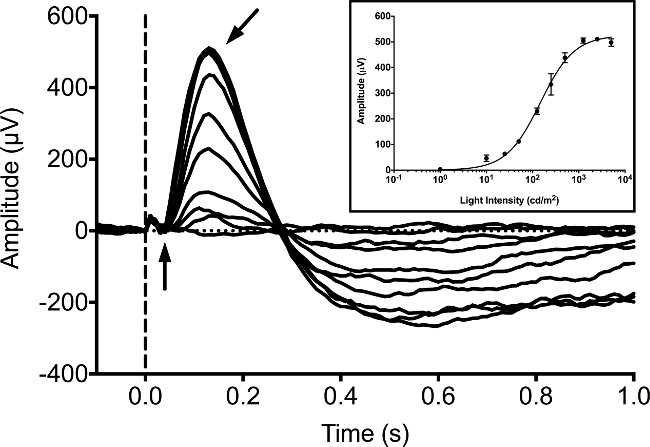
Figure 1: Typical ERG recording in 5 dpf larval zebrafish. The intensity series was obtained under dark-adapted conditions. The fish are exposed to LED white light for a duration of 20 msec with intensities equaling 1, 10, 25, 50 125, 250, 500, 1,250, 2,500 and 5,000 cd/m2. The onset of light stimulus is denoted by the dotted vertical line. The negative potential a-wave (vertical arrow) is difficult to distinguish, whereas the positive potential b-wave (angled arrow) is the dominant peak of the waveform. A small photovoltaic artifact can be observed as a minor positive deflection prior to onset of the a-wave. Inset, averaged b-wave response amplitudes with increasing intensities of light that have been fit using the Naka-Rushton equation21,22. Error bars represent SEM.

Figure 2: APB-isolated cone mass receptor potential recorded from larval zebrafish. Intensity series obtained under dark-adapted conditions at 5 dpf. The stimulus is a 20 msec LED white light with intensities equaling 1, 10, 25, 50 125, 250, 500, 1,250, 2,500 and 5,000 cd/m2. The onset of light stimulation is denoted by the dotted vertical line. The isolated cone mass receptor potential (“a-wave”) is the dominant element of the waveform (arrow). A small photovoltaic artifact can be observed as a minor positive deflection prior to onset of the cone response. Inset, averaged response amplitudes with increasing intensities of light that have been fit using the Naka-Rushton equation. Error bars represent SEM.

Figure 3: Cone mass receptor potential recording utilizing a dual flash paradigm. A 5 dpf APB-treated larva was subjected to two 20 msec flashes of white light (LED source), each with an intensity of 1,000 cd/m2. (A) The response to 2 successive flashes with an interstimulus interval (ISI) equal to 2 sec. Light exposures are marked by dotted vertical lines. The amplitude of the second response is lower than that of the first response, indicating incomplete response recovery. (B) The ratio of the maximum isolated cone mass receptor potential response of the second stimulus to that of the initial stimulus for each ISI. A best-fit non-linear regression analysis has been applied. As the ISI increases, the response to the second stimulus increases in amplitude relative to the response to the initial stimulus indicating progressive recovery of photoreceptor sensitivity. Please click here to view a larger version of this figure.
Subscription Required. Please recommend JoVE to your librarian.
Discussion
In this protocol a simple procedure for ERG recordings of larval zebrafish is detailed. This procedure allows for a quick and comprehensive assay of visual function.There are several critical steps throughout the procedure that should be kept in mind. The zebrafish larvae should be healthy before the experiment to prevent death during potential drug treatments and ensure prolonged livelihood during the ERG recordings. In addition, it is important that the larvae utilized in experiments are closely age-matched. This is due to the rapid development of the retina (i.e., the differential development of cone subtypes) and also the overall morphology and physiology of the larvae. For example, after 7 dpf the efficiency of epithelial transpiration decreases making it more difficult to keep the fish alive. Another important factor is the quality of the recording and reference electrodes. Care must be taken when pulling glass capillaries to prevent rough-edged tips. A micropipette microforge could be employed to fire-polish pulled electrodes and help to improve signal acquisition. Additionally, maintaining the quality of the Ag/AgCl electrodes is very important. After use, they must be rinsed with distilled water and air dried immediately. While darkening of the outer surface of electrodes can occur with time and not affect performance, tarnished (yellow to dark red) or pitted electrodes should be avoided. Avoid handling electrodes with bare hands, as protein contamination can adversely affect electrode behavior. Lastly, it should be noted that Ag/AgCl electrodes are photosensitive and can lead to flash artifacts if not protected. However, we have found these artifacts to be minimal (see legends to Figures 1 and 2) and do not interfere with our measurements of the larval zebrafish responses to flash stimuli. Alternatively, a salt bridge can be used to connect the Ag/AgCl electrode to the sponge via an agar salt bridge to move the electrode out of the light path. Although a salt bridge is used in direct current (DC) recordings to stabilize the electrode potential23, the ERG recording utilizes alternating current (AC). Therefore the only purpose of a salt bridge in this system would be if the particular setup has space constraints or particularly strong photovoltaic artifacts.
ERG has several advantages over other techniques to measure visual function. The primary advantage is that it is an in vivo recording. The disadvantage is that the activity of specific cells must be inferred from the waveform rather than directly measured, as would be the case for suction electrode or patch clamp recordings of photoreceptors and other cells in the retina. Normally, suction electrode recordings, patch clamp recordings and whole retina ERGs have the advantage that pharmacological agents can easily be introduced into cells to define the molecular components of the response, whereas this is more difficult in vivo using mammalian models. The permeability of the zebrafish larvae to such agents overcomes this disadvantage.
Analysis of dark-adapted larvae in the absence of pharmacological agents produces an ERG waveform dominated by the b-wave, a result that has been observed by a number of other groups2,9,24-26. We demonstrate the capability to isolate the cone mass receptor potential by taking advantage of the ability of pharmacological agents to penetrate larval zebrafish. Larvae treated with APB display an abrogation of the b-wave, allowing the “a-wave” to be visualized14-17. Waveforms with excellent signal to noise ratios were obtained by averaging 3 sweeps. Variation in the response waveforms is sometimes noted, but Makhankovet al.2 have reported that the variance in repeated measurements from the same animal is less than that seen between individuals. Therefore, the variance is likely to be the result of biological variation rather than variability in the technique.
We also utilized ERG analysis to examine cone recovery in vivo using a dual flash paradigm, similar to published results in the presence and absence of background illumination9,16. This was accomplished by measuring the ability of the larval retina to respond to successive flashes of varying ISI. When used in combination with pharmacological agents or genome engineering strategies such as TALENs to knock out pathway targets, the zebrafish is powerful system for the in vivo study of the molecular mechanics of cone adaptation and visual recovery.
Our procedure and equipment could easily be adapted to examine isolated larval eyes, older zebrafish or other vertebrates27,28. In fact, the ERG stimulation and recording system that we employ was principally designed for use in a clinical setting and then modified for experimentation on mice. Adapting the platform for zebrafish larvae was straightforward and could easily be replicated in other laboratories for low cost. Similar setups consisting of classical electrophysiological equipment could be constructed for minimal cost, and have been demonstrated to provide reliable results16. Overall, this technique is of great benefit to researchers studying the mechanisms of visual function.
Subscription Required. Please recommend JoVE to your librarian.
Disclosures
No conflicts of interest declared.
Acknowledgments
We thank members of the UNC Zebrafish Aquaculture facility for maintenance of the zebrafish. We would also like to thank Diagnosys, LLC for assistance with the setup of the ERG apparatus. Additional thanks go to Dr. Portia McCoy and the laboratory of Dr. Ben Philpot for assistance with electrophysiological methods. We also wish to thank Lizzy Griffiths for her illustration of a larval zebrafish. This work was supported by National Institutes of Health awards F32 EY022279 (to J.D.C) and R21 EY019758 (to E.R.W).
Materials
| Name | Company | Catalog Number | Comments |
| Faraday cage | 80/20 Inc | custom | Custom designed aluminum "Industrial Erector Set" for Cage framework |
| PVA sponge | Amazon | B000ZOWG1C | Provides a soft, moist platform for placement of zebrafish larvae |
| 150 ml Sterile Filter systems | Corning | 431154 | Filtering solutions to prevent small articulates from blocking micropipettes |
| Espion E2 | Diagnosys, LLC | contact | Modular electrophysiology system capable of generating visual stimuli for any stimulator and digital recording and analysis of responses using propietary software, more information at http://www.diagnosysllc.com |
| Colordome | Diagnosys, LLC | contact | Light stimulator with RGB LED and Xenon light sources for Ganzfeld ERG, more information at http://www.diagnosysllc.com |
| Micromanipulator | Drummond | 3-000-024-R | Holding and positioning the recording microelectrode |
| Magnetic ring stand | Drummond | 3-000-025-MB | Holding and positioning of the camera and refrence electrode |
| Lead extensions | Grass Technologies | F-LX | Spare female to male 1.5 mm lead cables for connecting electrodes |
| Male Pin to Female SAFELEAD Adaptor | Grass Technologies | DF-215/10 | Connecting 2 mm pins to 1.5 headboard pins |
| Window screen frame (metal) and spline | Lowes or Home Depot | various | For attaching copper mesh to Faraday cage framework |
| Steriflip 50 ml filters | Millipore | SCGP00525 | Filtering solutions to prevent small articulates from blocking micropipettes |
| BNC adaptor | Monoprice | 4127 | Connecting camera to BNC cable |
| BNC cable | Monoprice | 626 | Connecting camera to video adaptor |
| Camera lens | Navitar | 1582232 | Visualizing the positioning of the recording microelectrode onto the larval cornea |
| Camera coupler | Navitar | 1501149 | Visualizing the positioning of the recording microelectrode onto the larval cornea |
| Luna BNC to VGA + HDMI Converter | Sewell | SW-29297-PRO | BNC to VGA adaptor allowing camera image to project on computer monitor |
| APB | Sigma | A1910 | mGluR6 agonist, blocks b-wave allowing analysis of the isolated cone mass receptor potential |
| Borosilicate glass | Sutter | BF-150-86-10 | Fire- polished borosilicate glass (metling temperature = 821°C) with filament and dimensions of 1.5mm x 0.86 mm (outer diameter by inner diameter) |
| P97 Flaming/Brown puller | Sutter | P97 | For pulling glass micropipettes |
| Sorbothane sheet | Thorlabs | SB12A | Synthetic viscoelastic urethane polymer, placed under Passive Isolation Mounts and ERG platform to absorb shock and prevent slipping, can be cut to size |
| Breadboard | Thorlabs | B2436F | Vibration isolation platfrom for ERG stimulator and zebrafish specimen |
| Passive Isolation Mounts | Thorlabs | PWA074 | Provides vibration isolation to breadboard |
| Copper mesh | TWP | 022X022C0150W36T | To line Faraday Cage |
| Pipette pump | VWR | 53502-233 | Used with Pasteur pipettes to carefully transfer zebrafish larvae |
| Pasteur pipettes | VWR | 14672-608 | Used with Pipette pump to carefully transfer zebrafish larvae |
| Camera | Watec | WAT-902B | Visualizing the positioning of the recording microelectrode onto the larval cornea |
| Tricaine (MS-222) | Western Chemical | Tricaine-S | Pharmaceutical-grade anesthetic, |
| Micro-fil | WPI | MF28G-5 | Filling microelectrode holder and microelectrode glass |
| Microelectrode holder | WPI | MEH2SW15 | Holds glass microelectrode, connects to ERG equipment |
| Reference Electrode | WPI | DRIREF-5SH | Carefully break off last centimeter of casing to drain electrolyte and expose sintered Ag/AgCl pellet electrode |
| Reference Electrode (alternative) | WPI | EP1 | Alternative to DRIREF-5SH. Ag/AgCl electrode that must be wired/soldered to connecting lead |
| Low-noise cable for Microelectrode holder | WPI | 13620 | Connecting recording microelctrode holder to adaptor/headboard |
References
- Dowling, J. E. The retina: an approachable part of the brain. , Harvard University Press. Cambridge, MA. (1987).
- Makhankov, Y. V., Rinner, O., Neuhauss, S. C. An inexpensive device for non-invasive electroretinography in small aquatic vertebrates. J Neurosci. Methods. 135, 205-210 (2004).
- Wu, J., Peachey, N. S., Marmorstein, A. D. Light-evoked responses of the mouse retinal pigment epithelium. J Neurophysiol. 91, 1134-1142 (2004).
- Heckenlively, J. R., Arden, G. B. Principles and Practice of Clinical Electrophysiology of Vision. , 2nd edn, The MIT Press. Cambridge, MA. (2006).
- Perlman, I. Webvision: The Organization of the Retina and Visual System. Kolb, H., Nelson, R., Fernandez, E., Jones, B. , (1995).
- Fadool, J. M., Dowling, J. E. Zebrafish: a model system for the study of eye genetics. ProgRetin. Eye Res. 27, 89-110 (2008).
- Doerre, G., Malicki, J. Genetic analysis of photoreceptor cell development in the zebrafish retina. Mech. Dev. 110, 125-138 (2002).
- Brockerhoff, S. E., et al. Light stimulates a transducin-independent increase of cytoplasmic Ca2+ and suppression of current in cones from the zebrafish mutant nof. J Neurosci. 23, 470-480 (2003).
- Rinner, O., Makhankov, Y. V., Biehlmaier, O., Neuhauss, S. C. Knockdown of cone-specific kinase GRK7 in larval zebrafish leads to impaired cone response recovery and delayed dark adaptation. Neuron. 47, 231-242 (2005).
- Harada, T., Harada, C., Parada, L. F. Molecular regulation of visual system development: more than meets the eye. Genes Dev. 21, 367-378 (2007).
- Branchek, T. The development of photoreceptors in the zebrafish, brachydaniorerio. II. Function. J Comp Neurol. 224, 116-122 (1984).
- Schmitt, E. A., Dowling, J. E. Early retinal development in the zebrafish, Daniorerio: light and electron microscopic analyses. J Comp Neurol. 404, 515-536 (1999).
- Bilotta, J., Saszik, S., Sutherland, S. E. Rod contributions to the electroretinogram of the dark-adapted developing zebrafish. Dev Dyn. 222, 564-570 (2001).
- Wong, K. Y., Adolph, A. R., Dowling, J. E. Retinal bipolar cell input mechanisms in giant danio. I. Electroretinographic analysis. J Neurophysiol. 93, 84-93 (2005).
- Nelson, R. F., Singla, N. A spectral model for signal elements isolated from zebrafish photopicelectroretinogram. Vis Neurosci. 26, 349-363 (2009).
- Korenbrot, J. I., Mehta, M., Tserentsoodol, N., Postlethwait, J. H., Rebrik, T. I. EML1 (CNG-modulin) controls light sensitivity in darkness and under continuous illumination in zebrafish retinal cone photoreceptors. J Neurosci. 33, 17763-17776 (2013).
- Gurevich, L., Slaughter, M. M. Comparison of the waveforms of the ON bipolar neuron and the b-wave of the electroretinogram. Vision Res. 33, 2431-2435 (1993).
- Westerfield, M. The Zebrafish Book: A guide for the laboratory use of zebrafish (Daniorerio). , 5th edn, University of Oregon Press. Portland, OR. (2007).
- Kim, D. Y., Jung, C. S. Gap junction contributions to the goldfish electroretinogram at the photopic illumination level. Korean J PhysiolPharmacol. 16, 219-224 (2012).
- Brockerhoff, S. E., Dowling, J. E., Hurley, J. B. Zebrafish retinal mutants. Vision Res. 38, 1335-1339 (1998).
- Naka, K. I., Rushton, W. A. S-potentials from colour units in the retina of fish (Cyprinidae). J Physiol. 185, 536-555 (1966).
- Naka, K. I., Rushton, W. A. S-potentials from luminosity units in the retina of fish (Cyprinidae). J Physiol. 185, 587-599 (1966).
- Shao, X. M., Feldman, J. L. Micro-agar salt bridge in patch-clamp electrode holder stabilizes electrode potentials. J Neurosci. Methods. 159, 108-115 (2007).
- Brockerhoff, S. E., et al. A behavioral screen for isolating zebrafish mutants with visual system defects. ProcNatlAcadSci. U S A. 92, 10545-10549 (1995).
- Fleisch, V. C., Jametti, T., Neuhauss, S. C. Electroretinogram (ERG) Measurements in Larval Zebrafish. CSH protocols. , (2008).
- Seeliger, M. W., Rilk, A., Neuhauss, S. C. Ganzfeld ERG in zebrafish larvae. Doc Ophthalmol. 104, 57-68 (2002).
- Kainz, P. M., Adolph, A. R., Wong, K. Y., Dowling, J. E. Lazy eyes zebrafish mutation affects Müller glial cells, compromising photoreceptor function and causing partial blindness. J Comp Neurol. 463, 265-280 (2003).
- Lewis, A., et al. Celsr3 is required for normal development of GABA circuits in the inner retina. PLoS. genetics. 7, e1002239 (2011).
