

Summary
MALT1 regulates innate immunity but how this occurs remains ill-defined. We used the selective MALT1 paracaspase inhibitor MLT-827 to unravel the contribution of MALT1 to innate signaling downstream of Toll-like or C-type lectin-like receptors, demonstrating that MALT1 regulates the production of myeloid cytokines, and downstream of C-type lectin-like receptors, selectively.
Abstract
Besides its function in lymphoid cells, which has been addressed by numerous studies, the paracaspase MALT1 also plays an important role in innate cells downstream of pattern recognition receptors. Best studied are the Dectin-1 and Dectin-2 members of the C-type lectin-like receptor family that induce a SYK- and CARD9-dependent signaling cascade leading to NF-κB activation, in a MALT1-dependent manner. By contrast, Toll-like receptors (TLR), such as TLR-4, propagate NF-κB activation but signal via an MYD88/IRAK-dependent cascade. Nonetheless, whether MALT1 might contribute to TLR-4 signaling has remained unclear. Recent evidence with MLT-827, a potent and selective inhibitor of MALT1 paracaspase activity, indicates that TNF- production downstream of TLR-4 in human myeloid cells is independent of MALT1, as opposed to TNF- production downstream of Dectin-1, which is MALT1 dependent. Here, we addressed the selective involvement of MALT1 in pattern recognition sensing further, using a variety of human and mouse cellular preparations, and stimulation of Dectin-1, MINCLE or TLR-4 pathways. We also provided additional insights by exploring cytokines beyond TNF-, and by comparing MLT-827 to a SYK inhibitor (Cpd11) and to an IKK inhibitor (AFN700). Collectively, the data provided further evidence for the MALT1-dependency of C-type lectin-like receptor —signaling by contrast to TLR-signaling.
Introduction
The paracaspase activity of MALT1 (Mucosa-associated lymphoid tissue lymphoma translocation protein 1) was revealed in 20081,2. Since then, a number of studies have reported its critical contribution to antigen receptor responses in lymphocytes. Genetic models in the mouse as well as pharmacology data support a key role in T cells, in T-cell dependent autoimmunity and in B-cell lymphoma settings3,4. In lymphocytes, MALT1 paracaspase activation occurs upon assembly of a CARD11-BCL10-MALT1 complex5, which is triggered by antigen-receptor proximal signaling downstream of the T- or B- cell receptor. There is also ample evidence that a similar CARD9-BCL10-MALT1 complex is important for propagating signals downstream of C-type lectin-like receptors (CLLR), e.g., Dectin-1, Dectin-2 and MINCLE in myeloid cells6,7. Dectin-1 has been particularly well studied because this pathway is critical for host defense against fungal infections8,9. Implication of MALT1 in Toll-like receptor (TLR) pathways, however, has remained controversial10. Recent evidence in human myeloid cells ruled out a direct role for MALT1 paracaspase activity in the regulation of TNF- production downstream of TLR-411.
In the present work, we used various experimental settings and stimulatory conditions in human and mouse myeloid cells to probe innate signaling pathways, relying on specific pharmacological tool inhibitors and measurement of cytokine production.
Subscription Required. Please recommend JoVE to your librarian.
Protocol
Experiments were conducted according to the guidelines and standards of the Novartis Human Research Ethics Committee.
1. Preparation of Peripheral Blood Mononuclear Cells (PBMCs) from Human Buffy Coats
NOTE: We received buffy coats from healthy volunteers one day after collection, in 50 mL bags. They were provided under informed consent and collected through the Interregionale Blutspende Schweizeriches Rotes Kreuz. We handled them using the procedure below, at room temperature unless specified otherwise.
- Prepare a sterile and clean pair of scissors and a 1 L beaker with a plastic bag (under a lamina flow).
- Transfer the buffy coat into the beaker and carefully open it with the scissors.
- Using a 25 mL pipette, add 100 mL of phosphate-buffered saline buffer/ethylenediaminetetraacetic acid (PBS/EDTA: PBS 1x pH 7.4 containing no CaCl2 and no MgCl2, supplemented with 2 mM EDTA pH 8.0).
NOTE: Using the same pipette and after slowly pipetting the solution up and down, dispense 25 mL of the diluted buffy coat into 6 conical centrifuge tubes of 50 mL pre-filled with 15 mL of polysaccharide-based density gradient. - Centrifuge 20 min at 800 x g with moderate acceleration (set at 4 out of 9) and without brake to allow for separation of cells based on their densities.
NOTE: After centrifugation, three layers will be visible; a pellet containing red blood cells and granulocytes, an upper layer made of plasma, and in between a white ring containing peripheral blood mononuclear cells (PBMCs). - Harvest the PBMC ring using a 10 mL pipette and transfer to new 50 mL tubes.
NOTE: Two to three 50 mL tubes are normally required per buffy coat. At this stage, some plasma likely contaminates the collected PBMCs, which should have no impact on the subsequent enrichment steps. - Top up to 50 mL every tube using PBS/EDTA and proceed to three successive washes with decreasing centrifugation time and speed (15 min at 520 x g, 10 min at 330 x g, 8 min at 150 x g).
NOTE: At each step, the supernatant is poured off in a liquid waste container and the cell pellet is resuspended in 50 mL of PBS/EDTA (pellets may be pooled after the first wash). - After the final wash, resuspend the pellet in 25 mL of an ice-cold lysis buffer (see Table of Materials) to lyse the red blood cells by osmotic pressure.
- Incubate until the solution becomes clear (≤5 min at room temperature).
- Stop the reaction by adding 25 mL of separation buffer (PBS 1x pH 7.4 containing no CaCl2 and no MgCl2, supplemented with 2% heat-inactivated fetal bovine serum (FBS) and 1 mM EDTA pH 8.0).
- Wash one more time at 150 x g for 8 min.
NOTE: At this stage PBMCs can be used as a bulk population (see step 3: PBMCs and monocytes treatments and stimulatory conditions) or processed for monocyte enrichment (see step 2: Preparation of monocytes from PBMCs), or frozen down for subsequent use (see step 5: Monocytes and PBMCs freezing/thawing procedures).
2. Preparation of Monocytes from PBMCs
- Resuspend the PBMCs obtained at step 1.10 in separation buffer and count them to reach 5 x 10⁷cells/mL.
- Transfer the cell suspension into a 14 mL conical centrifuge tube with cap.
- Add 50 µL of monocyte enrichment antibody cocktail per mL of cell suspension, vortex, and incubate 10 min at 4 °C.
- Add 50 µL of monocyte enrichment beads per mL of cells.
NOTE: The beads must be thoroughly vortexed to ensure homogeneity of the suspension. - After adding the beads, shortly vortex the cell suspension and incubate 5 min at 4 °C.
- Rinse the upper part of the tube with separation buffer until the tube is filled up to 10 mL.
- Slowly mix the solution by pipetting up and down.
- Place the tube without cap into a separation magnet.
- Incubate for 2.5 min at room temperature.
- Pour slowly into a 15 mL conical centrifuge tube.
- At this stage, use monocytes directly (see step 3: PBMCs and monocytes treatments and stimulatory conditions) or differentiate them into immature Monocyte-derived Dendritic Cells (iMoDCs) (see step 4), or freeze them down for subsequent use (see step 5).
3. PBMCs and Monocytes Treatments and Stimulatory Conditions
- Count cells and dilute them in culture medium (Roswell Park Memorial Institute medium (RPMI) 10% FBS + 1 mM Sodium Pyruvate + 100 U/mL Penicillin Streptomycin (Pen/Strep) + 5 µM β-mercaptoethanol), down to 1.25 x 10⁴ cells/well.
- Distribute 30 µL of cell suspension per well of a 384-well plate.
- Add 15 µL of 4x concentrated compound solutions and pre-incubate for 1 h at 37 °C, 5% CO2.
- Add lipopolysaccharide (LPS) to a final concentration of 10 ng/mL, or depleted zymosan (DZ) to a final concentration of 100 µg/mL, or keep in plain medium.
- Incubate overnight at 37 °C, 5% CO2.
- Take 10 µL of the supernatant to measure secreted TNF-a levels (see step 7: Cytokines and viability measurements).
4. Monocytes Differentiation into iMoDCs and Stimulatory Conditions
- Count monocytes (enriched at step 2) and centrifuge the cell suspension at 520 x g for 5 min.
- Pipette off the supernatant and add culture medium (RPMI+ 10% FBS to obtain a final cell suspension of 0.4 x 10⁶ cells/mL.
- Add 80 ng/mL recombinant human IL-4 + 100 ng/mL GM-CSF.
- Dispense 5 mL of cell suspension per well in a 6-well plate.
- Incubate for 7 days at 37 °C, 5% CO2.
- At day 7, harvest cells by pipetting gently to avoid their activation.
- Centrifuge at 520 x g for 5 min.
- Vacuum aspirate and resuspend in 50 mL of culture medium without growth factors.
- Centrifuge at 520 x g for 5 min and resuspend at 1 x 10⁶ cells/mL in culture medium.
- Dispense 100 µL of cell suspension (105 cells) per well of a 96-well flat bottom plate.
- Pre-incubate for 1 h at 37 °C after adding 50 µL of 4x concentrated compound solutions, prepared as described at step 8: Compounds preparation.
- Add 50 µL of stimuli (4x concentrated), prepared as described at step 9.
- Incubate 24 h at 37 °C.
- Mix each well and transfer cells and supernatant (SN) into a 96-well V-bottom plate.
- Spin down at 475 x g for 5 min.
- Transfer supernatant into a new 96-well flat bottom plate, seal and freeze at -20 °C until further use.
5. Monocytes and PBMCs Freezing/Thawing Procedures
- Freezing
- Spin down PBMC or monocyte cell preparations at 520 x g for 5 min.
- Vacuum aspirate the supernatant and resuspend cells in freezing medium at 1 x 10⁷ cells/mL.
- Dispense 1 mL of cell suspension into cryotubes, transfer the tubes to a specific cooling device (see Materials table) and place it at -80 °C.
- Thawing
- Thaw the cryotube and quickly transfer its content into a 15 mL conical centrifuge tube containing 9 mL of culture medium.
- Centrifuge at 520 x g for 5 min.
- Vacuum aspirate supernatant and resuspend cell pellet in 5 mL of culture medium. Cells are now ready for further experimental processing.
6. Mouse Spleen Cells Preparation and Treatment
NOTE: We conducted animal sacrifices according to the guidelines and standards of the Novartis Animal Welfare Organization. Studies were approved by the Ethics Committee of the regional governmental authority (Kantonales Veterinäramt der Stadt Basel). We sacrificed animals by isoflurane over-exposure, with all efforts made to minimize suffering.
- Harvest the spleen and dissociate tissue using a tube equipped with a mechanical tissue grinder device and filled with 5 mL of cold RPMI medium.
- Use the spleen program of the dissociation machine to grind organs.
- Filter the cells through a 100 mm nylon cell strainer.
- Transfer the suspension into 50 mL tubes and centrifuge at 4 °C for 10 min at 320 x g.
- Vacuum aspirate the supernatant, resuspend the cell pellet in 3 mL of ice-cold lysis buffer, and incubate for ≤2 min on ice.
- Stop lysis by adding 7 mL of RPMI medium.
- Filter again through a 100 µm nylon cell strainer.
- Spin down cell suspension at 330 x g for 10 min at 4 °C.
- Vacuum aspirate supernatant and resuspend cells at 11 x 106 cells/mL in complete medium (RPMI supplemented with 10% FBS, 100 U/mL Pen/Step and 5 µM β-Mercaptoethanol).
- Plate 1 x 10⁶ cells/well (90 µL) in a 96-well plate (flat bottom).
- Add 5 µL of 20x concentrated compound solution previously diluted in RPMI medium as described in step 8.3: Serial dilution for murine spleen cells.
- Incubate for 30 min at 37 °C, 5% CO2.
- Add 5 µL of 20x concentrated DZ (final concentration 30 µg/mL) or 20x concentrated LPS + IFN-g (TLR-4) (final concentration 1 µM LPS and 10 ng/mL IFN-g).
- Incubate overnight at 37 °C, 5% CO2.
- Centrifuge at 330 x g for 10 min.
- Transfer supernatants in new plates, seal and freeze at -20 °C until further use.
7. Cytokines and Viability Measurements
- Human TNF-a measurement by HTRF (Homogenous Time Resolved Fluorescence)
NOTE: The protocol followed the supplier’s recommendations, briefly summarized below.- Mix 1 volume of reconstituted reagent (anti TNF-a-cryptate and anti-TNF-a-XL665) with 19 volumes of reconstitution buffer (50 mM phosphate buffer pH 7.0, 0.8 M potassium fluoride (KF), 0.2% bovine serum albumin (BSA)).
- Mix the two ready-to-use antibody solutions 1:1 just prior to dispensing the reagents.
- Dispense 10 µL of supernatants from step 3.6 into white 384-well plates.
- Dispense 10 µL of the antibody mix.
- Cover the plate with a sealer and incubate at 4 °C overnight.
- Read plate on a microplate reader (50–200 flash).
- Human IL-23 measurement by HTRF (Homogenous Time Resolved Fluorescence)
NOTE: The protocol followed the supplier’s recommendations, briefly summarized below.- Mix one volume of reconstituted reagent (anti IL-23-cryptate-antibody and anti-IL-23 D2-antibody) with 19 volumes of detection buffer #3.
- Mix the two ready-to-use antibody solutions 1:1 just prior to dispensing the reagents.
- Dispense 10 µL of supernatants from step 3.6 into white 384-well plates.
- Dispense 10 µL of the antibody mix.
- Cover the plate with a sealer and incubate at 4 °C overnight.
- Read plate on a microplate reader (50–200 nm flash).
- Human IL-6, IL-8, IL-1β and TNF-α measurements by electrochemiluminescence
NOTE: All samples were diluted at 1/150 in diluent 2 (first dilution: 10 µL in 150 µL, then 20 µL in 180 µL). The protocol followed the supplier’s recommendations:- Dilute samples and standard in diluent 2.
- Proceed to dilution of the standard in diluent 2 using a 1/4 serial fold dilution.
- Wash plates three times with wash buffer.
- Dispense 50 µL of samples or standard per well.
- Incubate for 2 h at room temperature under agitation.
- Wash the plate four times with PBS + 0.05% Polysorbate 20.
- Add 25 µL of detection antibody (60 µL of each antibody for 3 mL final) in diluent 3.
- Incubate for 2 h at room temperature under agitation.
- Wash the plate four times with PBS + 0.05% Polysorbate 20.
- Avoiding bubbles, add 150 µL per well of read buffer (Tris-based buffer containing tripropylamine, diluted 2x in ddH20) as a co-reactant for light generation in electrochemiluminescence immunoassays.
- Read the plate (without delay) on a multiplex plate reader.
- Mouse TNF-a measurement by ELISA following the supplier’s protocol
- Dilute supernatant 1:1 in assay diluent (ready to use protein-containing buffer).
- Prepare reagents, samples, and standard dilutions as described in the kit. Add 50 μL of assay diluent to each well.
- Add 50 μL of standard, control, or sample per well.
- Mix by gently tapping the plate frame for 1 min.
- Cover with the provided adhesive strip and incubate for 2 h at room temperature.
- Aspirate each well and wash with 400 μL/well (repeat this step five times in total).
- After the final wash, remove any remaining wash buffer by aspirating.
- Invert the plate and blot against clean paper towels.
- Add 100 μL of mouse TNF-α conjugate to each well. Cover with a new adhesive strip.
- Incubate for 2 h at room temperature.
- Repeat the aspiration/wash as in step 7.4.4.
- Add 100 μL of substrate solution to each well and incubate for 30 min at room temperature protected from light.
- Add 100 μL of diluted hydrochloric acid solution (stop solution) to each well. Gently tap the plate to ensure thorough mixing.
- Measure the optical density at 450 nm (with the correction wavelength set at 560 nm) using a microplate reader (to be done within 30 min).
- Dilute supernatant 1:1 in assay diluent (ready to use protein-containing buffer).
- Cell viability
- After removing supernatants from PBMC or monocyte preparations, assess cell viability using a ready to use resazurin solution (oxidation-reduction indicator) added directly to the cell suspension to 10% final concentration.
- Incubate for 1 to 2 h at 37 °C, 5% CO2.
- Read fluorescence at 590 nm (Excitation 540 nm) using a microplate reader.
8. Compound Preparation
- Serial dilution for iMoDCs
- Dilute the MLT-827 stock solution (10 mM in dimethyl sulfoxide (DMSO) into medium to reach 8 µM in one go (4x concentrated).
- Perform a six-step 1:5 serial dilution, using medium + 0.08% DMSO. Use the same medium + 0.08% DMSO solution for the vehicle (no compound) condition.
- Single dose testing for iMoDCs
- Dilute the MLT-827, AFN700 and Cpd11 stock solutions into medium to reach 4 µM in one go (4x concentrated).
- Serial dilution for murine spleen cells
- Dilute a 10 µM MLT-827 solution (obtained from a 10 mM stock solution following a one go dilution in medium) to 0.01 µM, with a DMSO end concentration of 0.1%.
- For the dilution steps, take 2 µL of each dilution, add 38 µL RPMI, and pipet 5 µL into the well.
NOTE: All treatments are performed in triplicate.
9. Stimuli Preparation
- Depleted zymosan (DZ)
- Add 2 mL of sterile endotoxin-free water to 10 mg of DZ.
- Vortex to homogenize the stock solution, vortex also prior each use.
- Aliquot solution and store aliquots at -20 °C.
- Trehalose-6,6-dibehenate (TDB)
- Add 100 µL of DMSO to 1 mg TDB, heat at 60 °C in a water bath for 15–30 s.
- Vortex and immediately add 900 µL of sterile PBS, vortex again.
- Heat for 10–15 min at 60 °C and homogenize by vortexing prior each use.
- Keep the solution at 4 °C.
- Perform serial dilutions and single dose preparation as for the MLT-827 compound.
NOTE: Because TDB needs to be prepared in DMSO, a final 1% DMSO concentration is present during cell stimulation.
Subscription Required. Please recommend JoVE to your librarian.
Representative Results
In myeloid cells, MALT1 relays activation signals downstream of several C-type lectin-like receptors, such as Dectin-1, Dectin-2 and MINCLE6. These pathways rely on (hem)ITAM motif-containing receptors (e.g., Dectin-1) or ITAM motif-containing co-receptors (e.g., FcRγ, for Dectin-2 and MINCLE) that recruit and activate the SYK kinase (Figure 1). This leads to activation of a protein kinase C isoform, namely PKCδ, which phosphorylates CARD9, thereby triggering CARD9/BCL10/MALT1 complex formation and recruitment of TRAF6 for downstream NF-κB activation12. By contrast, the TLR-4 pathway recruits TRAF6 in a MALT1-independent but MYD88/IRAK-dependent manner for NF-κB activation (Figure 1). Evidence for this differential involvement of MALT1 was obtained using genetic models of MALT1 deficiency as well as pharmacological treatment with the peptidic active-site inhibitor z-VRPR-fmk11,13,14.
We used the recently reported potent and selective MALT1 inhibitor MLT-82715 and asked if this compound would regulate TNF- production downstream of C type lectin-like and Toll-like receptors, respectively. Human PBMCs and mouse spleen cells were stimulated with depleted zymosan (DZ, a known agonist of Dectin-1) or lipopolysaccharide (LPS, a known agonist of TLR-4) and we measured TNF- release in the culture supernatant after 20 h. In both the human and the mouse assays, MLT-827 selectively blocked TNF- production driven by the Dectin-1 pathway, but not by the TLR-4 pathway (Figure 2). We obtained similar data upon incubation with the z-VRPR-fmk compound (Supplementary Figure 1).
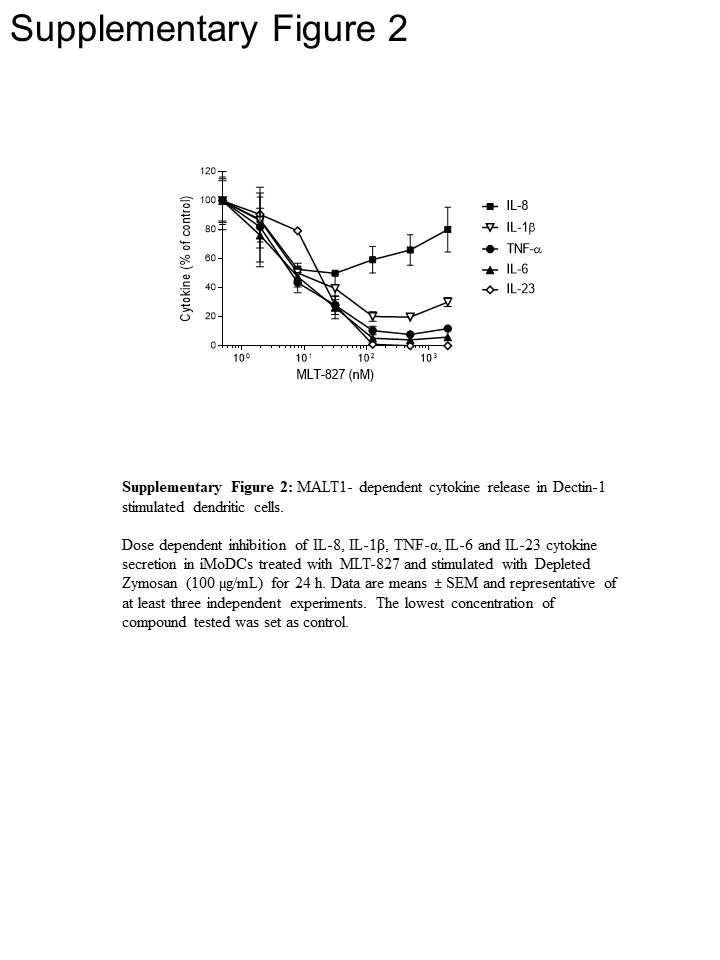
To gain pathway insights, we conducted further experiments in human monocytes and in immature monocytes-derived dendritic cells (iMoDCs), comparing the effect of MLT-827 to that of the SYK inhibitor Cpd1116 and to that of the IKK inhibitor AFN70015. In monocytes stimulated with LPS, production of TNF-α was almost completely abrogated by AFN700 but was not sensitive to Cpd11 (Figure 3A), which is consistent with the dependency/independency of the TLR-4 pathway on NF-κB/SYK activity, respectively (see Figure 1). By contrast, TNF-α production driven by Dectin-1 in iMoDCs displayed sensitivity to Cpd11 in addition to sensitivity to MLT-827 and AFN700 (Figure 3B, Supplementary Figure 2), providing further evidence for involvement of a SYK/CBM signaling cascade in the Dectin-1 pathway (Figure 1). Noteworthy, production of IL-1, IL-6 and IL-23 upon Dectin-1 stimulation was also sensitive to the three inhibitors, thereby indicating regulatory mechanisms similar to TNF-. However, a limited effect of the three compounds on IL-8 production suggested a distinct regulatory mechanism for this cytokine (Figure 3B, Supplementary Figure 2).
In addition to Dectin-1, other CLLRs, such as Dectin-2 and MINCLE, function via stimulation of a CARD9 signalosome7. We therefore tested MLT-827 in iMoDCs challenged with the MINCLE agonist Trehalose-6,6-dibehenate (TBD). Raising TBD concentrations above 50 µg/mL led to production of TNF-, IL-6 and IL-1, which relied on MALT1 paracaspase activity as seen from the blocking effect of MLT-827 (Figure 4A). Consistent results were obtained when challenging iMoDCs with increasing concentrations of DZ to stimulate Dectin-1 (Figure 4B).
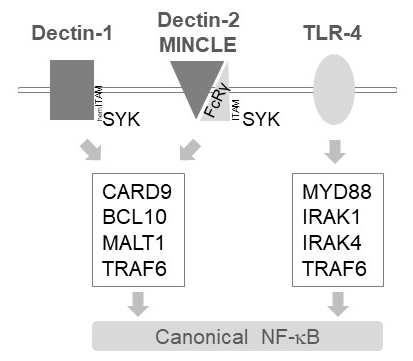
Figure 1: NF-κB signaling downstream of Dectin-1, MINCLE and TLR-4. The cartoon depicts the key features of canonical NF-κB activation pathways downstream of Dectin-1, Dectin-2, MINCLE or TLR-4 in myeloid cells. The hemITAM-containing Dectin-1 receptor17 can directly engage SYK to stimulate CBM (CARD9/BCL10/MALT1) complex formation, leading to TRAF6 dependent NF-κB activation. Other C-type Lectin-like receptors such as Dectin-2 or MINCLE need to recruit an ITAM-containing FcRγ chain to engage a CBM and activate NF-κB. TLR-4 receptors use another mechanism for NF-κB activation, relying on MYD88 and IRAK1/IRAK4 kinases upstream of TRAF6.

Figure 2: Dectin-1 signals via MALT1 for production of TNF-α in human and mouse cells. (A) Human PBMCs data as in Unterreiner et al., 2017 (Figure 2A)11. Human PBMCs were stimulated with 1 ng/mL of LPS (TLR-4 agonist) or 100 µg/mL DZ (Dectin-1 agonist) for 20 h in the presence of graded concentrations of MLT-827. TNF- released in the supernatant was quantified by HTRF. (B) Mouse spleen cells were treated with a concentration range of MLT-827 for 30 min and subsequently stimulated with 30 µg/mL DZ or 1 µg/mL LPS + 10 ng/mL IFN- for 18 h. TNF-α in the cell culture supernatant was measured by ELISA. One of two experiments with similar results is shown, as means ± SEM of three measurements.

Figure 3: IKK- and/or SYK-dependency of cytokine production downstream of TLR-4 and Dectin-1. (A) Human monocytes were pre-treated for 1 h with MLT-827 (1 µM), Cpd11 (1 µM), or AFN700 (3 µM) or vehicle (DMSO). Cells were stimulated with 10 ng/mL LPS for 20 h and TNF- in the supernatant was quantified by HTRF. (B) TNF-α, IL-1β, IL-6, IL-23 and IL-8 production by human monocytes-derived dendritic cells (iMoDCs) stimulated for 24 h with DZ (100 µg/mL) after 1 h pre-incubation with MLT-827, Cpd11, AFN700 (all at 1 µM) or DMSO. Cytokine levels in DMSO-treated samples were set at 100%. Data are means ± SD of three measurements, and are representative of three independent experiments. *P < 0.05; **P < 0.01; ***P < 0.001, unpaired two-tailed Student's t test.

Figure 4: C type lectin-like-dependent cytokine production by iMoDCs. TNF-α, IL-1β, and IL-6 production by iMoDCs stimulated for 24 h with the MINCLE agonist Trehalose-6,6-dibehenate (TDB, 100 µg/mL) (A) or with the Dectin-1 agonist DZ (100 µg/mL) (B) after 1 h pre-incubation with MLT-827 (1 µM) or DMSO. Data are means ± SD of three measurements and are representative of three independent experiments.
Supplemental File 1. Please click here to download this file.
Supplemental File 2. Please click here to download this file.
Supplemental File 3. Please click here to download this file.
Subscription Required. Please recommend JoVE to your librarian.
Discussion
In this work, we used simple experimental settings to study signaling pathways in human and mouse innate cells, and interrogate their dependency on MALT1 proteolytic function. Expanding on previous work11, our study showed that MALT1 paracaspase activity controls C-type lectin-like receptor induced cytokine production, including TNF-α. In contrast, TLR-4-induced TNF-α was independent of MALT1 in both species. Collectively, these data corroborated the key and selective contribution of the MALT1/CBM signalosome downstream of C-type lectin-like receptors, which was unveiled by earlier studies6,12,18.
Whether the clear independency of TLR-4 signaling on MALT1 in myeloid cells applies to other cell types remains to be explored. For instance, in B-lymphocytes, TLR signaling was previously shown to contribute to B-cell activation downstream of the B-cell antigen receptor19. In fact, we have unpublished evidence that TLR-4 stimulated human and mouse B cells display sensitivity to MLT-827. Therefore, further mechanistic insights downstream of the B-cell receptor will be valuable. In this context, a recent study in B cell lymphoma provided evidence for clustering of the signaling pathways downstream of the B-cell receptor and the TLR9 receptor20. TRAF6, which acts as a mediator for NF-κB activation in both the B-cell receptor and the TLR pathways, might be a point of crosstalk, which could explain the sensitivity of both pathways to MALT1 protease inhibition. Conversely, TRAF6 is also a common downstream player of CLLRs and TLRs for induction of NF-κB but these two pathways do not appear to crosstalk in a MALT1 paracaspase-dependent manner in myeloid cells.
This work focused on cytokine production, which provides an easy readout for signaling pathways and can be implemented readily for compound profiling. It highlighted the value of selective and potent inhibitors of MALT1 for unravelling MALT1 biology. Obtaining further mechanistic insights will require additional work and development of more proximal assays, e.g., to characterize the substrates of MALT1 involved in innate signaling regulation.
Subscription Required. Please recommend JoVE to your librarian.
Disclosures
The authors have nothing to disclose.
Acknowledgments
We thank Elsevier for their authorization (license number 4334770630127) to reproduce here Figure 2A from Unterreiner et al. (2017).
Materials
| Name | Company | Catalog Number | Comments |
| 100 µm nylon cell strainer | Sigma | CLS431752 | |
| 14 mL Falcon tube | BD Falcon | 352057 | |
| 15 mL Falcon tube | Falcon | 352090 | |
| 50 mL Falcon tube | Falcon | 352070 | |
| 6 well plates | Costar | 3516 | |
| 96 well flat-bottom plate, with low evaporation lid | Costar | 3595 | |
| 96 well V-bottom plate | Costar | 734-1798 | |
| Ammonium Chloride - NH4Cl | Sigma | A9434 | |
| Assay diluent RD1-W ELISA | R&D | 895038 | Assay diluent |
| Cell culture microplate, 384 well, black | Greiner | 781986 | |
| Depleted Zymosan | Invivogen | tlrl-dzn | now: tlrl-zyd |
| Dimethyl sulfoxide | Sigma | D2650 | DMSO |
| EDTA-Na2 | Sigma | E5134 | Ethylenediaminetetraacetic acid disodium salt dihydrate |
| ELISA muTNF-α | R&D | SMTA00 | |
| Ficoll-Paque Plus | GE Healthcare | 17-1440-03 | |
| gentleMACS C tubes | MACS Miltenyi Biotec | 130-096-334 | |
| gentleMACS dissociator | MACS Miltenyi Biotec | 130-093-235 | |
| GM-CSF | Novartis | - | |
| Heat-inactivated Fetal bovine serum | Gibco | 10082 | FBS |
| HTRF hu IL-23 | CisBio | 62HIL23PEG | |
| HTRF hu TNF-α | CisBio | 62TNFPEC | |
| HTRF reconstitution buffer | CisBio | 62RB3RDE | 50mM Phosphate buffer, pH 7.0, 0.8M KF, 0.2% BSA |
| IFN-γ | R&D | L4516 | |
| IL-4 | Novartis | - | |
| Isoflurane | Abbott | Forene | |
| Lipopolysaccharides (LPS) | Sigma | L4391 | LPS used in human samples |
| Lipopolysaccharides | Sigma | L4516 | LPS used in murine samples |
| Lysis buffer | Self-made | - | 155 mM NH4Cl, 10 mM KHCO3, 1 mM EDTA, pH 7.4 |
| Magnet | Stemcell | 18001 | |
| Microplate, 384 well white | Greiner | 784075 | |
| Monocytes enrichment kit | Stemcell | 19059 | |
| Nalgene Mr. Frosty Cryo 1°C Freezing Container | Nalgene | 5100-0001 | cooling device (containing Propanol-2) |
| PBS 1x pH 7.4 [-] CaCl2 [-] MgCl2 | Gibco | 10010 | Phosphate-buffered saline |
| Penicillin/Streptomycin | Gibco | 15140 | Pen/Strep |
| Potassium bicarbonate - KHCO3 | Sigma | P9144 | |
| PrestoBlue | Invitrogen | A13262 | Resazurin solution for viability assessment |
| Propanol-2 | Merck | 1.09634 | |
| Read buffer | MesoScale Discovery | R92TC-3 | Tris-based buffer containing tripropylamine |
| Recovery cell culture freezing medium | Gibco | 12648-010 | freezing medium |
| Roswell Park Memorial Institute Medium (RPMI) with Glutamax | Gibco | 61870 | + 10% FBS for iMoDCs + 10% FBS + 1 mM Sodium Pyruvate + 100 U/mL Pen/Strep + 5 µM β-mercaptoethanol for human PBMCs and monocytes + 10% FBS + Pen/Strep + 5 µM β-mercaptoethanol for murine splenocytes |
| Separation buffer | Self-made | - | PBS pH 7.4 + 2% FBS + 1 mM EDTA pH 8.0 |
| Sodium Pyruvate | Gibco | 11360 | |
| Trehalose-6,6-dibehenate | Invivogen | tlrl-tdb | TDB |
| Tween 20 | Sigma | P7949 | Polysorbate 20 |
| UltraPure 0.5 M EDTA pH 8.0 | Invitrogen | 15675 | Ethylenediaminetetraacetic acid |
| Viewseal sealer | Greiner BioOne | 676070 | |
| V-PLEX Proinflammatory Panel 1 Human Kit | MesoScale Discovery | K15049D | electrochemiluminescent multiplex assay (IL-1β, TNF-α, IL-6, IL-8) |
| β-Mercaptoethanol | Gibco | 31350 |
References
- Coornaert, B., et al. T cell antigen receptor stimulation induces MALT1 paracaspase-mediated cleavage of the NF-kappaB inhibitor A20. Nature immunology. 9 (3), 263-271 (2008).
- Rebeaud, F., et al. The proteolytic activity of the paracaspase MALT1 is key in T cell activation. Nature immunology. 9 (3), 272-281 (2008).
- Jaworski, M., Thome, M. The paracaspase MALT1: Biological function and potential for therapeutic inhibition. Cellular and Molecular Life Sciences. 73 (3), 459-473 (2016).
- Meininger, I., Krappmann, D. Lymphocyte signaling and activation by the CARMA1-BCL10-MALT1 signalosome. Biological Chemistry. 397 (12), 1315-1333 (2016).
- Qiao, Q., et al. Structural architecture of the CARMA1/Bcl10/MALT1 signalosome: nucleation-induced filamentous assembly. Molecular cell. 51 (6), 766-779 (2013).
- Gross, O., et al. Card9 controls a non-TLR signalling pathway for innate anti-fungal immunity. Nature. 442 (7103), 651-656 (2006).
- Chiffoleau, E. C-type lectin-like receptors as emerging orchestrators of sterile inflammation represent potential therapeutic targets. Frontiers in Immunology. 9 (FEB), 1-9 (2018).
- Taylor, P. R., et al. Dectin-1 is required for beta-glucan recognition and control of fungal infection. Nature Immunology. 8 (1), 31-38 (2007).
- Lanternier, F., et al. Primary immunodeficiencies underlying fungal infections. Current opinion in pediatrics. 25 (6), 736-747 (2013).
- Thome, M. Multifunctional roles for MALT1 in T-cell activation. Nature reviews. Immunology. 8 (7), 495-500 (2008).
- Unterreiner, A., Stoehr, N., Huppertz, C., Calzascia, T., Farady, C. J., Bornancin, F. Selective MALT1 paracaspase inhibition does not block TNF-α production downstream of TLR-4 in myeloid cells. Immunology Letters. , 48-51 (2017).
- Strasser, D., et al. Syk Kinase-Coupled C-type Lectin Receptors Engage Protein Kinase C-δ to Elicit Card9 Adaptor-Mediated Innate Immunity. Immunity. 36 (1), 32-42 (2012).
- Jaworski, M., et al. Malt1 protease inactivation efficiently dampens immune responses but causes spontaneous autoimmunity. The EMBO journal. 33 (23), 2765-2781 (2014).
- Yu, J. W., et al. MALT1 protease activity is required for innate and adaptive immune responses. PLoS ONE. 10 (5), 1-20 (2015).
- Bardet, M., et al. The T-cell fingerprint of MALT1 paracaspase revealed by selective inhibition. Immunology and Cell Biology. 96 (1), 81-99 (2018).
- Thoma, G., et al. Discovery and profiling of a selective and efficacious syk inhibitor. Journal of Medicinal Chemistry. 58 (4), 1950-1963 (2015).
- Bauer, B., Steinle, A. HemITAM: A single tyrosine motif that packs a punch. Science Signaling. 10 (508), 1-10 (2017).
- Gringhuis, S. I., et al. Selective c-Rel activation via Malt1 controls anti-fungal TH-17 immunity by dectin-1 and dectin-2. PLoS Pathogens. 7 (1), (2011).
- Dufner, A., Schamel, W. W. B cell antigen receptor-induced activation of an IRAK4-dependent signaling pathway revealed by a MALT1-IRAK4 double knockout mouse model. Cell Communication and Signaling. 9 (1), 6 (2011).
- Phelan, J. D., et al. A multiprotein supercomplex controlling oncogenic signalling in lymphoma. Nature. , In press (2018).
