

Summary
Time-of-flight secondary ion mass spectrometry is applied to demonstrate the chemical mapping and corrosion morphology at the metal-paint interface of an aluminum alloy after being exposed to a salt solution compared with a specimen exposed to air.
Abstract
Corrosion developed at the paint and aluminum (Al) metal-paint interface of an aluminum alloy is analyzed using time-of-flight secondary ion mass spectrometry (ToF-SIMS), illustrating that SIMS is a suitable technique to study the chemical distribution at a metal-paint interface. The painted Al alloy coupons are immersed in a salt solution or exposed to air only. SIMS provides chemical mapping and 2D molecular imaging of the interface, allowing direct visualization of the morphology of the corrosion products formed at the metal-paint interface and mapping of the chemical after corrosion occurs. The experimental procedure of this method is presented to provide technical details to facilitate similar research and highlight pitfalls that may be encountered during such experiments.
Introduction
Al alloys have wide applications in engineering structures, such as in marine technology or military automotive, attributable to their high strength-to-weight ratio, excellent formability, and resistance to corrosion. However, localized corrosion of Al alloys is still a common phenomenon which affects their long-term reliability, durability, and integrity in various environmental conditions1. Paint coating is the most common means to prevent corrosion. Illustration of the corrosion developed at the interface between metal and paint coating can provide insights in determining the appropriate remedy for corrosion prevention.
The corrosion of Al alloys may take place via several different pathways. X-ray photoelectron spectroscopy (XPS) and scanning electron microscopy/energy-dispersive X-ray spectroscopy (SEM/EDX) are two commonly applied surface microanalysis techniques in investigating corrosion. XPS can provide elemental mapping but not a holist molecular view of the surface chemical information2,3, while SEM/EDX provides morphological information and elemental mapping but with relatively low sensitivity.
ToF-SIMS is another surface tool for chemical mapping with high mass accuracy and lateral resolution. It has a low limit of detection (LOD) and is capable of revealing the distribution of the corrosion species formed at the metal-paint interface. Typically, SIMS mass resolution can reach 5,000-15,000, sufficient to differentiate the isobaric ions4. With its submicron spatial resolution, ToF-SIMS can chemically image and characterize the metal-paint interface. It provides not only morphological information but also the lateral distribution of molecular corrosion species at the top few nanometers of the surface. ToF-SIMS offers complementary information to XPS and SEM/EDX.
To demonstrate the capability of ToF-SIMS in surface characterization and imaging of the corrosion interface, two painted Al alloy (7075) coupons, one exposed to air only and one to a salt solution, are analyzed (Figure 1 and Figure 2). Understanding the corrosion behavior at the metal-paint interface exposed to the saline condition is critical to understand the performance of the Al alloy in a marine environment, for example. It is known that the formation of Al(OH)3 occurs during Al’s exposure to seawater5, but the study of Al corrosion still lacks comprehensive molecular identification of the corrosion and coating interface. In this study, the fragments of Al(OH)3, including Al oxides (e.g., Al3O5-) and oxyhydroxide species (e.g., Al3O6H2-), are observed and identified. The comparisons of SIMS mass spectra (Figure 3) and molecular images (Figure 4) of the negative ions Al3O5- and Al3O6H2- provide the molecular evidence of the corrosion products formed at the metal-paint interface of the salt solution-treated Al alloy coupon. SIMS offers the possibility to elucidate the complicated chemistry occurring at the metal-paint interface, which can help shed light on the efficacy of surface treatments in Al alloys. In this detailed protocol, we demonstrate this effective approach in probing the metal-paint interface to help new practitioners in corrosion research using ToF-SIMS.
Subscription Required. Please recommend JoVE to your librarian.
Protocol
1. Corrosion sample preparation
- Al sample fixation in resin, and polishing
- Mount two Al alloy coupons (1 cm x 1 cm) using epoxy resin in 1.25 inch metallographic sample cups and place the coupons in the fume hood overnight or till the resin is completely cured.
- Take out the Al resin cylinders cups from the sample cups. Polish the Al resin cylinders using 240 grit paper with water at a 300 rpm platen/150 rpm in the holder for 1 min.
- Polish the Al resin cylinders using the polishing plate with 15 µm, 6 µm, 3 µm, and 1 µm water-based solution for 5 min (each step), sequentially.
- Rinse the Al resin cylinders with deionized water (DI) and buff them with cotton.
- Rinse the Al resin cylinders again with ethanol and place them in the chemical fume hood till they are dry.
NOTE: Alternatively, the sample can be dried with pressurized air or nitrogen.
- Preparation of the Al corrosion sample
- Spray the black paint 2x onto each Al resin cylinder and let them stand in the fume hood for 24 h. The paint is approximately 100 µm thick.
NOTE: The paint is a commercial product with primer mixed in one bottle. It is fast drying and rust preventive. - Engrave four parallel lines (5-6 mm long) straight down on the top of each painted Al resin cylinder using scalpels. Place the lines in the center of the Al alloys.
- Immerse one Al resin cylinder into a pH 8.3 salt solution containing NaCl, MgSO4, MgCl2, and KCl, with the scribed surface down. Partially cover the 10 cm x 10 cm Petri dish with its lid.
NOTE: The salt solution is made of 465 mM NaCl, 28 mM MgSO4, 25 mM MgCl2, and 3 mM KCl in 50 mL of DI water, adjusted by 0.1 M NaOH to reach approximately pH 8.3. The solution contains main ions in seawater. The conductivity of the salt solution is approximately 5.5 S/m. The temperature of the solution is 72 °F. - Place the other Al resin cylinder with its scribed surface down in a clean Petri dish and cover it with the lid. Keep both samples in the chemical fume hood for 3 weeks.
- Spray the black paint 2x onto each Al resin cylinder and let them stand in the fume hood for 24 h. The paint is approximately 100 µm thick.
- Exposure of the corrosion interface and mounting of the interface in resin
- Cut each Al resin cylinder into two halves using a low-speed saw with a diamond blade, perpendicularly to the middle of the marked lines, and trim the excessive resin edge.
- Mount all the trimmed Al alloy pieces in a 2 inch sample cup and form an assembly by placing the Al alloy pieces along a circle, with the metal-paint interface facing up. Space out each Al alloy piece.
- Repeat steps 1.1.2-1.1.3.
- Further polish the metal-paint cross-section in a vibratory polisher affixed to a 2 lbs weight using 0.05 µm of colloidal silica solution on a polishing pad for 4 h.
- Repeat steps 1.1.4-1.1.5
NOTE: The fixation and polishing work is important for acquiring sufficient SIMS signals because an unpolished surface will lead to low intensities of secondary ions signals and a poor mass resolution during SIMS analysis.
- Coating of the sample with a sputter coater
- Put the polished metal-paint interface assembly in the sputter coater chamber with the interface side up. Close the lid of the sputter coater and start to pump down the chamber.
- Follow the regular sputter coater procedure and deposit a 10 nm gold (Au) layer on the metal-paint interface assembly.
NOTE: The purpose of this sample surface treatment is to reduce the charging effect during the SIMS analysis. If the sample is conductive, this step is not necessary.
2. Analysis of the metal-paint corrosion interface using ToF-SIMS
- Loading of the samples in ToF-SIMS
- Mount the metal-paint interface assembly containing the salt solution-treated sample and the air-exposed control on the Topmount sample holder using screws and clips.
NOTE: The Topmount is the name of the sample holder that holds the sample on the top of the sample holder. - Unscrew the locking screw on the load-lock door, and click the button Stop on the Fpanel window of the ToF-SIMS software graphical user interface (GUI) to vent the load-lock chamber.
- Open the load-lock chamber by swinging the sample transfer arm to the right, turn the transfer arm counterclockwise till it attaches to the pin of the Topmount sample holder, and then, turn it back.
- Swing the transfer arm back to close the door of the load lock and tighten the locking screw on the door to seal the load lock.
- Click the button Start on the Fpanel window to pump down the load-lock chamber till it reaches ~1.0E-6 mbar or below.
- Click the button Open on the Fpanel window to open the gate between the main chamber and the load lock.
- Push the sample transfer arm attached with the sample holder into the main chamber. Turn the transfer arm counterclockwise till the sample holder is transferred to the sample stage in the main chamber.
- Retract the transfer arm all the way back, and click the button Close on the Fpanel window to close the gate between the main chamber and the load lock.
- Select Topmount.shi from the drop-down menu of the pop-up window, select the Sample Holder, and click OK. The image of the Topmount sample holder appears at the right side of the Navigator GUI.
- Wait until the vacuum level of the main chamber reaches at least 1.0E-8 mbar or below.
- Mount the metal-paint interface assembly containing the salt solution-treated sample and the air-exposed control on the Topmount sample holder using screws and clips.
- Starting of the liquid metal ion gun (LMIG) and alignment of the ion beam
- Check the boxes of the LIMG, Analyzer, and Illumination in the Power Control window to power up the liquid metal ion gun (LIMG), analyzer, and light source after the samples are transferred to the main vacuum chamber.
- Check the box of LMIG shown on the Fpanel window to activate the LMIG setting tab. Click Start LMIG from the Source subtab under the LIMG tab in the Instrument Window to activate the LMIG.
- Select the predefined file of spectrometry settings in the pop-up window of Load Settings and click Open.
NOTE: Bi3+ is selected as the primary ion beam. The LMIG energy is set to 25 kV. The LIMG chopper width is set to 25 ns. The other settings including emission current 1.0 μA; the heating value is 2.75 A; the suppressor approximately 800-1,000 V; the extractor 10 kV; the lens source 3.3 kV; the cycle time 100 µs; the mass range 1-870 u. The settings may vary depending on the instrument model, the remaining lifetime of the LMIG, and the acquisition requirement for specific samples. - Select LMIG in the pop-up window of Categories to load, click the Selected button, and click OK.
NOTE: It takes approximately 5 min to fully start the LIMG. - Select Positive from the drop-down menu of the Instrument Setup in the Fpanel to determine the ions to be detected.
NOTE: Select Negative from the drop-down menu if negative ions are to be measured. - Select the predefined file of the analyzer settings after clicking the button of the Loading Settings in the Fpanel to activate the analyzer.
NOTE: The analyzer acceleration is set to 9.5 kV; the analyzer energy is set to 2 kV; the detector is set to 9 kV. The settings of the analyzer may vary due to the configuration of different SIMS models. - Select Faraday Cup from the drop-down menu of the Cursor Position in the Navigator GUI. Click Go to move the stage to the Faraday cup.
NOTE: Move the stage to the Faraday cup for the target current measurement. - Select the Micro view from the drop-down list of Video in the Navigator GUI to view the position of the Faraday cup.
- Click the center of the Faraday cup under the Micro view in the Navigator GUI and select Drive to Marked Position from the drop-down menu after right-clicking the SE/SI Primary Gun window in the Navigator GUI.
- Select 20 µm x 20 µm from the drop-down menu of Specify Raster Field of View after right-clicking the SE/SI Primary Gun window in the Navigator GUI.
- Click the button C from the Gun subtab under the LIMG tab in the Instrument Window to auto-align the ion beam.
- Click the Start button and check the box of DC from the Pulsing subtab under the LMIG tab to measure the target current.
- Click the X Blanking from the Focus subtab under the LIMG tab and turn the mouse wheel to maximize the target current. Click the Y Blanking from the same tab to maximize the target current.
NOTE: The target current of the ion beam measured under the mass spectrometry mode should be greater than 14 nA, or greater than 0.5 pA if Bi3+ is selected, to achieve the desired intensities of ion signals. - Click the Stop button from the Focus subtab to stop the measurement of the target current.
- Adjustment of the beam focus at the region of interest
- Press the Z button on the joystick control panel and push the joystick up to lower down the sample stage till the extractor cone is above the top of the metal-paint interface assembly.
NOTE: It is critical to avoid a collision between the extractor cone and the samples when conducting this step. - Press the X and Y buttons on the joystick and move the joystick left/right and up/down to bring the interface assembly till it is displayed in the Macro view in the Navigator GUI.
- Switch to Micro view in the Navigator GUI to locate the region of interest (ROI) of the metal-paint interface.
- Set the ROI to 300 µm x 300 µm after right-clicking the SE/SI Primary Gun window to expand the field of the view.
- Select the signal type SI, raster size 128 x 128 pixel, and raster type Random from the SE/SI Primary Gun in the Navigator GUI.
- Click the black triangle button and the Adjust SI button in the SE/SI Primary Gun window. The round shape of the secondary ion (SI) image of the ROI will appear in the SE/SI Primary Gun window.
- Press the Z button on the joystick control panel. Move the joystick up or down to bring the round shape of the SI image to the center of the cross-hair in the SE/SI Primary Gun window.
NOTE: If the cross-hair is in the middle of the round shape of SI image, it indicates that the image is obtained with good focus. - Uncheck the Adjust SI button, and click the square button in the SE/SI Primary Gun window to stop the focus adjustment.
- Press the Z button on the joystick control panel and push the joystick up to lower down the sample stage till the extractor cone is above the top of the metal-paint interface assembly.
- Removal of the surface coating and contamination using the high current mode/DC mode
- Select the SE image from the drop-down menu of the SE/SI Primary Gun window to observe the DC cleaning progress.
- Check the box of DC in the Fpanel and click the black triangle button to start DC cleaning.
NOTE: Keep the DC on for 10 s or till the SE image indicates the gold layer is removed. The duration of the DC cleaning may vary depending on the thickness of the coating. - Click the black square button to stop the DC cleaning when observing the gold coating is removed via the Micro view in the Navigator GUI.
- Switch the SE image to the SI image in the Navigator GUI.
NOTE: The reason for using a DC beam is because the DC beam (~14 nA) is powerful enough to remove the Au coating and other surface contamination, while the pulsed beam current (~1 pA) is not adequate.
- Enabling of the surface charge compensation using a flood gun
- Check the Flood Gun box in the Fpanel to enable the charge compensation.
- Click the button Load Setting File in the Fpanel. Select the predefined file of flood gun settings after clicking the Loading Settings to load the settings of the flood gun.
NOTE: The settings of the flood gun include the following: energy of 20 V, an anode of 300 V, a delay of 2.0 µs, a flood gun filament current of 2.4 A, and a flood gun lead off of 2.0 µs. The settings of the flood gun may vary for different instruments. - Repeat steps 2.3.6-2.3.7 to readjust the focus on the ROI.
NOTE: As soon as the Au coating is removed, the height of the ROI will change. Thus, it is necessary to readjust the focus. - Click the Reflector from the TOF subtab of the Analyzer/Main tab in the Instrument Window.
- Click the value on the left side of the bar of the Reflector to decrease the voltage of the reflector till the round shape of the SI image disappears. Then, increase the reflector voltage by 20 V.
NOTE: This process is done to ensure a flat imaging surface and maximum SI signals. In the negative mode, increase the reflector voltage till the round shape of the SI image disappears and, then, bring it down 20 V. - Repeat step 2.3.8 to stop the focus and reflector voltage adjustment.
- Acquirement of the high-resolution mass spectrum
- Click the icons of the Spectrum and Image in the Fpanel to open the spectrum and images programs.
- Display the selected ROI of the metal-paint interface in Micro view.
- Click the triangle button in the Navigator GUI to start a quick scan and a SIMS spectrum will appear in the Spectrum program; click the black square to stop the quick scan.
NOTE: The quick scan should only take several scans and usually takes just a few seconds. - Select the Mass Calibration from the drop-down list of the Spectrum on the toolbar of the Spectrum program or simply press F3 to bring up the mass calibration window after the quick scan is completed.
- Select recognized peaks to calibrate the mass spectrum by clicking the corresponding peaks, add the formula in the mass calibration window, and click OK to exit the mass calibration window when the peak selection is done.
NOTE: CH3+, C3H3+, and AlOH+ are selected for calibrating the positive mass spectrum; while OH- and CN¬ and AlO- are selected for calibrating the negative mass spectrum. The peaks selected for mass calibration may vary for different samples. The deviation of the selected peaks is less than 30 ppm to ensure accurate peak identification. - Add the peaks of interests to the peak list by clicking the peak of the selected ions in the spectrum and clicking the Add Peak button on the toolbar.
- Click the red triangle button in the Fpanel to open the Start Measurement window.
- Set the Raster type to Random, 128 x 128 pixel, and 1 shot/pixel, set the Number of Scans to 60 scans in the pop-up window, and click OK to start the mass spectrum acquisition of the ROI.
NOTE: The mass spectrum acquisition will automatically stop after the desired number of scans are acquired. - Click Save File in the Fpanel to save the acquired mass spectrum and name it with a designated file name (e.g., salt solution-treated, air-exposed).
- Switch the polarity to Negative in the Fpanel and repeat steps 2.5.3-2.6.9 to acquire the negative mass spectrum for the same ROI.
NOTE: SIMS mass spectra of four different ROIs of each sample were acquired for the positive and negative polarities in this study.
- Saving of the analyzed ROI position for additional analysis
- Click the Add button in the Navigator GUI and input the name of the ROI in the pop-up window (e.g., salt solution 1).
- Click the Stage Pos button and click the OK button to save the ROI location.
NOTE: The ROI position is saved for additional SIMS imaging analysis.
- Acquirement of a high-resolution SIMS image
- Click the button Load Setting File in the Fpanel and select the predefined imaging setting file. Click Open to load the imaging settings.
NOTE: The highest lateral resolution or the smallest spot size is optimized in the collimated mode (i.e., the DC mode). In this mode, the smallest aperture in the beamline determines the angle of the aperture. According to the configuration setting of the ToF-SIMS, the highest lateral resolution is when the DC current is approximately 50 pA and the focus can reach around 100 nm. To achieve this resolution, increase the Lens Source while observing the DC current going down, and optimize the X Blanking and Y Blanking till the final DC current reaches 50 pA. The following lists the detailed parameter settings of the imaging mode. Bi3+ is selected as the primary ion beam. The LMIG energy is set to 25 kV. The LIMG chopper width is set to 100 ns and the chopper offset is set to 30.9 ns. The other settings include an emission current of 1.0 μA; the heating value is 2.75 A; the suppressor approximately 800-1,000 V; the extractor 10 kV; the lens source 3.5 kV; the cycle time 100 µs; the mass range 1-870 u. - Select LMIG in the pop-up Categories to Load window.
- Repeat steps 2.2.7-2.2.14 to measure the target current and align the ion beam.
NOTE: The desired target current in the imaging mode should be greater than 0.6 nA or approximately 1 pA if Bi3+ is selected for measurement. - Select the saved ROI position from the drop-down list of the Cursor Position in the Navigator GUI. Click Go.
NOTE: This step ensures that the mass spectrum and image mapping are acquired from the same ROI. - Repeat steps 2.5.4 and 2.5.5 to adjust the reflector voltage.
- Repeat steps 2.6.3-2.6.6 to conduct the mass calibration in the imaging mode.
NOTE: If the software cannot register the selected peaks when doing the mass calibration, check the box Use Selected Channel in the Mass Calibration window. - Repeat steps 2.6.7 and 2.6.8 to collect the image data.
NOTE: In the imaging mode, set the raster type to Random, 256 x 256 pixel, and 1 shot/pixel, set the Number of Scans to 150 scans, and click OK to start the image acquisition of the ROI. The image resolution and scan can be different and they should be determined depending on the sample.
- Click the button Load Setting File in the Fpanel and select the predefined imaging setting file. Click Open to load the imaging settings.
- Retrieval of the sample from the vacuum chamber
- Select Transfer from the drop-down list of the Cursor Position in the Navigator GUI and click the Go button to bring the sample stage near the gate.
- Open the gate by repeating step 2.1.6.
- Push the sample transfer arm into the main chamber and turn the arm rod clockwise and forward till it attaches to the pin of the sample holder.
- Turn the transfer arm back and retract it all the way.
- Close the gate by clicking the button Close on the Fpanel and select No sample holder in the pop-up Select Sample Holder window.
- Unscrew the locking screw on the door of the load lock and click the button Stop in the Fpanel to vent the load lock.
NOTE: Venting takes approximately 3-5 min. - Swing the transfer arm to the right and turn the transfer arm rod counterclockwise to release the sample holder.
- Swing the transfer arm back and tighten the locking screw on the door of the load lock.
- Click the Start button in the Fpanel to pump down the load lock.
- Take off the metal-paint interface resin assembly from the sample holder and place them in a clean Petri dish.
- Turning off the LIMG
- Click Stop LMIG from the subtab under the LMIG tab in the Instrument Window.
- Uncheck the boxes of LMIG and Flood Gun in the Fpanel and uncheck the box of Illumination in the Power window.
3. Analysis of the ToF-SIMS data
- Export of the SIMS spectrum data
- Click File on the toolbar of the Spectrum Program window and select Export from the drop-down list.
- Name the spectrum file, save it in the designated folder as a .txt file, and click OK.
- Type number 10 in the pop-up window to define the binning channel and click OK.
NOTE: Binning 10 channels before exporting the mass spectra is a commonly used method for reducing the data size while still keeping the mass resolution and accuracy. - Export the SIMS image data.
- Click the Image Program icon and double-click the acquired image files to display the SIMS images.
- Drag the image of a specific chemical species from the list to the image display window and double-click that image to open the image process window below.
- Normalize the image of the selected chemical species to the images of total ions by choosing Normalize from the drop-down list of the image process window.
- Apply the same color scale to compare the chemical distribution between different samples by adjusting the color scale in the image process window.
NOTE: The raw data of the images can be exported and plotted using other graphical software.
Subscription Required. Please recommend JoVE to your librarian.
Representative Results
Figure 3 presents the comparison of mass spectra between the metal-paint interface treated with salt solution and the interface exposed to air. The mass spectra of the two samples were acquired using a 25 kV Bi3+ ion beam scanning in 300 µm x 300 µm ROIs. The mass resolution (m/∆m) of the salt solution-treated sample was approximately 5,600 at the peak of m/z- 26. The raw data of the mass spectra were exported after binning 10 channels. A graphical software was applied to plot the mass spectra for presentation. It is known that the protective layers containing Al(OH)3 are formed after the Al corrosion starts6. The oxide (Al3O5-) and oxyhydroxide species (Al2O4H-, Al2O5H3-, Al3O6H2-) of Al(OH)3 fragments7 were observed in the metal-paint interface of the salt solution-exposed Al coupon (Figure 3a) and were more prominent when compared to the same peaks in the air-exposed sample (Figure 3b). This indicates that the Al coupon exposed to the salt solution had experienced more severe corrosion compared to the air-exposed one. The result is consistent with the known knowledge that solutions containing salts, such as seawater, are chemically aggressive and contribute to the corrosion process of an Al alloy.
Figure 4 depicts 2D molecular images of selected Al species m/z- 161 Al3O5- and 179 Al3O6H2- acquired from the metal-paint interface treated with a salt solution (Figure 4a) and the interface exposed to air (Figure 4b). The depicted ion intensities of m/z- 161 and 179 were both normalized to the intensities of total ions. The images of the same peak were adjusted to the identical color scale. The images were obtained from 100 scans of 256 x 256 pixels of the 300 µm x 300 µm ROI. The 2D images provide the distribution of the chemical species of the Al corrosion products in two different samples. The peaks m/z- 161 and 179 were more prevalent in the metal-paint interface treated with the salt solution, displaying stronger intensities than the ones shown in the air-exposed sample. This result agrees with the mass spectra results and further demonstrates ToF-SIMS’s analytical capabilities of chemical identification and molecular imaging.
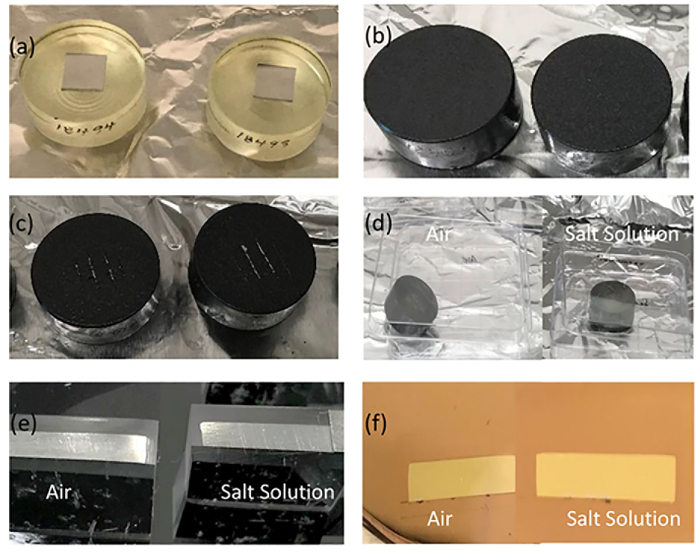
Figure 1: Photos showing the metal-paint interface preparation process. Figure 1 depicts the metal-paint interface preparation process. After the Al coupons were fixed in the epoxy resin (a), they were sprayed with the commercial paint product and set for 24 h till they were completely dry (b). Four lines were scribed on the paint on top of the Al coupon cylinders (c). The carved Al coupon cylinders were exposed to air or a salt solution for 3 weeks in Petri dishes (d). The Al coupon cylinders were cut and trimmed to expose the metal-paint interfaces (e) and coated with gold layers prior to ToF-SIMS analysis (f). Please click here to view a larger version of this figure.

Figure 2: The schematic of the metal-paint interface analysis by ToF-SIMS and a photo of the IONTOF V instrument. Figure 2 illustrates the analysis process of the metal-paint interface using ToF-SIMS. The metal-paint interface (a) was bombarded by a Bi3+ primary ion beam and generated the secondary ions, resulting in mass spectra (b) and a SIMS image (c). The ToF-SIMS V instrument (d) used for the metal-paint interface analysis described in this work is displayed. Please click here to view a larger version of this figure.

Figure 3: Comparison of mass spectra of the metal-paint interfaces of Al coupons. The figure shows the spectral difference between the interface treated with a salt solution and the one treated with air. Please click here to view a larger version of this figure.

Figure 4: Molecular images of chemical species at the metal-paint interface of Al coupons. This comparison shows the difference in 2D distribution of species formed in corrosion by salt solution and by air. Please click here to view a larger version of this figure.
Subscription Required. Please recommend JoVE to your librarian.
Discussion
ToF-SIMS differentiates the ions according to their time of flight between two scintillators. The topography or sample roughness affects the flight time of the ions from different starting positions, which usually leads to a poor mass resolution with an increased width of peaks. Therefore, it is critical that the ROIs being analyzed are very flat, to ensure good signal collection8.
Another pitfall to avoid is charging. Since the Al-paint interface was fixed with the insulating resin, charging was expected. Charge accumulates on the sample surface as the ROI is bombarded with the primary ion beam, affecting the kinetic energies of ions that are emitted from the surface. Charging results in wide peaks and a decreased mass resolution. To avoid the negative influence of this effect, 10 nm of gold was sputtered on the interface surface to form the conductive path prior to SIMS analysis. Other methods can be applied to reduce the charging effect, including applying the flood gun, optimizing the voltage of the reflector, and selecting Random mode as the beam raster pattern. The flood gun generates a stable electron current with low energy. It is commonly used for charge compensation during the SIMS analysis9,10,11. In addition, the voltage of the reflector, an ion optic that enhances the mass resolution, needs to be adjusted, depending on the degree of charging. ToF-SIMS software provides an efficient way to optimize the reflector as described in step 2.5.5 of the protocol. The selection of Random mode as the beam raster pattern before acquiring SIMS data further reduces the charging effect. This mode mitigates the problem occurring in the row-by-row scanning mode, allowing the accumulated charge more time to dissipate9,11.
ToF-SIMS can be equipped with multiple ion sources, including - but not limited to - Cs+, C60+, and Bin+. Polyatomic ion sources (e.g., Bi3+ and C60+) produce higher yields of secondary ions emitted from the sample surface compared to atomic ion beams (e.g., Cs+ and Bi1+)12,13. Furthermore, comparing Bi3+ to C60+, Bi3+ is more surface sensitive to low-mass fragments and, thus, has a higher lateral resolution with better images12. Therefore, Bi3+ was selected as the analysis beam in this work since we focused on the low-mass peaks related to aluminum corrosion species.
ToF-SIMS is a sensitive surface technique that can provide chemical specificity with a high spatial resolution14. Other surface tools applied in corrosion studies include XPS and SEM/EDX2,15,16,17. XPS can provide quantitative measurements of the chemical state and electronic state of the elements that exist within a sample but with a higher LOD (0.1%) than SIMS (parts-per-billion - parts-per-million level)18,19. SEM/EDX is not as sensitive as ToF-SIMS, although SEM is often used to obtain morphological features of surfaces. In addition, the chemical mapping of SIMS makes it possible to visualize the molecular ion distribution at the corrosion interface, while SEM/EDX only provides the elemental ion mapping. Thus, SIMS’s molecular mapping is more informative in investigating the interfacial corrosion process.
This work demonstrates that ToF-SIMS is a powerful tool in deciphering the corrosion speciation at the interface due to its low LOD, high mass resolution, and high spatial resolution. Furthermore, SIMS offers multimodal microanalysis, attributable to its quasi-nondestructive nature. Thus, the same sample can be analyzed by other analytical tools and provide comprehensive information. Ideally, the integration of SIMS, XPS, and SEM can provide more comprehensive insights into corrosion behavior at the metal-paint interface.
Subscription Required. Please recommend JoVE to your librarian.
Disclosures
The authors have nothing to disclose.
Acknowledgments
This work was funded by the QuickStarter Program supported by Pacific Northwest National Laboratory (PNNL). PNNL is operated by Battelle for the U.S. DOE. This work was performed using the IONTOF ToF-SIMS V, located in the Biological Sciences Facility (BSF) at PNNL. JY and X-Y Yu also acknowledged the support from the Atmospheric Sciences & Global Change (ASGC) Division and Physical and Computational Sciences Directorate (PCSD) at PNNL
Materials
| Name | Company | Catalog Number | Comments |
| 0.05 µm Colloidal Silica polishing Solution | LECO | 812-121-300 | Final polishing solution |
| 1 µm polishing solution | Pace Technologies | PC-1001-GLB | Water based polishing solution |
| 15 µm polishing solution | Pace Technologies | PC-1015-GLBR | Water based polishing solution |
| 3 µm polishing solution | Pace Technologies | PC-1003-GLG | Water based polishing solution |
| 6 µm polishing solution | Pace Technologies | PC-1006-GLY | Water based polishing solution |
| Balance | Mettler Toledo | 11106015 | It is used for measuring the chemicals. |
| Epothin 2 epoxy hardener | Buehler | 20-3442-064 | Used for casting sample mounts |
| Epothin 2 epoxy resin | Buehler | 20-3440-128 | Used for casting sample mounts |
| Fast protein liquid chromatography (FPLC) conductivity sensor | Amersham | AKTA FPLC | Used to measure the conductivity of the salt solution. |
| Final B pad | Allied | 90-150-235 | Used for 1 µm and 0.05 µm polishing steps |
| KCl | Sigma-Aldrich | P9333 | Used to make the salt solution. |
| Low speed saw | Buehler Isomet | 11-1280-160 | Used to cut the Al coupons that are fixed in the epoxy resin. |
| MgCl2 | Sigma-Aldrich | 63042 | Used to make the salt solution. |
| MgSO4 | Sigma-Aldrich | M7506 | It is used to make the salt solution. |
| NaCl | Sigma-Aldrich | S7653 | It is used to make the salt solution. |
| NaOH | Sigma-Aldrich | 306576 | It is used for adjusting pH of the salt solution. |
| Paint | Rust-Oleum | 245217 | Universal General Purpose Gloss Black Hammered Spray Paint. It is used to spray on the Al coupons. |
| Pan-W polishing pad | LECO | 809-505 | Used for 15, 6, and 3 µm polishing steps |
| pH meter | Fisher Scientific | 13-636-AP72 | It is used for measuring the pH of the salt solution. |
| Pipette | Thermo Fisher | Scientific | Range: 10 to 1,000 µL |
| Pipette tip 1 | Neptune | 2112.96.BS | 1,000 µL |
| Pipette tip 2 | Rainin | 17001865 | 20 µL |
| Silicon carbide paper | LECO | 810-251-PRM | Grinding paper, 240 grit |
| Sputter coater | Cressington | 108 sputter coater | It is used for coating the sample. |
| Tegramin-30 Semi-automatic polisher | Struers | 6036127 | Coarse/fine polishing/grinding |
| ToF-SIMS | IONTOF GmbH, Münster, Germany | ToF-SIMS V, equipped with Bi liquid metal ion gun and flood gun | It is used to acquire mass spectra and images of a specimen. |
| Vibromet 2 vibratory polisher | Buehler | 67-1635-160 | Final polishing step |
References
- Szklarska-Smialowska, Z. Pitting corrosion of aluminum. Corrosion Science. 41, 1743-1767 (1999).
- Liu, M., et al. A first quantitative XPS study of the surface films formed, by exposure to water on Mg and on the Mg-Al intermetallics: Al3Mg2 and Mg17Al12. Corrosion Science. 51 (5), 1115-1127 (2009).
- Linford, M. R. An introduction to time-of-flight secondary ion mass spectrometry (ToF-SIMS). Vacuum Technology & Coating. , (2014).
- Cushman, C., et al. A pictorial view of LEIS and ToF-SIMS instrumentation. Vacuum Technology & Coating. , 27-35 (2016).
- Soler, L., et al. Hydrogen generation by aluminum corrosion in seawater promoted by suspensions of aluminum hydroxide. International Journal of Hydrogen Energy. 34 (20), 8511-8518 (2009).
- Ahmad, Z., Abdul Aleem, B. J. Degradation of aluminum metal matrix composites in salt water and its control. Materials & Design. 23 (2), 173-180 (2002).
- Verdier, S., Metson, J. B., Dunlop, H. M. Static SIMS studies of the oxides and hydroxides of aluminium. Journal of Mass Spectrometry. 42 (1), 11-19 (2007).
- Esmaily, M., et al. A ToF-SIMS investigation of the corrosion behavior of Mg alloy AM50 in atmospheric environments. Applied Surface Science. 360, 98-106 (2016).
- Hunt, C. P., Stoddart, C. T. H., Seah, M. P. The surface analysis of insulators by SIMS: Charge neutralization and stabilization of the surface potential. Surface and Interface Analysis. 3 (4), 157-160 (1981).
- Stingeder, G. Quantitative distribution analysis of B, As and Sb in the layer system SiO2/Si with SIMS: elimination of matrix and charging effects. Fresenius' Zeitschrift für analytische Chemie. 327 (2), 225-232 (1987).
- Cushman, C., et al. Sample Charging in ToF-SIMS: How it Affects the Data that are Collected and How to Reduce it. Vacuum Technology & Coating. , (2018).
- Dubey, M., Brison, J., Grainger, D. W., Castner, D. G. Comparison of Bi(1), Bi(3) and C(60) primary ion sources for ToF-SIMS imaging of patterned protein samples. Surface and Interface Analysis: SIA. 43 (1-2), 261-264 (2011).
- Kozole, J., Winograd, N. Cluster Secondary Ion Mass Spectrometry. Surface Analysis and Techniques in Biology. Smentkowski, V. S. , Springer International Publishing. Cham, Heidelberg, New York, Dordrecht, London. 71-98 (2014).
- Tyler, B. J., Rayal, G., Castner, D. G. Multivariate analysis strategies for processing ToF-SIMS images of biomaterials. Biomaterials. 28 (15), 2412-2423 (2007).
- Song, W., et al. Corrosion behaviour of extruded AM30 magnesium alloy under salt-spray and immersion environments. Corrosion Science. 78, 353-368 (2014).
- Esmaily, M., et al. On the capability of in-situ exposure in an environmental scanning electron microscope for investigating the atmospheric corrosion of magnesium. Ultramicroscopy. 153, 45-54 (2015).
- Liao, J., Hotta, M., Motoda, S. -i, Shinohara, T. Atmospheric corrosion of two field-exposed AZ31B magnesium alloys with different grain size. Corrosion Science. 71, 53-61 (2013).
- deVries, J. E. Surface characterization methods- XPS,TOF-SIMS, and SAM a complimentary ensemble of tools. Journal of Materials Engineering and Performance. 7 (3), 303-311 (1998).
- Zhang, H. Surface characterization techniques for polyurethane biomaterials. Advances in Polyurethane Biomaterials. Cooper, S. L., Guan, J. , Woodhead Publishing. 23-73 (2016).
