

ERRATUM NOTICE
Important: There has been an erratum issued for this article. Read more …
Summary
يسهل فحص فيضان الشتلات الفحص السريع لوالانضمامات الطماطم البرية للمقاومة لبكتيريا Pseudomonas syringae. هذا الفحص، المستخدم بالاقتران مع فحص نمو الشتلات البكتيرية، يمكن أن يساعد في زيادة توصيف المقاومة الأساسية للبكتيريا، ويمكن استخدامه لفحص مجموعات رسم الخرائط لتحديد الأساس الوراثي للمقاومة.
Abstract
الطماطم هي محصول مهم زراعيا يمكن أن يصاب بـ Pseudomonas syringae، وهي بكتيريا سلبية الغرام ، مما يؤدي إلى مرض بقع بكتيرية. الطماطم-P. syringae الكهروضوئية. يستخدم نظام الطماطم على نطاق واسع لتشريح الأساس الوراثي للاستجابات الفطرية النباتية ومقاومة الأمراض. في حين تمت إدارة المرض بنجاح لعدة عقود من خلال إدخال مجموعة الجينات Pto / Prf من Solanum pimpinellifolium إلى الطماطم المزروعة ، تطورت سلالات العرق 1 من P. syringae للتغلب على المقاومة التي تمنحها مجموعة جينات Pto / Prf وتحدث في جميع أنحاء العالم.
أنواع الطماطم البرية هي خزانات هامة للتنوع الطبيعي في التعرف على مسببات الأمراض ، لأنها تطورت في بيئات متنوعة مع ضغوط مسببات الأمراض المختلفة. في الشاشات النموذجية لمقاومة الأمراض في الطماطم البرية ، يتم استخدام النباتات البالغة ، والتي يمكن أن تحد من عدد النباتات التي يمكن فحصها بسبب وقت نموها الممتد ومتطلبات مساحة النمو الأكبر. لقد طورنا طريقة لفحص شتلات الطماطم التي يبلغ عمرها 10 أيام للمقاومة ، مما يقلل من وقت نمو النبات ومساحة غرفة النمو ، ويسمح بدوران سريع للنباتات ، ويسمح باختبار أحجام العينات الكبيرة. يمكن التعامل مع نتائج الشتلات من البقاء على قيد الحياة أو الموت كأنماط ظاهرية منفصلة أو على مقياس مقاومة محدد بكمية النمو الجديد في الشتلات الناجية بعد الفيضانات. وقد تم تحسين هذه الطريقة لفحص شتلات الطماطم التي يبلغ عمرها 10 أيام لمقاومة اثنين من سلالات P. syringae ويمكن بسهولة تكييفها مع سلالات P. syringaee الأخرى.
Introduction
Pseudomonas syringae هي بكتيريا الإمراض السلبي للجرام الذي يصيب مجموعة واسعة من مضيفي النباتات. البكتيريا تدخل النبات المضيف من خلال الجروح الجسدية أو الستاماتا وتتكاثر في apoplast1. وقد تطورت النباتات استجابة مناعية من مستويين للحماية من العدوى من مسببات الأمراض البكتيرية. يحدث المستوى الأول في سطح الخلية النباتية ، حيث تتصور مستقبلات التعرف على الأنماط على غشاء الخلية النباتية الأنماط الجزيئية المرتبطة بمسببات الأمراض (PAMPs) في عملية تسمى المناعة التي يتم تشغيلها PAMP (PTI)2. خلال هذه العملية ، يقوم النبات المضيف باستضافة مسارات الاستجابة الدفاعية ، بما في ذلك ترسب الكالوز إلى جدار الخلية ، وإغلاق الستوماطا ، وإنتاج أنواع الأكسجين التفاعلية ، وتحريض الجينات المرتبطة بالإمراض.
يمكن للبكتيريا التغلب على PTI من خلال استخدام نظام إفراز النوع الثالث لتقديم البروتينات ، وتسمى المؤثرات ، مباشرة إلى الخلية النباتية3. البروتينات Effector تستهدف عادة مكونات PTI وتعزيز الفوعة الممرض4. يحدث المستوى الثاني من مناعة النبات داخل الخلية النباتية عند التعرف على البروتينات المؤثرات. يعتمد هذا الاعتراف على جينات المقاومة ، والتي تقوم بترميز موقع ربط النيوكليوتيدات الغنية بالليوسين تكرار المستقبلات التي تحتوي على (NLRs). NLRs قادرة إما على الاعتراف المؤثرات مباشرة أو الاعتراف بنشاطهم على هدف الفوعة أو الفخ5. ثم تؤدي إلى استجابة مناعية ثانوية في عملية تسمى المناعة التي تسببها المؤثرات (ETI) ، والتي غالبًا ما ترتبط باستجابة شديدة الحساسية (HR) ، وهي شكل من أشكال موت الخلايا المترجمة في موقع العدوى6. وعلى النقيض من مقاومة الجينات مقابل الجينات المرتبطة بـ ETI ، يمكن للنباتات أن تظهر مقاومة جزئية كمية ، والتي تعتمد على مساهمة جينات متعددة7.
P. syringae الكهروضوئية. الطماطم (PST)هو العامل السببي للذرة البكتيرية على الطماطم وهو مشكلة زراعية مستمرة. وكانت السلالات السائدة في هذا المجال عادة سباق توقيت المحيط الهادي 0 سلالات التي تعبر عن أي أو كلا من نوع الثالث المؤثرات AvrPto وAvrPtoB. DC3000(PSTDC3000) هو سباق تمثيلي 0 سلالة وعامل ممرض نموذجي يمكن أن يسبب ذرة بكتيرية في الطماطم. لمكافحة مرض بقع البكتيرية، والمربين مقدمة Pto [P. syringae pv. الطماطم]/ Prf [Pto المقاومة وحساسية الفينثيون]الكتلة الجينات من أنواع الطماطم البرية سولانوم pimpinellifolium في الأصناف الحديثة8،9. جين Pto ترميز كيناز بروتين سيرين-ثريونين التي، جنبا إلى جنب مع NLR Prf، تمنح مقاومة لتوقيت المحيط الهاديDC3000 عن طريق التعرف على المؤثرات أفريبتو وAvrPtoB10،11،12،13،14. ومع ذلك ، فإن هذه المقاومة غير فعالة ضد سلالات العرق 1 الناشئة ، مما يسمح لانتشارها السريع والعدواني في السنوات الأخيرة15،16. سلالات العرق 1 تهرب من الاعتراف من قبل الكتلة Pto / Prf ، لأن AvrPto إما فقدت أو تحور في هذه السلالات ، ويبدو أن AvrPtoB تتراكم الحد الأدنى15،17،18.
مجموعات الطماطم البرية هي خزانات هامة من الاختلاف الطبيعي لمقاومة توقيت المحيط الهادي وقد استخدمت سابقا لتحديد المقاومة المحتملة loci19،20،21. ومع ذلك ، تستخدم الشاشات الحالية لمقاومة مسببات الأمراض النباتات البالغة التي يبلغ عمرها 4-5 أسابيع20،21. ولذلك، فهي محدودة من قبل وقت النمو، ومساحة غرفة النمو، وأحجام عينة صغيرة نسبيا. لمعالجة القيود المفروضة على النهج التقليدية، وضعنا عالية الإنتاجية الطماطم P. syringae اختبار المقاومة باستخدام 10 يوما من العمر شتلات الطماطم22. يوفر هذا النهج العديد من المزايا على استخدام النباتات البالغة: وهي وقت النمو الأقصر، وتقليل متطلبات المساحة، وارتفاع الإنتاجية. وعلاوة على ذلك، لقد أثبتنا أن هذا النهج يُلخص بأمانة الأنماط الظاهرية لمقاومة الأمراض التي لوحظت في النباتات البالغة22.
في الشتلات فيضان الاسهاص الموصوفة في هذا البروتوكول، تزرع شتلات الطماطم على أطباق بيتري من المعقمة Murashige وSkoog (MS) وسائل الإعلام لمدة 10 أيام ومن ثم يتم غمرها مع تلقيح يحتوي على البكتيريا ذات الاهتمام وsurfactant. بعد الفيضانات، يمكن تقييم الشتلات كميًا لمقاومة الأمراض عن طريق المقايسات البكتيرية للنمو. بالإضافة إلى ذلك، يمكن أن يكون بقاء الشتلات أو الموت بمثابة مقاومة منفصلة أو النمط الظاهري للمرض 7-14 يوما بعد الفيضانات. هذا النهج يوفر بديلا عالية الإنتاجية لفحص أعداد كبيرة من انضمام الطماطم البرية لمقاومة سلالات سباق المحيط الهادي 1، مثل سلالة توقيت المحيط الهادي T1(توقيت المحيط الهاديT1)، ويمكن بسهولة أن تتكيف مع سلالات بكتيرية أخرى من الفائدة.
Subscription Required. Please recommend JoVE to your librarian.
Protocol
1. إعداد واستخدام مجلس الوزراء السلامة البيولوجية
- مسح أسفل مجلس الوزراء السلامة البيولوجية مع الإيثانول 70٪.
- أغلق وشاح وبدوره على الأشعة فوق البنفسجية في مجلس الوزراء السلامة البيولوجية لمدة 15 دقيقة.
- بعد 15 دقيقة، إيقاف الأشعة فوق البنفسجية في مجلس الوزراء السلامة البيولوجية. رفع وشاح وتحويل على منفاخ لمدة 15 دقيقة.
- مسح جميع العناصر لاستخدامها في مجلس الوزراء السلامة البيولوجية مع الإيثانول 70٪ قبل وضع العناصر في مجلس الوزراء المعقم.
- قفازات نظيفة أو أيدي عارية مع الإيثانول 70٪ قبل العمل في مجلس الوزراء السلامة البيولوجية.
- العمل في وسط مجلس الوزراء السلامة البيولوجية، بعيدا عن منفاخ.
- استخدام زجاجات غير مفتوحة من المعقمة المعقمة الأوتوكلاف 10 MM MgCl2 وUltrapure H2O للتجارب. وضع زجاجات في مجلس الوزراء السلامة البيولوجية وفتحها فقط في مجلس الوزراء السلامة البيولوجية المعقمة، وليس على benchtop.
- استخدام ماصة الزجاج مخصصة ونصائح ماصة للعمل في مجلس الوزراء السلامة البيولوجية المعقمة. تأكد من أن يتم فتح هذه فقط في مجلس الوزراء السلامة البيولوجية، أبدا على مقاعد البدلاء.
- بعد استخدام خزانة السلامة البيولوجية ، الأوتوكلاف جميع النفايات (باستثناء نفايات التبييض) ومسح أسفل السطح مع الإيثانول 70٪.
2- إعداد وسائل الإعلام النباتية
- تزن وتذوب 0.5x أملاح MS القاعدية في Ultrapure H2O. تزن 0.8٪ bacto agar ثم تضاف إلى المذاب 0.5x MS.
- الأوتوكلاف والسماح لوسائل الإعلام لتبرد في حمام الماء 50 درجة مئوية لمدة 1 ساعة قبل صب أو pipetting.
- لضمان عدم تعبئة اللوحات، ضع علامة على ألواح البوليسترين المعقمة 100 × 25 مم إلى مستوى تعبئة يبلغ 40 مل. صب وسائل الإعلام في لوحات معقمة 100 × 25 ملم في خزانة السلامة البيولوجية المعقمة.
3- إعداد المواد النباتية وظروف النمو
- وضع بذور الطماطم في أنبوب 2.2 مل الطرد المركزي الدقيق وإضافة 2.0 مل من محلول التبييض 50٪.
- صخرة أنبوب على الروك لمدة 25 دقيقة.
- بعد 25 دقيقة، وإزالة البذور من الروك وإزالة محلول التبييض مع ماصة في مجلس الوزراء السلامة البيولوجية العقيمة. تأكد من إزالة جميع التبييض.
- إضافة 2 مل من العقيمة Ultrapure H2O لغسل البذور. عكس الأنبوب 5x.
- إزالة السائل من الأنبوب مع ماصة.
- كرر الخطوات 3.3-3.5 لغسل البذور 4x أكثر.
- أضف 2 مل من العقيمة فائقة النقاء H2O وصب البذور في طبق بيتري معقم فارغ.
- ملقط اللهب في الإيثانول والسماح لتبرد قبل نقل والمباعدة بالتساوي البذور على لوحات 100 × 25 ملم التي تحتوي على 0.5x MS + 0.8٪ وسائط أجار.
- نقل 5-7 البذور في خط عبر منتصف لوحة واحدة وختم حواف لوحات مع الشريط الجراحي (1.25 سم × 9.1 م).
- قم بطبقات البذور المعقمة عند 4 درجات مئوية في الظلام لمدة 3 أيام على الأقل لمزامنة الإنبات. تأكد من أن لوحات مكدسة مسطحة والوجه لأعلى، بحيث البذور لا تتحول على لوحة.
- توجيه عموديا لوحات بحيث تنمو الجذور أسفل على طول سطح لوحة، مع خط البذور الموجهة أفقيا، عند نقل إلى غرفة النمو.
ملاحظة: تعيين غرفة النمو إلى 22 درجة مئوية وتوفير 16 ساعة من الضوء في كثافة الضوء من ~ 200-220 μE متر-2 s-1 و 8 ساعة من الظلام. - قبل الفيضانات، وتنمو الشتلات لمدة 10 أيام في غرفة النمو عند النقطة التي تظهر عادة الشتلات ظهرت بالكامل وتوسعت cotyledons والناشئة الأوراق الحقيقية الأولى(الشكل 1).

الشكل 1: مرحلة النمو من شتلات الطماطم النموذجية التي يبلغ عمرها 10 أيام. تم تعقيم بذور الطماطم ريوغراندي- PtoR، مطلي، وطبق لمدة 3 أيام على الأقل في الظلام في 4 درجة مئوية. وتزرع الشتلات على لوحات 0.5x MS لمدة 10 أيام في 22 درجة مئوية قبل أن تغمرها المياه. عادة، في 10 أيام يتم توسيع الكوتيلدون بالكامل، والأوراق الحقيقية الأولى هي بداية في الظهور. يرجى الضغط هنا لعرض نسخة أكبر من هذا الرقم.
4. إعداد وسائل الإعلام الملك B23 (KB)
- ملء الكأس مع 500 مل من Ultrapure H2O ويحرك على لوحة اثارة.
- حل تماما 20 غرام من بكاتو بيبتوني, 1.5 غرام من Kاللامائية 2HPO4,و 12.5 مل من الجلسرين في كوب مع Ultrapure H2O.
- صب الخليط المذاب في اسطوانة تخرج 1 L وجلب ما يصل إلى حجم 1 L النهائي مع Ultrapure H2O.
- يُسكب المرق مرة أخرى في الكأس ويُحرّك حتى يُخلط.
- تزن 7.5 غرام من bacto أجار في اثنين من زجاجات 500 مل وإضافة 500 مل من مرق KB من الخطوة 4.4 في كل زجاجة. الأوتوكلاف لمدة 20 دقيقة.
- إزالة الزجاجات من الأوتوكلاف ودوامة بلطف لتوزيع أجار.
- نقل الزجاجات إلى حمام مائي 50 درجة مئوية لمدة ساعة واحدة.
- بعد 1 ساعة، ونقل زجاجة إلى مجلس الوزراء السلامة البيولوجية وتحت ظروف معقمة، إضافة 1600 ميكرولتر من المعقمة 1 M MgSO4،والمضادات الحيوية المناسبة لوسائل الإعلام.
ملاحظة: بالنسبة للسلالات المقاومة للريفامبيسين PSTDC3000 وPstT1، استخدم ريفامبيسين المذاب في ثنائي ميثيل فورماميد بتركيز نهائي قدره 50 ميكروغرام/مل. استخدام cycloheximide المذاب في الإيثانول بتركيز نهائي قدره 50 ميكروغرام / مل لمنع نمو الفطريات على لوحات. - دوامة وسائل الإعلام بلطف لخلط ثم صب لتغطية الجزء السفلي من لوحات.
- السماح على الأقل 1 ساعة لوحات لترسيخ قبل تخزينها رأسا على عقب في 4 درجة مئوية.
5. الحفاظ على السلالات البكتيرية وظروف الثقافة
- الحفاظ على مخزون الجلسرين من مستعمرة واحدة من البكتيريا كما 1 مل من الثقافة البكتيرية المشبعة و 333 ميكرولتر من الجلسرين المعقم 80٪ في -80 درجة مئوية.
- تصحيح البكتيريا (أي، PstT1) من مخزون الجلسرين على KB أغار مع المضادات الحيوية المناسبة (القسم 4).
- السماح للبكتيريا لاسترداد لمدة 2 أيام في 28 درجة مئوية قبل streaking البكتيريا الطازجة على agar KB انتقائية باستخدام مسواك مسطحة معقمة.
- المتتالية البكتيريا الطازجة من مخزون الجلسرين على أنسب انتقائي KB أجار باستخدام مسواك مسطحة معقمة.
ملاحظة: تأكد من أن مخزون الجلسرين المصححة لا يزيد عمره عن أسبوعين. - لتوقيت المحيط الهاديDC3000، احتضان لوحة KB في 28 درجة مئوية لمدة 24 ساعة قبل استخدام البكتيريا في تجربة الفيضانات.
- بالنسبة لـ PstT1، قم باحتضان لوحة KB عند درجة حرارة 28 درجة مئوية لمدة 48 ساعة قبل استخدام البكتيريا في تجربة الفيضانات.
6. إعداد تلقيح PstT1
- التعيّد إعادة تعليق البكتيريا في العقيمة 10 mM MgCl2 إلى كثافة بصرية في 600 نانومتر (OD600)من 0.1، أو ما يقرب من 5 × 10⁷ وحدات تشكيل مستعمرة (CFU)/mL).
- تنفيذ تخفيف اتّسالة مُتَبَيّة باستخدام محلول مجمكل2 المُقمّى بمحلول 2 في خزانة السلامة البيولوجية. بالنسبة لـ PstT1 ، استخدم مقياس الطيف الضوئي لصنع التلقيح بتركيز يبدأ من OD600 = 0.1.
- بالنسبة لـ PstT1 ، قم بتخفيف 1/10 من إعادة التعليق الأولية عندOD 600 = 0.1 للحصول على تخفيف تسلسلي بتركيز OD600 = 0.01.
- باستخدام التخفيف التسلسلي في OD600 = 0.01 من الخطوة 6.3 ، وجعل تخفيف 3 /4 للحصول على OD النهائي600 = 0.0075.
- جعل تخفيف 1/10 من غير الأيونية organosilicone copolymer copolymer C13H34O4Si3 (أي، surfactant) في 10 mM MgCl2 والدوامة لمدة 15 s. إضافة الأسهم 1/10 من السطحي إلى تخفيف المسلسل الأخير (OD600 = 0.0075) إلى تركيز نهائي من 0.015٪ ودوامة
7. إعداد التطعيم DC3000 توقيت المحيط الهادي
- إعادة تعليق البكتيريا المعقمة في العقيمة 10 mM MgCl2 إلى كثافة بصرية في 600 نانومتر (OD600)من 0.1 (حوالي 5 × 10⁷ CFU / mL).
- تنفيذ تخفيف اتّسالة مُتَبَيّة باستخدام محلول مجمكل2 المُقمّى بمحلول 2 في خزانة السلامة البيولوجية. بالنسبة لـ PSTDC3000، استخدم مقياس الطيف الضوئي لصنع التلقيح بتركيز يبدأ من OD600 = 0.1.
- لتوقيت المحيط الهاديDC3000، وجعل تخفيف 1/10 من إعادة التعليق الأولي في OD600 = 0.1 للحصول على تخفيف المسلسل في تركيز OD600 = 0.01.
- باستخدام التخفيف التسلسلي في OD600 = 0.01 من الخطوة 3 ، وجعل تخفيف 1 /2 للحصول علىOD النهائي 600 = 0.005.
- جعل تخفيف 1/10 من السطحي في 10 mM MgCl2 والدوامة لمدة 15 s. إضافة الأسهم 1/10 من سوراكتفانت إلى التخفيف التسلسلي الأخير (OD600 = 0.005) إلى تركيز نهائي من 0.015٪ ودوامة جيدا لخلط.
8. طريقة فيضان شتلة الطماطم
- خذ الأطباق مع الشتلات التي يبلغ عمرها 10 أيام من غرفة النمو ووضعها في خزانة السلامة البيولوجية لإعداد الأطباق للفيضانات.
- إزالة الشريط الجراحي من طبقين.
- تعيين جهاز توقيت لمدة 3 دقائق. قياس 6 مل من التلقيح النهائي(PstT1 OD600 = 0.0075 [القسم 6] أو PSTDC3000 OD600 = 0.005 [القسم 7]) ونقل 6 مل من التلقيح إلى كل لوحة مع الشتلات 10-day.
- دفع بلطف الشتلات إلى أسفل في التلقيح مع طرف ماصة معقمة. بدء تشغيل جهاز ضبط الوقت.
- عقد لوحة واحدة في كل يد. إمالة الجزء الأمامي من لوحة إلى أسفل لتتراكم التلقيح وغمر أساسا cotyledons وأوراق الشتلات.
- حفيف الجانب إلى جانب 5-7x ومن ثم ترجيح لوحات مرة أخرى لتغطية الجذور ولوحة كاملة.
- إمالة لوحات إلى أسفل مرة أخرى لغمر cotyledons والأوراق، وكرر لما مجموعه 3 دقيقة.
- صب inoculum قبالة لوحات، تعيين لوحات أسفل على سطح مستو ومن ثم صب قبالة أي تلقيح المتبقية للمرة الثانية.
- أعد لف الأطباق بشريط جراحي وكرر الخطوات 8.2-8.8 لأي لوحات متبقية.
- إعادة احتضان لوحات في غرفة النمو (انظر الخطوة 3.11 ملاحظة) بعد أن غمرت جميع لوحات.
- النمط الظاهري بعد 7-10 أيام لتوقيت المحيط الهاديDC3000 أو 10-14 يوما لتوقيت المحيط الهاديT1 (القسم 11). في حالة إجراء عمليات فحص نمو بكتيرية، اجمع الأنسجة الورقية بعد 4 أيام (القسمان 9 و10) ثم النمط الظاهري (القسم 11). بدلا من ذلك، إجراء تحليل فينوتيبيك وتحاليل النمو البكتيري على مجموعات منفصلة من النباتات.
9. التعقيم السطحي للكوتيلدونات لشهادة نمو البكتيريا
- بعد أربعة أيام من الفيضانات وإعادة احتضان الشتلات في غرفة النمو (القسم 8) ، قم بإزالة الأطباق مع شتلات الطماطم من غرفة النمو.
- رقم الشتلات الفردية على الجزء الخارجي السفلي من لوحة حيث تعلق الشتلات على لوحة لكل نمط جيني.
- ملصق أنابيب مركزية دقيقة 1.5 مل مع أرقام الشتلات الفردية واستخدام ملقط نظيفة لإسقاط واحد 3 مم من البزة المعقمة borosilicate في كل أنبوب للاستخدام مع الخافق من خلال البز. (انظر ملاحظة في الخطوة 10.1.)
- ماسيت 200 ميكرولتر من 10 mM MgCl2 في كل أنبوب وأنابيب قريبة.
- إعداد الإيثانول 70٪ وصب 100 مل في كوب نظيف. صب 100 مل من العقيمة Ultrapure H2O في كوب منفصل ونظيف.
- تنظيف الفولاذ المقاوم للصدأ على التوالي غرامة نقطة ملقط مع نصائح مسننة مع الإيثانول. فتح لوحة قليلا للسماح إزالة العقيم من كوتيلدون واحد مع ملقط نظيفة.
- قرصة البتيول في قاعدة كوتيلدون لإزالة ورقة وإسقاط في الكأس مع الإيثانول 70٪ لتعقيم السطح لمدة 10 s. شطف كوتيلدون في Ultrapure H2O لمدة 10 s.
- وضع كوتيلدون على منشفة ورقية ولطخة الجافة مع مناديل العلوم الحساسة.
- تزن بشكل فردي كل كوتيلدون بعد التعقيم السطحي والنشاف، وتسجيل الوزن.
- ضع الكوتيلون في أنبوب طرد مركزي صغير تم إعداده مسبقًا 1.5 مل (من الخطوتين 9.3 و9.4) مع وضع النمط الجيني المقابل والرقم الفردي.
- إعادة ختم لوحات مع شريط معقم وإعادة احتضان الشتلات في غرفة النمو (انظر الخطوة 3.11 ملاحظة).
10. البكتريا النمو المنقّاة
- باستخدام عينات من الخطوة 9.10، تجانس الأنسجة باستخدام مضرب بُنّاز ة في 10 mM MgCl2 لمدة 1-2 دقيقة. إذا لم يكن النسيج مبجلًا بشكل كافٍ ، فأتجانس مرة أخرى.
ملاحظة: العديد من الشركات المصنعة تنتج المتجانسات البليزر البزة. عدد ونوع الخرز، فضلا عن الوقت التجانس والسرعة (إذا كان للبرمجة) ينبغي أن يكون الأمثل لكل نوع من المتجانسات. تأكد من أن العينات لا ترتفع حرارتها أثناء التجانس. - إضافة 800 ميكرولتر من 10 mM MgCl2 إلى كل أنبوب يحتوي على الأنسجة المبجلة من الخطوة 10.1 وعكس عدة مرات لخلط.
- إعداد تخفيف اتّصالية متسلسلة لكل عينة في 10 mM MgCl2 في 96 لوحة جيدة (100، 10-1، 10-2، 10-3، 10-4، 10-5)باستخدام ماصة متعددة القنوات(الشكل 2A).
- ماصة 5 μL من كل سلسلة تخفيف باستخدام ماصة متعددة القنوات على لوحة أغار KB (150 مم × 15 ملم) مع السيكلوهيكميد واختيار مناسب للسلالة البكتيرية من الفائدة (انظر الخطوة 4.8 ملاحظة). دع الأطباق تجف تماماً.
- احتضان لوحة رأسا على عقب في 28 درجة مئوية لمدة 36 ساعة، ثم تصور(الشكل 2B)المستعمرات على لوحات باستخدام المجهر تشريح لتحديد ما إذا كانت المستعمرات كبيرة بما يكفي لحساب.
ملاحظة: إذا لم تكن المستعمرات كبيرة بما فيه الكفاية، قم بإعادة احتضان اللوحات وإعادة التحقق من حجم المستعمرات كل بضع ساعات. عادة، المستعمرات هي العد ~ 36-48 ساعة بعد الحضانة.

الشكل 2: تخفيف اتّصال اتّصال لشتلات نموّ جرثوميّة. (أ)يتم تخفيف الأنسجة الورقية المبجلة من النباتات المصابة قبل عد المستعمرات. يتم إجراء التخفيفات في لوحة بئر 96 (100 غير مخفف). عادة، يتم تخفيف من10-1 إلى10-5. (ب)طلاء التخفيفات لعد مستعمرة البكتيرية. يتم مطلي ما مجموعه 5 ميكرولتر من كل عمود من سلسلة التخفيف، من الأكثر تمييع إلى الأكثر تركيزا. بعد أن تجف المستعمرات بالكامل ، يتم احتضان اللوحة عند 28 درجة مئوية لمدة 36-48 ساعة يتم حساب المستعمرات تحت مجهر تشريح 10x. يرجى الضغط هنا لعرض نسخة أكبر من هذا الرقم.
- عد المستعمرات تحت المجهر تشريح قبل دمج(الشكل 2B). عد المستعمرات من لوحات سلسلة تخفيف مع أقل من 100 مستعمرة.
- بعد الحصول على عدد مستعمرة(الشكل 2B)،تطبيع التهم إلى 0.01 غرام من الأنسجة للشتلات وتحويلها إلى سجل نمو البكتيريا(الجدول 1).
ملاحظة: متوسط كتلة صانع الأموال واحد-PtoS cotyledon هو 0.01 ز ويتم تحديد تجريبيا22.
| النمط الجيني1 عمود أ | وزن الأنسجة (ز) العمود B | # من المستعمرات في بقعة العمود C | عامل تخفيفللعمود 2 البقعة D | معدلة # من المستعمرات3 العمود هاء | عامل تخفيف لعمود التخفيف التسلسلي F | إجمالي # من المستعمرات العمود G (cfu/0.01 ز)4 | متوسط # المستعمرات (cfu/0.01 g) العمود H | متوسط نمو السجل (cfu/0.01 g (سجل10)) العمود الأول |
| عينة 1 | 0.004 جم | 10 | 200 | محسوبة على النحو التالي: (C2 × 0.01 غرام) / B2 = 25 | 1000 | محسوبة على النحو التالي: (D2 × E2 × F2) = 5000000 | متوسط العينة من 1 إلى العينة الأخيرة: (أي متوسط G1:G3) = 7000000 | سجل متوسط أي. سجل (H2) = 6.85 |
| عينة 2 | 0.003 جم | 15 | 200 | 50 | 1000 | 10000000 | ||
| عينة 3 | 0.002 جم | 6 | 200 | 30 | 1000 | 6000000 | ||
| 1 البيانات الموضحة لـ 3 عينات | ||||||||
| 2 على أساس الطلاء 5 ميكرولتر × 200 ل1 مل | ||||||||
| 3 Cotyledons صغيرة جدا إلى الأساسية حتى تم تطبيع التهم مستعمرة إلى 0.01 غرام من الأنسجة على أساس متوسط كتلة واحدة MoneyMaker -PtoS cotyledon (البيانات غير مبينة) | ||||||||
| 4 معدلة لكل مل على أساس حجم مطلي | ||||||||
الجدول 1: حسابات عينة لعينات نمو الشتلات البكتيرية. توضح حسابات العينات كيفية تطبيع العد البكتيري وتحديد نمو البكتيريا.
- بالنسبة للانضمامات البرية وغيرها من الخطوط ذات الخلفيات الوراثية المعقدة، يربط مستوى النمو البكتيري في الشتلات الفردية بالنمط الظاهري كما هو موضح في القسم 11.
11. Phenotyping للمقاومة
- إزالة لوحات من غرفة النمو والشتلات الفردية النمط الظاهري للموت (بسبب المرض) أو البقاء على قيد الحياة (بسبب المقاومة) بعد 7-14 يوما.
- النباتات النمط الظاهري المصابة بسلالة شديدة الخطورة مثل PSTDC3000 في وقت سابق ، في 7-10 أيام بعد تلقيح الفيضانات.
- النباتات النمط الظاهري المصابة بـ PstT1 بعد 10-14 يومًا من تلقيح الفيضانات.
- تحديد نظام تسجيل النقاط على أساس مجموعة من الأنماط الظاهرية المقاومة لوحظ. تسجيل الأنماط الظاهرية الثنائية للأصناف، وخطوط الأيزوجينية، والانضمامات البرية مع الأنماط الظاهرية المقاومة القوية إلى المتوسطة(الشكل 4A، 4B).
- إذا كانت الشتلات يعرض نمو جديد من meristem apical ضمن الإطار الزمني للفينوبطيب، عدها على أنها البقاء على قيد الحياة. إذا كانت الشتلات لديها ميريستيم بني الشكل ولا يعرض أي نمو نباتي أخضر جديد ، فعده كموت(الشكل 3).

الشكل 3: التمثيل التخطيطي لشتلات الطماطم. يتم تصوير أجزاء مختلفة من شتلة الطماطم ، بما في ذلك hypocotyl ، cotyledons ، epicotyl ، تبادل لاطلاق النار meristem apical ، والأوراق الحقيقية. يرجى الضغط هنا لعرض نسخة أكبر من هذا الرقم.
- تسجيل الأنماط الظاهرية على طيف مرض للسكان، مثل مجموعات رسم الخرائط F2، مع مجموعة واسعة من الأنماط الظاهرية المقاومة(الشكل 4C).
- مراقبة بعناية الشتلات لظهور أعراض المرض والموت لتحديد النافذة المناسبة للفينوبلي.

الشكل 4: التمثيل التخطيطي للأنماط الظاهرية المتوقعة لمقاومة الشتلات والموت في خلفيات وراثية مختلفة. (أ)يتم عرض شتلات ريو غراندي -PtoR وأصناف شبه الأيزوجينية ريو غراندي -PtoS بعد 7 أيام من الفيضانات مع PSTDC3000 (OD600 = 0.005) + 0.015٪ السطحي. يعرض RioGrande-PtoR مقاومة ثابتة، ويعرض RioGrande-PtoS قابلية مستمرة للعدوى بـ PSTDC3000. هذه الخطوط تؤدي إلى الأنماط الظاهرية المنفصلة والثنائية. (ب)يتم عرض شتلات الانضمام البرية ، مثل Solanum neorickii LA1329 ، بعد 10 أيام من الفيضانات مع PstT1 (OD600 = 0.0075) + 0.015٪ السطحي. الشتلات عرض تباين فينوتيبيك ولكن تم تسجيلها كأنماط ظاهرية ثنائية. وستتوقف كمية التباين في الفينوتيبيك وطريقة الفينوتيكل (المقاومة الثنائية أو طيف المقاومة) على الانضمام المعين الذي تم اختباره. (ج)قد يعرض رسم خرائط للمجموعات الناتجة عن تجاوز عمليات الانضمام البرية إلى الأصناف المعرضة للإصابة طيفاً أوسع من الأنماط الظاهرية في مجموعات الفصل في F2. في هذه الحالة، قد يكون من الأنسب تسجيل الأنماط الظاهرية للشتلات على الطيف. قد تكون الشتلات المعرضة للغاية من مجموعة رسم الخرائط فينوبتي لوفاة في وقت مبكر من اليوم 7 عندما غمرت مع T1 PST،وعادة ما تظهر meristem أبيسي، لا لتمديد القليل جدا من epicotyl، وليس جديد، النمو النباتي الأخضر. قد يبقى الميريستيم apical من الشتلات المعرضة الخضراء أو البني الفاتح جدا لمزيد من الوقت، وربما يكون هناك بعض امتداد epicotyl ونمو نباتي قليلا جدا، والذي يتحول البني والاعتقالات بحلول اليوم 10. يمكن أن تكون الشتلات الفردية فينوبتي للمقاومة على أساس كمية النمو النباتي ة الجديدة والجارية في اليوم 14. يمكن بعد ذلك تجميع الشتلات على أساس الأنماط الظاهرية الموصوفة أعلاه في فئات مختلفة من المقاومة مثل المقاومة الضعيفة أو المتوسطة أو القوية. يرجى الضغط هنا لعرض نسخة أكبر من هذا الرقم.
Subscription Required. Please recommend JoVE to your librarian.
Representative Results
الكشف عن مناعة PtoRبوساطة في الأصناف وخطوط isogenic باستخدام اختبار مقاومة الشتلات
يوضح الشكل 5 النتائج التمثيلية لصانع الأموال -PtoR وMoneymaker -PtoS cultivars 7-10 أيام بعد الفيضانات مع PSTDC3000. قبل الإصابة، ظهرت شتلات عمرها 10 أيام معروضة بالكامل وتوسعت الكوتيلدونات والأوراق الحقيقية الأولى الناشئة. غمرت الشتلات مع 10 MM MgCl2 + 0.015٪ السطحي كتحكم سلبي (البيانات غير مبين) وPSTDC3000 في كثافة بصرية من 0.005 + 0.015٪ surfactant. كانت الشتلات فينوبة 7-10 أيام بعد الفيضانات(الشكل 5). الشتلات الفردية من خطوط متجانسة الجينونا، مثلMoneymaker-PtoR وMoneymaker-PtoS تعطي الأنماط الظاهرية متسقة للغاية وثنائية في مقهيض فيضان الشتلات. عندما Moneymaker -PtoR، الذي يحمل الكتلة الجينية Pto / Prf (ن = 5) ، تم التعامل مع توقيت المحيط الهاديDC3000 في التركيز الأمثل من OD600 = 0.005 ، كانت المقاومة بسبب PtoR- بوساطة الحصانة قوية وتم تجسدها الجديدة ، والنمو النباتي الأخضر في جميع الأفراد22. شبه isogenic Moneymaker -PtoS شتلات (ن = 5) ، والتي لا يمكن التعرف على المؤثرات توقيت المحيط الهاديDC3000 AvrPto أو AvrPtoB ، توفي بسرعة في غضون 7 أيام بعد الفيضانات وكان مميز meristems البني apical ، ذرة بكتيرية ، الكلوروز ، وليس هناك علامات على جديد ، والنمو النباتي الأخضر(الشكل 5).

الشكل 5: التوصيف Phenotypic من أعراض المقاومة أو المرض 7-10 أيام بعد العدوى في الأصناف. نمت Moneymaker-PtoR وصانع الأموال-PtoS شتلات الطماطم على لوحات 0.5x MS لمدة 10 أيام قبل أن تغمرها المياه مع P. syringae pv. طماطم DC3000 (OD600 = 0.005) + 0.015% السطحي. نجا صانع المال - شتلاتPtoR (ن = 5) وMoneymaker -PtoS الشتلات (ن = 5) توفي. ويظهر عدد الشتلات الباقية لكل نمط جيني من إجمالي عدد الشتلات التي تم اختبارها. مقياس شريط = 1 سم. الرجاء انقر هنا لعرض نسخة أكبر من هذا الرقم.
فحص Phenotypic من الانضمامات البرية باستخدام فحص مقاومة الشتلات
يوضح الشكل 6 النتائج التمثيلية لشتلات الانضمامات المعرضة والمقاومة بعد 10-14 يومًا من الفيضانات مع PstT1. وتشمل الانضمامات عرضة RG-PtoR، S. pimpinellifolium LA1375، وS. pimpinellifolium LA1606، والانضمامات المقاومة تشمل S. neorickii LA1329. وغمرت الشتلات التي يبلغ عمرها عشرة أيام مع 10 MM MgCl2 + 0.015٪ السطحي كتحكم سلبي، وPstT1 بكثافة بصرية 0.0075 + 0.015٪ السطحي. كانت الشتلات فينوبست بعد 10 أيام على الأقل من الفيضانات ، حيث ماتت الشتلات المصابة بـ PstT1 ببطء أكثر من الشتلات المصابة PSTDC3000. كانت الشتلات المنوّجة خضراء وصحية وتنمو بنشاط. هذه الرقابة مهمة لضمان أن الانضمامات ليست حساسة لتركيز السطحي، وضمان عدم وجود تلوث بكتيري. الانضمامات الحساسة (ريو غراندي -PtoR [n = 7] ، S. pimpinellifolium LA1375 [n = 7] ، وS. pimpinellifolium LA1606 [n = 5]) كانت ميتة ، وكان البني meristems apical ، وتفتقر إلى نمو جديد 10-14 يوما بعد تلقيح مع توقيت المحيط الهاديT1. في المقابل، اثنين S. neorickii LA1329 (ن = 3) الشتلات عرض مستوى عال من النمو الأخضر الجديد ونجا العدوى مع توقيت المحيط الهاديT1(الشكل 6). لم تنبت ثلاث شتلات LA1329. وعادة ما يتم فحص 5-7 أفراد لكل انضمام في شاشة أولية لتحديد مدى انتشار المقاومة بين السكان. عندما يتم غمر الانضمام البرية أكثر تعقيدا وراثيا، مثل LA1329، مع توقيت المحيط الهاديT1، والظواهر المقاومة عرض أكثر قليلا من التباين بين الشتلات الفردية، بالمقارنة مع Moneymaker-PtoR تعامل مع توقيت المحيط الهاديDC3000. ومع ذلك، كانت الأنماط الظاهرية المقاومة عادة أقل متغيرة من تلك التي شوهدت في مجموعات رسم الخرائط F2. وهكذا، تم استخدام معايير الفينيوبة الثنائية لLA1329.

الشكل 6: التوصيف الفينوتيبيكي للمقاومة أو أعراض المرض 10-14 يوما بعد العدوى في الانضمامات البرية. ريو غراندي-PtoR، S. pimpinellifolium LA1606 ، S. pimpinellifolium LA1375 و S. neorickii LA1329 شتلات الطماطم نمت على لوحات 0.5x MS لمدة 10 أيام ، ثم غمرت مع توقيت المحيط الهاديT1 (OD600 = 0.0075) + 0.015٪ السطحي. ويظهر عدد الشتلات الباقية لكل انضمام بري من العدد الإجمالي الذي تم اختباره. مقياس شريط = 1 سم. الرجاء انقر هنا لعرض نسخة أكبر من هذا الرقم.
التقييم الكمي للنمو البكتيري باستخدام كمية الشتلات الفيضانات
للتأكد من أن المقاومة الملاحظة في LA1329 إلى PstT1 أدت إلى انخفاض النمو البكتيري ، تم إجراء تحليل النمو البكتيري في شتلات الطماطم. تم تحديد مستوى نمو PstT1 في Moneymaker-PtoS و S. neorickii LA1329 لمدة 4 أيام بعد الإصابة. صانع المال-PtoS هو خط شبه isogenic مع قابلية متسقة بين الشتلات الفردية. غالبًا ما تكون الانضمامات البرية مثل S. neorickii LA1329 أكثر تعقيدًا وراثيًا. LA1329 يعرض ما يقرب من 60٪ مقاومة لتوقيت المحيط الهاديT1 عبر السكان22. لأن الشتلات قد إسقاط cotyledons بعد العدوى، نمت شتلة واحدة على كل لوحة لربط النمو البكتيري في كوتيلدون حصادها مع البقاء على قيد الحياة الشتلات الشاملة أو الموت كما تم تحديد phenotypically على الأقل 10 أيام بعد الفيضانات. تم تطبيع العد البكتيري في اليوم 4 لكل شتلة إلى 0.01 غرام من الأنسجة وتحويلها إلى نمو السجل (CFU/0.01 ز (سجل10)). تم تجميع نمو السجل لشتلات LA1329 المقاومة للفينونموذجي (LA1329RES) أو شتلات معرضة للظاهرة (LA1329SUS)بشكل منفصل ومقارنتها ببعضها البعض وصنف صانع الأموال المعرضللة -PtoS. على سبيل المثال، كان هناك فرق سجل 1.7 في النمو البكتيري بين LA1329RES (سجل 6.3) و LA1329SUS (سجل 8.0)، و1.6 فرق السجل بين LA1329RES (سجل 6.3) وصانعالأموال- PtoS (سجل 7.9)(الشكل 7). لذلك ، ترتبط المقاومة الفينوتيبيك مع المقاومة الكمية في تحليل الشتلات.

الشكل 7: مقاومة سولانوم neorickii LA1329 الشتلات دعم نمو البكتيريا أقل من صانع المال-PtoS أو عرضة S. neorickii LA1329. تم تحديد التهم البكتيرية 4 أيام بعد التطعيم من S. neorickii LA1329 (ن = 14) وصانع الأموال -PtoS (ن = 10) الشتلات المصابة بPstT1 وتم إجراء التطبيع إلى 0.01 غرام من الأنسجة. بالنسبة لـ LA1329، تم ملاحظة مجموعتي الفينوتيبيك، المعرضتين (SUS) أو المقاومة (RES)، والعد بشكل منفصل. فوق الشريط * = فرق مهم إحصائيًا يحدده تحليل عامل واحد للتباين. تم استخدام إجراء نموذج خطي عام (p < 0.001) يليه مقارنة متعددة للوسائل باستخدام اختبار Tukey بعد مخصص. أشرطة الخطأ = خطأ قياسي. يشير الرقم إلى تجربة تمثيلية واحدة. يرجى الضغط هنا لعرض نسخة أكبر من هذا الرقم.
Subscription Required. Please recommend JoVE to your librarian.
Discussion
ويرد وصف بروتوكول لتلقيح الفيضانات مع توقيت المحيط الهاديDC3000 أو توقيت المحيط الهاديT1 الأمثل للكشف عن مقاومة لهذه السلالات البكتيرية في شتلات الطماطم. هناك العديد من المعلمات الحرجة للحصول على النتائج المثلى في تحليل مقاومة الشتلات ، بما في ذلك التركيز البكتيري وتركيز السطحي ، والتي تم تحديدها تجريبيًا22. لتوقيت المحيط الهاديDC3000، تم تحسين الكثافة البصرية لتحقيق البقاء على قيد الحياة كاملة على أصناف مقاومة تحتوي على الكتلة Pto / Prf والموت الكامل على أصناف عرضة تفتقر إلى الكتلة Pto / Prf 22. لسلالة مثل توقيت المحيط الهاديT1، حيث لا توجد أصناف مقاومة معروفة، تم تحسين الكثافة البصرية لتكون أدنى مستوى ممكن لوفاة النبات متسقة وكاملة22. صمم Uppalapati وآخرون24 فحص شتلة الطماطم للتحقيق في الإمراض من PSTDC3000 ووظيفة الفوعة من الإكليل. في هذا النضارة، تم إجراء العدوى باستخدام البكتيريا المركزة إلى OD600 من 0.124، 20x أعلى من الكثافة البصرية للسلالات المستخدمة في مقدرة مقاومتنا. التعرف على PSTDC3000 المؤثرات AvrPto و AvrPtoB في شتلات الطماطم تحمل نتائج الكتلة الجينية Pto / Prf في ETI وHR22العيانية . في سياق استجابة مناعية قوية مثل ETI ، تم استخدام تتر بكتيري أقل لتوقيت المحيط الهاديDC3000 لتجنب المقاومة الوراثية الساحقة من الكتلة الجينية Pto / Prf 22. بالإضافة إلى ذلك ، تشير هذه النتائج إلى أن التركيز البكتيري العالي يمكن أن يطغى على الاستجابات المناعية الأضعف مثل PTI أو المقاومة الجزئية الكمية ، حيث تساهم جينات متعددة في النمط الظاهري العام. السطح هو ضروري للبكتيريا للتمسك سطح ورقة; ومع ذلك ، يمكن أن تسبب تركيزات عالية الكلوروزمنت من ورقة22. لقد اختبرنا في السابق مجموعة من تركيزات السطحي لتحديد التركيز المثالي في شتلات الطماطم التي يبلغ عمرها 10 أيام22. عند اختبار الأنواع الجديدة التي قد تختلف في حساسيتها لالسطحي، ينبغي تحسين تركيز السطحي لتحديد تركيز لا يسبب الضرر أو الكلوروسورس في غياب البكتيريا. تتطلب ظروف التخمة المناسبة تحسين تركيز السطحي الذي لا يسبب ضررًا ، وتركيزًا بكتيريًا يسبب المرض في جميع الضوابط المعرضة.
وتشمل المعلمات الحرجة الإضافية للنجاح في فحص فيضان الشتلات استخدام الشتلات في مراحل نمو محددة (شتلات عمرها 10 أيام)(الشكل 1)،والحفاظ على ظروف غرفة النمو المستقرة (شدة الضوء حوالي 200 ميكرون م-2 s-1،ودرجة حرارة ثابتة من 22 درجة مئوية، و 16 ساعة من الضوء) وإجراء التجارب في خزانة السلامة البيولوجية العقيمة. قد يؤثر حجم الوسائط فوق 45 مل أو أقل من 35 مل على الوفاة المتسقة للضوابط المعرضة للخطر ، لأن الحجم قد يؤثر على البيئة الدقيقة المحيطة بالشتلات على اللوحة. على سبيل المثال ، يمكن أن تؤثر الاختلافات في الرطوبة النسبية داخل اللوحات المغلقة على عدوى البكتيريا وقدرة النباتات على البقاء على قيد الحياة. تقنية العقيمة أمر بالغ الأهمية، لأن التلوث على لوحات قد الخلط بين مصدر الموت أو الحساسية في الشتلات. بالإضافة إلى ذلك ، نظرًا لأن التفاعلات بين النباتات ومسببات الأمراض تتأثر بالساعة circadian24،25،26، فمن المستحسن أن تصاب النباتات في وقت ثابت من اليوم.
Pst هو عامل ممرض في الأوراق التي تستعمر بشكل تفضيلي الأجزاء الجوية من شتلات الطماطم ، بما في ذلك cotyledons24 (الشكل 3). لذلك ، تركز الفينيوبينة النوعية في فحص فيضان الشتلات على أعراض النمو والمرض في الأجزاء الجوية من الشتلات ، ويتم أخذ عينات من الأنسجة الخاصة بعملية فحص النمو البكتيري ة من الكوتيلدون للتحليل الكمي. بعد تلقيح الفيضان، قد تموت الشتلات في غضون 7-10 أيام بعد التطعيم مع PSTDC3000 أو 10-14 يوما بعد التطعيم مع توقيت المحيط الهاديT1، كما نوقش في القسم 11. يتم تصور الموت الشتلات من قبل meristem أبيسي البني، والإستطالة epicotyl القبض، و / أو القبض على النمو النباتي. إذا تم استخدام سلالات بكتيرية مختلفة ، يجب تحديد التوقيت تجريبيًا. وبالإضافة إلى ذلك، ينبغي رصد تطور المرض على نباتات المكافحة يومياً بعد الفيضانات إلى أن يتسنى تحديد إطار زمني متسق من بداية أعراض المرض إلى وفاة الشتلات. اعتمادا على الأنماط الجينية والعلاجات المستخدمة في فحص الفيضانات، يمكن تسجيل الأنماط الظاهرية للشتلات كأنواع ظاهرية ثنائية أو على طيف مرض(الشكل 4). ويمكن ملاحظة طيف أوسع من الأنماط الظاهرية عند تلقيح الفيضان لأعداد خرائط F2 من انضمامات الطماطم البرية التي عبرت إلى أصناف معرضة للخطر(الشكل 4C). قد يكون من الأفضل للنمط الظاهري فصل السكان على طيف المرض اعتمادا على مدى سرعة الشتلات يموت ودرجة النمو النباتي الجديد والتفريع(الشكل 4C). ويمكن أيضا أن تستخدم في فحص فيضان الشتلات بالتزامن مع فحص نمو الشتلات البكتيرية لتقييم كميا مستويات النمو البكتيري المرتبطة الأنماط الظاهرية النوعية في الشتلات الفردية(الشكل 7). تخفيضات كبيرة جدا (أي ~ سجل 3) في النمو البكتيري أو مقاومة قوية في الشتلات المقاومة للانضمام البرية بالمقارنة مع أصناف عرضة تشير إلى أن الأساس الوراثي الكامن وراء المقاومة قد يكون بسبب ETI22. قد تكون التخفيضات الأصغر في النمو البكتيري (أي ~ سجل 1.7) ، كما لوحظ في شتلات LA1329 ، راجعة إلى مساهمة مقاومة أضعف من السمة الكمية loci و / أو PTI. وبالتالي ، يمكن أن يكون فحص نمو الشتلات أداة مهمة في زيادة توصيف المقاومة في خطوط الطماطم البرية.
عادة، وقد أجريت الشاشات الوراثية على نباتات الطماطم البالغة من أربعة إلى خمسة أسابيع لتحديد الأساس الوراثي للمقاومة P. syringae في الانضمامالبرية20،21. تتطلب نباتات الطماطم البالغة أوقات نمو أطول بكثير ، وتتطلب مساحة أكبر في غرفة النمو ، وهي نباتات أكبر بكثير ، مما يعني أنه عادة ً ما يتم فحص عدد قليل من الأفراد لكل سطر. يوفر اختبار فيضان الشتلات نهجًا بديلًا قويًا في تحديد مقاومة P. syringae في انضمامات الطماطم البرية. يسمح الفحص في مرحلة الشتلات باختبار حجم عينة كبير يمكن أن يكون مفيدًا بشكل خاص في اكتشاف المقاومة في المجموعات السكانية المعقدة وراثيًا. ويؤدي انخفاض متطلبات حيز غرف النمو ووقت النمو إلى تيسير اتباع نهج عالي الإنتاجية والكشف السريع عن المقاومة الطبيعية في حالات الانضمام البرية إلى مسببات الأمراض الناشئة. وعلاوة على ذلك، لا تقتصر مقاومة P. syringae التي تم تحديدها في مرحلة الشتلات في هذا الجزاق على مرحلة النمو. S. neorickii LA1329 و S. habrochaites LA1253 تم تحديدها في البداية في مرحلة الشتلات وأيضا عرض المقاومة لتوقيت المحيط الهاديT1 في النباتات الكبار كما وصفت سابقا22.
فحص فيضان الشتلات هو بروتوكول متعدد الاستخدامات يمكن تعديله وتحسينه للكشف عن مقاومة المضيف لسلالات P. syringae الأخرى. ويمكن زيادة تطبيقه في سياق مسببات الأمراض البكتيرية المختلفة للطماطم، مثل أنواع زانثوونا. هذه الطريقة سوف تعجل البحث عن مصادر جديدة لمقاومة الأمراض لمسببات الأمراض البكتيرية.
Subscription Required. Please recommend JoVE to your librarian.
Disclosures
وليس لدى صاحبي البلاغ ما يكشفان عنه.
Acknowledgments
نشكر جيمي كالما لاختبار تأثير حجم وسائل الإعلام على نتائج المرض أو المقاومة. نشكر الدكتور ة مايل بودين والدكتور كارل ج. شيبر من مختبر لويس على تقديم تعليقات واقتراحات بناءة حول المخطوطة. تم دعم البحوث على مناعة النبات في مختبر لويس من قبل وزارة الزراعة الأمريكية ARS 2030-21000-046-00D و 2030-21000-050-00D (JDL)، ومديرية NSF للعلوم البيولوجية IOS-1557661 (JDL).
Materials
| Name | Company | Catalog Number | Comments |
| 3M Tape Micropore 1/2" x 10 YD CS 240 (1.25 cm x 9.1 m) | VWR International | 56222-182 | |
| 3mm borosilicate glass beads | Friedrich & Dimmock | GB3000B | |
| Bacto peptone | BD | 211677 | |
| Bacto agar | BD | 214010 | |
| Biophotometer Plus | Eppendorf | E952000006 | |
| Biosafety cabinet, class II type A2 | |||
| BRAND Disposable Plastic Cuvettes, Polystyrene | VWR International | 47744-642 | |
| Chenille Kraft Flat Wood Toothpicks | VWR International | 500029-808 | |
| cycloheximide | Research Products International | C81040-5.0 | |
| Dibasic potassium phosphate anhydrous, ACS grade | Fisher Scientific | P288-500 | |
| Dimethylformamide | |||
| Dissecting microscope (Magnification of at least 10x) | |||
| Ethanol - 190 Proof | |||
| Falcon polystyrene 96 well microplates, flat-bottom | Fisher Scientific | 08-772-3 | |
| Glass Alcohol Burner Wick | Fisher Scientific | S41898A / No. W-125 | |
| Glass Alcohol Burners | Fisher Scientific | S41898 / No. BO125 | |
| Glycerol ACS reagent | VWR International | EMGX0185-5 | |
| Kimberly-Clark™ Kimtech Science™ Kimwipes™ Delicate Task Wipers | Fisher Scientific | 06-666-A | |
| Magnesium chloride, ACS grade | VWR International | 97061-356 | |
| Magnesium sulfate heptahydrate, ACS grade | VWR International | 97062-130 | |
| Microcentrifuge tubes, 1.5 mL | |||
| Microcentrifuge tubes, 2.2 mL | |||
| Mini Beadbeater-96, 115 volt | Bio Spec Products Inc. | 1001 | |
| Murashige & Skoog, Basal Salts | Caisson Laboratories, Inc. | MSP01-50LT | |
| Pipet-Lite XLS LTS 8-CH Pipet 20-200uL | Rainin | L8-200XLS | |
| Pipet-Lite XLS LTS 8-CH Pipet 2-20uL | Rainin | L8-20XLS | |
| Polystyrene 100mm x 25mm sterile petri dish | VWR International | 89107-632 | |
| Polystyrene 150mm x 15mm sterile petri dish | Fisher Scientific | FB08-757-14 | |
| Polystyrene 150x15mm sterile petri dish | Fisher Scientific | 08-757-148 | |
| Pure Bright Germicidal Ultra Bleach 5.7% Available Chlorine (defined as 100% bleach) | Staples | 1013131 | |
| Rifampicin | Gold Biotechnology | R-120-25 | |
| Silwet L-77 (non-ionic organosilicone surfactant co-polymer C13H34O4Si3 surfactant) | Fisher Scientific | NCO138454 | |
| Tips LTS 20 μL 960/10 GPS-L10 | Rainin | 17005091 | |
| Tips LTS 250 μL 960/10 GPS-L250 | Rainin | 17005093 | |
| VWR dissecting forceps fine tip, 4.5" | VWR International | 82027-386 |
References
- Underwood, W., Melotto, M., He, S. Y. Role of plant stomata in bacterial invasion. Cell Microbiology. 9 (7), 1621-1629 (2007).
- Zipfel, C. Early molecular events in PAMP-triggered immunity. Current Opinion in Plant Biology. 12 (4), 414-420 (2009).
- Galan, J. E., Wolf-Watz, H. Protein delivery into eukaryotic cells by type III secretion machines. Nature. 444 (7119), 567-573 (2006).
- Lewis, J. D., Desveaux, D., Guttman, D. S. The targeting of plant cellular systems by injected type III effector proteins. Seminars in Cell and Developmental Biology. 20 (9), 1055-1063 (2009).
- Schreiber, K. J., Baudin, M., Hassan, J. A., Lewis, J. D. Die another day: molecular mechanisms of effector-triggered immunity elicited by type III secreted effector proteins. Seminars in Cell and Developmental Biology. 56, 124-133 (2016).
- Heath, M. C. Hypersensitive response-related death. Plant Molecular Biology. 44 (3), 321-334 (2000).
- Boyd, L. A., Ridout, C., O'Sullivan, D. M., Leach, J. E., Leung, H. Plant-pathogen interactions: disease resistance in modern agriculture. Trends in Genetics. 29 (4), 233-240 (2013).
- Pitblado, R. E., MacNeill, B. H. Genetic basis of resistance to Pseudomonas syringae pv. tomato in field tomatoes. Canadian Journal of Plant Pathology. 5 (4), 251-255 (1983).
- Pedley, K. F., Martin, G. B. Molecular basis of Pto-mediated resistance to bacterial speck disease in tomato. Annual Reviews of Phytopathology. 41, 215-243 (2003).
- Ronald, P. C., Salmeron, J. M., Carland, F. M., Mehta, A. Y., Staskawicz, B. J. The cloned avirulence gene AvrPto induces disease resistance in tomato cultivars containing the Pto resistance gene. Journal of Bacteriology. 174 (5), 1604-1611 (1992).
- Martin, G. B., et al. Map-based cloning of a protein kinase gene conferring disease resistance in tomato. Science. 262 (5138), 1432-1436 (1993).
- Salmeron, J. M., Barker, S. J., Carland, F. M., Mehta, A. Y., Staskawicz, B. J. Tomato mutants altered in bacterial disease resistance provide evidence for a new locus controlling pathogen recognition. Plant Cell. 6 (4), 511-520 (1994).
- Salmeron, J. M., et al. Tomato Prf is a member of the leucine-rich repeat class of plant disease resistance genes and lies embedded within the Pto kinase gene cluster. Cell. 86 (1), 123-133 (1996).
- Scofield, S. R., et al. Molecular basis of gene-for-gene specificity in bacterial speck disease of tomato. Science. 274 (5295), 2063-2065 (1996).
- Kunkeaw, S., Tan, S., Coaker, G. Molecular and evolutionary analyses of Pseudomonas syringae pv. tomato race 1. Molecular Plant-Microbe Interactions. 23 (4), 415-424 (2010).
- Cai, R., et al. The plant pathogen Pseudomonas syringae pv. tomato is genetically monomorphic and under strong selection to evade tomato immunity. PLoS Pathogens. 7 (8), 1002130 (2011).
- Almeida, N. F., et al. A draft genome sequence of Pseudomonas syringae pv. tomato T1 reveals a type III effector repertoire significantly divergent from that of Pseudomonas syringae pv. tomato DC3000. Molecular Plant-Microbe Interactions. 22 (1), 52-62 (2009).
- Lin, N. C., Abramovitch, R. B., Kim, Y. J., Martin, G. B. Diverse AvrPtoB homologs from several Pseudomonas syringae pathovars elicit Pto-dependent resistance and have similar virulence activities. Applied and Environmental Microbiology. 72 (1), 702-712 (2006).
- Rose, L. E., Langley, C. H., Bernal, A. J., Michelmore, R. W. Natural variation in the Pto pathogen resistance gene within species of wild tomato (Lycopersicon). I. Functional analysis of Pto alleles. Genetics. 171 (1), 345-357 (2005).
- Thapa, S. P., Miyao, E. M., Davis, R. M., Coaker, G. Identification of QTLs controlling resistance to Pseudomonas syringae pv. tomato race 1 strains from the wild tomato Solanum habrochaites LA1777. Theoretical and Applied Genetics. 128 (4), 681-692 (2015).
- Bao, Z. L., et al. Identification of a candidate gene in Solanum habrochaites for resistance to a race 1 strain of Pseudomonas syringae pv. tomato. Plant Genome. 8 (3), 1-15 (2015).
- Hassan, J. A., Zhou, Y. J., Lewis, J. D. A rapid seedling resistance assay identifies wild tomato lines that are resistant to Pseudomonas syringae pv. tomato race 1. Molecular Plant-Microbe Interactions. 30 (9), 701-709 (2017).
- King, E. O., Ward, M. K., Raney, D. E. Two simple media for the demonstration of pyocyanin and fluorescin. Journal of Laboratory and Clinical Medicine. 44 (2), 301-307 (1954).
- Uppalapati, S. R., et al. Pathogenicity of Pseudomonas syringae pv. tomato on tomato seedlings: phenotypic and gene expression analyses of the virulence function of coronatine. Molecular Plant-Microbe Interactions. 21 (4), 383-395 (2008).
- Bhardwaj, V., Meier, S., Petersen, L. N., Ingle, R. A., Roden, L. C. Defence responses of Arabidopsis thaliana to infection by Pseudomonas syringae are regulated by the circadian clock. PLoS One. 6 (10), 26968 (2011).
- Lu, H., McClung, C. R., Zhang, C. Tick tock: circadian regulation of plant innate immunity. Annual Review of Phytopathology. 55, 287-311 (2017).
- Wang, W., et al. Timing of plant immune responses by a central circadian regulator. Nature. 470 (7332), 110-114 (2011).
Tags
الهندسة الحيوية، العدد 157، Pseudomonas syringae،الطماطم، ومقاومة الأمراض، والشاشة، والنمو البكتيري، والأنماط الظاهريةErratum
Formal Correction: Erratum: High-Throughput Identification of Resistance to Pseudomonas syringae pv. Tomato in Tomato using Seedling Flood Assay
Posted by JoVE Editors on 10/18/2023.
Citeable Link.
An erratum was issued for: High-Throughput Identification of Resistance to Pseudomonas syringae pv. Tomato in Tomato using Seedling Flood Assay. The Introduction, Protocol, Representative Results and Discussion sections were updated.
The last paragraph of the Introduction section was updated from:
In the seedling flood assay described in this protocol, tomato seedlings are grown on Petri dishes of sterile Murashige and Skoog (MS) media for 10 days and then are flooded with an inoculum containing the bacteria of interest and a surfactant. Following flooding, seedlings can be quantitatively evaluated for disease resistance via bacterial growth assays. Additionally, seedling survival or death can act as a discrete resistance or disease phenotype 7–14 days after flooding. This approach offers a high-throughput alternative for screening large numbers of wild tomato accessions for resistance to Pst race 1 strains, such as Pst strain T1 (PstT1), and can easily be adapted to other bacterial strains of interest.
to:
In the seedling flood assay described in this protocol, tomato seedlings are grown on Petri dishes of sterile Murashige and Skoog (MS) media for 10 days and then are flooded with an inoculum containing the bacteria of interest and a surfactant. Following flooding, seedlings can be quantitatively evaluated for disease resistance via bacterial growth assays. Additionally, seedling survival or death can act as a discrete resistance or disease phenotype 7–14 days after flooding. This approach offers a high-throughput alternative for screening large numbers of wild tomato accessions for resistance to Pst race 1 strains, such as Pst strain 19 (Pst19), and can easily be adapted to other bacterial strains of interest.
Step 4.8 of the Protocol section was updated from:
- After 1 h, transfer the bottle to the biosafety cabinet and under aseptic conditions, add 1,600 µL of sterile 1 M MgSO4, and appropriate antibiotics to the media.
NOTE: For rifampicin resistant strains PstDC3000 and PstT1, use rifampicin dissolved in dimethylformamide at a final concentration of 50 µg/mL. Use cycloheximide dissolved in ethanol at a final concentration of 50 µg/mL to prevent fungal growth on the plates.
to:
- After 1 h, transfer the bottle to the biosafety cabinet and under aseptic conditions, add 1,600 µL of sterile 1 M MgSO4, and appropriate antibiotics to the media.
NOTE: For rifampicin resistant strains PstDC3000 and Pst19, use rifampicin dissolved in dimethylformamide at a final concentration of 50 µg/mL. Use cycloheximide dissolved in ethanol at a final concentration of 50 µg/mL to prevent fungal growth on the plates.
Step 5.2 of the Protocol section was updated from:
- Patch bacteria (i.e., PstT1) from a glycerol stock onto KB agar with appropriate antibiotics (section 4).
to:
- Patch bacteria (i.e., Pst19) from a glycerol stock onto KB agar with appropriate antibiotics (section 4).
Step 5.6 of the Protocol section was updated from:
- For PstT1, incubate the KB plate at 28 ˚C for 48 h prior to using bacteria in the flood experiment.
to:
- For Pst19, incubate the KB plate at 28 ˚C for 48 h prior to using bacteria in the flood experiment.
Step 6 of the Protocol section was updated from:
6. Preparation of PstT1 inoculum
to
6. Preparation of Pst19 inoculum
Step 6.2 of the Protocol section was updated from:
- Perform serial dilutions using sterile 10 mM MgCl2 solution in the biosafety cabinet. For PstT1, use a spectrophotometer to make inoculum with a starting concentration of OD600 = 0.1.
to:
- Perform serial dilutions using sterile 10 mM MgCl2 solution in the biosafety cabinet. For Pst19, use a spectrophotometer to make inoculum with a starting concentration of OD600 = 0.1.
Step 6.3 of the Protocol section was updated from:
- For PstT1, make a 1/10 dilution from the initial resuspension at OD600 = 0.1 to obtain a serial dilution at a concentration of OD600 = 0.01.
to:
- For Pst19, make a 1/10 dilution from the initial resuspension at OD600 = 0.1 to obtain a serial dilution at a concentration of OD600 = 0.01.
Step 8.3 of the Protocol section was updated from:
- Set a timer for 3 min. Measure 6 mL of final inoculum (PstT1 OD600 = 0.0075 [section 6] or PstDC3000 OD600 = 0.005 [section 7]) and transfer 6 mL of inoculum to each plate with the 10-day-old seedlings.
to:
- Set a timer for 3 min. Measure 6 mL of final inoculum (Pst19 OD600 = 0.0075 [section 6] or PstDC3000 OD600 = 0.005 [section 7]) and transfer 6 mL of inoculum to each plate with the 10-day-old seedlings.
Step 8.11 of the Protocol section was updated from:
- Phenotype after 7–10 days for PstDC3000 or 10–14 days for PstT1 (section 11). If carrying out bacterial growth assays, collect leaf tissue after 4 days (sections 9 and 10) and then phenotype (section 11). Alternatively, perform phenotypic analysis and bacterial growth assays on separate sets of plants.
to:
- Phenotype after 7–10 days for PstDC3000 or 10–14 days for Pst19 (section 11). If carrying out bacterial growth assays, collect leaf tissue after 4 days (sections 9 and 10) and then phenotype (section 11). Alternatively, perform phenotypic analysis and bacterial growth assays on separate sets of plants.
Step 10.7 of the Protocol section was updated from:
- After obtaining colony counts (Figure 2B), normalize the counts to 0.01 g of tissue for seedlings and convert to log bacterial growth (Table 1).
NOTE: The average mass of one Moneymaker-PtoS cotyledon is 0.01 g and is empirically determined22.
| Genotype1 Column A | Tissue Weight (g) Column B | # of Colonies in a spot Column C | Dilution factor for spot2 Column D | Adjusted # of Colonies3 Column E | Dilution factor for serial dilution Column F | Total # of Colonies Column G (cfu/0.01 g)4 | Average # of Colonies (cfu/0.01 g) Column H | Average Log Growth (cfu/0.01 g (log10)) Column I |
| Sample 1 | 0.004 g | 10 | 200 | calculated as: (C2 x 0.01 g) / B2 = 25 | 1000 | calculated as: (D2 x E2 x F2) = 5000000 | average for sample 1 through last sample: (ie. average G1:G3) = 7000000 | log of average ie. log(H2) = 6.85 |
| Sample 2 | 0.003 g | 15 | 200 | 50 | 1000 | 10000000 | ||
| Sample 3 | 0.002 g | 6 | 200 | 30 | 1000 | 6000000 | ||
| 1Data shown for 3 samples | ||||||||
| 2Based on plating 5 µL x 200 for 1 mL | ||||||||
| 3Cotyledons are too small to core so colony counts were normalized to 0.01 g of tissue based on the average mass of one MoneyMaker-PtoS cotyledon (data not shown) | ||||||||
| 4Adjusted per mL based on volume plated | ||||||||
Table 1: Sample calculations for seedling bacterial growth assay. Sample calculations demonstrate how to normalize bacterial counts and determine log bacterial growth.
to:
- After obtaining colony counts (Figure 2B), normalize the counts to 0.1 g of tissue for seedlings and convert to log bacterial growth (Table 1).
NOTE: The average mass of one Moneymaker-PtoS cotyledon is 0.1 g and is empirically determined22.
| Genotype1 Column A | Tissue Weight (g) Column B | # of Colonies in a spot Column C | Dilution factor for spot2 Column D | Adjusted # of Colonies3 Column E | Dilution factor for serial dilution Column F | Total # of Colonies Column G (cfu/0.01 g)4 | Average # of Colonies (cfu/0.01 g) Column H | Average Log Growth (cfu/0.1 g (log10)) Column I |
| Sample 1 | 0.04 g | 10 | 200 | calculated as: (C2 x 0.1 g) / B2 = 25 | 1000 | calculated as: (D2 x E2 x F2) = 5000000 | average for sample 1 through last sample: (ie. average G1:G3) = 7000000 | log of average ie. log(H2) = 6.85 |
| Sample 2 | 0.03 g | 15 | 200 | 50 | 1000 | 10000000 | ||
| Sample 3 | 0.02 g | 6 | 200 | 30 | 1000 | 6000000 | ||
| 1Data shown for 3 samples | ||||||||
| 2Based on plating 5 µL x 200 for 1 mL | ||||||||
| 3Cotyledons are too small to core so colony counts were normalized to 0.1 g of tissue based on the average mass of one MoneyMaker-PtoS cotyledon (data not shown) | ||||||||
| 4Adjusted per mL based on volume plated | ||||||||
Table 1: Sample calculations for seedling bacterial growth assay. Sample calculations demonstrate how to normalize bacterial counts and determine log bacterial growth.
Step 11.3 of the Protocol section was updated from:
- Phenotype plants infected with PstT1 at 10–14 days after flood inoculation.
to:
- Phenotype plants infected with Pst19 at 10–14 days after flood inoculation.
Figure 4 in the Protocol section was updated from:

Figure 4: Schematic representation of expected phenotypes for seedling resistance and death in various genetic backgrounds. (A) Seedlings of Rio Grande-PtoR and the near-isogenic cultivar Rio Grande-PtoS are displayed 7 days after flooding with PstDC3000 (OD600 = 0.005) + 0.015% surfactant. Rio Grande-PtoR displays consistent resistance, and Rio Grande-PtoS displays consistent susceptibility to infection with PstDC3000. These lines give rise to discrete and binary phenotypes. (B) Seedlings of a wild accession, such as Solanum neorickii LA1329, are shown 10 days after flooding with PstT1 (OD600 = 0.0075) + 0.015% surfactant. Seedlings display phenotypic variability but were recorded as binary phenotypes. The amount of phenotypic variability and the method of phenotyping (binary resistance or resistance spectrum) will depend on the particular accession tested. (C) Mapping populations generated by outcrossing wild accessions to susceptible cultivars may display a wider spectrum of phenotypes in F2 segregating populations. In this case, it may be most appropriate to record seedling phenotypes on a spectrum. Highly susceptible seedlings from a mapping population may be phenotyped for death as early as day 7 when flooded with PstT1, and typically show a brown apical meristem, no to very little extension of the epicotyl, and no new, green vegetative growth. The apical meristem of susceptible seedlings may stay green or very light brown for more time, and there may be some extension of the epicotyl and very little vegetative growth, which turns brown and arrests by day 10. Individual seedlings can be phenotyped for resistance based on the amount of new and ongoing vegetative growth by day 14. Seedlings can then be grouped based on the phenotypes described above into different categories of resistance such as weak, medium, or strong resistance. Please click here to view a larger version of this figure.
to:
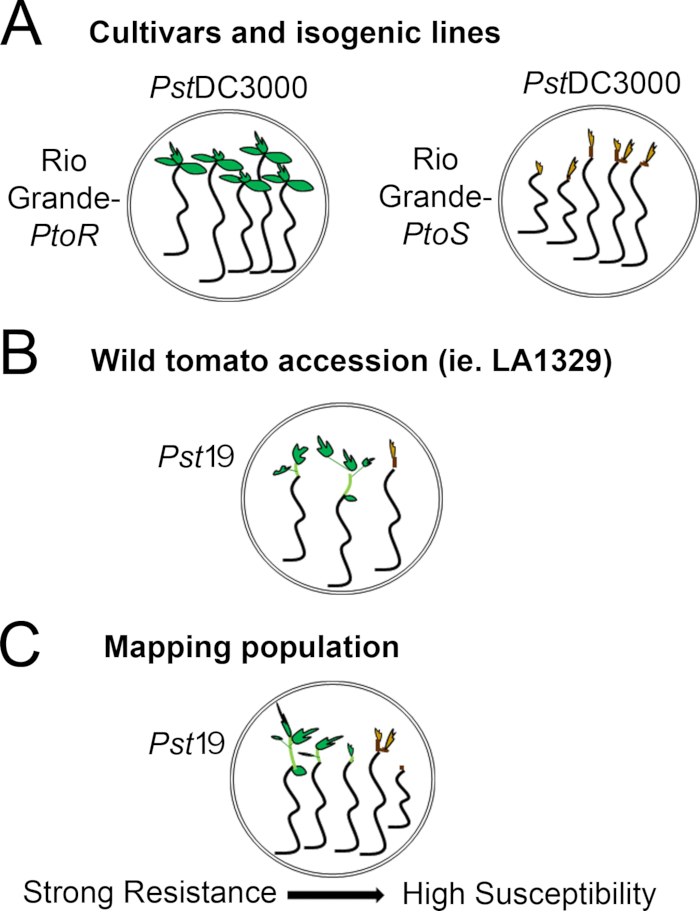
Figure 4: Schematic representation of expected phenotypes for seedling resistance and death in various genetic backgrounds. (A) Seedlings of Rio Grande-PtoR and the near-isogenic cultivar Rio Grande-PtoS are displayed 7 days after flooding with PstDC3000 (OD600 = 0.005) + 0.015% surfactant. Rio Grande-PtoR displays consistent resistance, and Rio Grande-PtoS displays consistent susceptibility to infection with PstDC3000. These lines give rise to discrete and binary phenotypes. (B) Seedlings of a wild accession, such as Solanum neorickii LA1329, are shown 10 days after flooding with Pst19 (OD600 = 0.0075) + 0.015% surfactant. Seedlings display phenotypic variability but were recorded as binary phenotypes. The amount of phenotypic variability and the method of phenotyping (binary resistance or resistance spectrum) will depend on the particular accession tested. (C) Mapping populations generated by outcrossing wild accessions to susceptible cultivars may display a wider spectrum of phenotypes in F2 segregating populations. In this case, it may be most appropriate to record seedling phenotypes on a spectrum. Highly susceptible seedlings from a mapping population may be phenotyped for death as early as day 7 when flooded with Pst19, and typically show a brown apical meristem, no to very little extension of the epicotyl, and no new, green vegetative growth. The apical meristem of susceptible seedlings may stay green or very light brown for more time, and there may be some extension of the epicotyl and very little vegetative growth, which turns brown and arrests by day 10. Individual seedlings can be phenotyped for resistance based on the amount of new and ongoing vegetative growth by day 14. Seedlings can then be grouped based on the phenotypes described above into different categories of resistance such as weak, medium, or strong resistance. Please click here to view a larger version of this figure.
The second paragraph of the Representative Results section was updated from:
Phenotypic screening of wild accessions using the seedling resistance assay
Figure 6 shows representative results for seedlings of susceptible and resistant accessions 10–14 days after flooding with PstT1. Susceptible accessions include RG-PtoR, S. pimpinellifolium LA1375, and S. pimpinellifolium LA1606, and resistant accessions include S. neorickii LA1329. Ten-day-old seedlings were flooded with 10 mM MgCl2 + 0.015% surfactant as a negative control, and PstT1 at an optical density of 0.0075 + 0.015% surfactant. The seedlings were phenotyped at least 10 days after flooding, as PstT1-infected seedlings died more slowly than PstDC3000-infected seedlings. Mock-inoculated seedlings were green, healthy, and actively growing. This control is important to ensure that the accessions are not sensitive to the concentration of surfactant, and to ensure there is no bacterial contamination. Susceptible accessions (Rio Grande-PtoR [n = 7], S. pimpinellifolium LA1375 [n = 7], and S. pimpinellifolium LA1606 [n = 5]) were dead, had brown apical meristems, and lacked new growth 10–14 days after inoculation with PstT1. In contrast, two S. neorickii LA1329 (n = 3) seedlings displayed a high level of new, green growth and survived infection with PstT1 (Figure 6). Three LA1329 seedlings did not germinate. Typically, 5–7 individuals were screened for each accession in a primary screen to determine the prevalence of resistance in the population. When a more genetically complex wild accession, such as LA1329, is flooded with PstT1, the resistance phenotypes display slightly more variability among individual seedlings, compared to Moneymaker-PtoR treated with PstDC3000. However, the resistance phenotypes were usually less variable than those seen in F2 mapping populations. Thus, binary phenotyping criteria was used for LA1329.
to:
Phenotypic screening of wild accessions using the seedling resistance assay
Figure 6 shows representative results for seedlings of susceptible and resistant accessions 10–14 days after flooding with Pst19. Susceptible accessions include RG-PtoR, S. pimpinellifolium LA1375, and S. pimpinellifolium LA1606, and resistant accessions include S. neorickii LA1329. Ten-day-old seedlings were flooded with 10 mM MgCl2 + 0.015% surfactant as a negative control, and Pst19 at an optical density of 0.0075 + 0.015% surfactant. The seedlings were phenotyped at least 10 days after flooding, as Pst19-infected seedlings died more slowly than PstDC3000-infected seedlings. Mock-inoculated seedlings were green, healthy, and actively growing. This control is important to ensure that the accessions are not sensitive to the concentration of surfactant, and to ensure there is no bacterial contamination. Susceptible accessions (Rio Grande-PtoR [n = 7], S. pimpinellifolium LA1375 [n = 7], and S. pimpinellifolium LA1606 [n = 5]) were dead, had brown apical meristems, and lacked new growth 10–14 days after inoculation with Pst19. In contrast, two S. neorickii LA1329 (n = 3) seedlings displayed a high level of new, green growth and survived infection with Pst19 (Figure 6). Three LA1329 seedlings did not germinate. Typically, 5–7 individuals were screened for each accession in a primary screen to determine the prevalence of resistance in the population. When a more genetically complex wild accession, such as LA1329, is flooded with Pst19, the resistance phenotypes display slightly more variability among individual seedlings, compared to Moneymaker-PtoR treated with PstDC3000. However, the resistance phenotypes were usually less variable than those seen in F2 mapping populations. Thus, binary phenotyping criteria was used for LA1329.
Figure 6 in the Representative Results section was updated from:
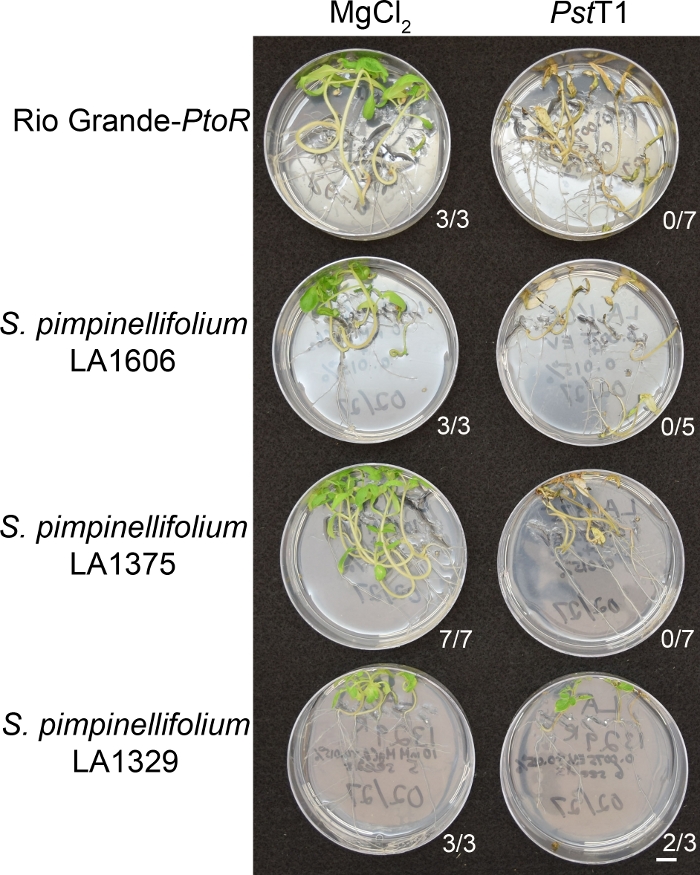
Figure 6: Phenotypic characterization of resistance or disease symptoms 10–14 days post-infection in wild accessions. Rio Grande-PtoR, S. pimpinellifolium LA1606, S. pimpinellifolium LA1375 and S. neorickii LA1329 tomato seedlings were grown on 0.5x MS plates for 10 days, and then flooded with PstT1 (OD600 = 0.0075) + 0.015% surfactant. The number of surviving seedlings for each wild accession out of the total number tested is shown. Scale bar = 1 cm. Please click here to view a larger version of this figure.
to:

Figure 6: Phenotypic characterization of resistance or disease symptoms 10–14 days post-infection in wild accessions. Rio Grande-PtoR, S. pimpinellifolium LA1606, S. pimpinellifolium LA1375 and S. neorickii LA1329 tomato seedlings were grown on 0.5x MS plates for 10 days, and then flooded with Pst19 (OD600 = 0.0075) + 0.015% surfactant. The number of surviving seedlings for each wild accession out of the total number tested is shown. Scale bar = 1 cm. Please click here to view a larger version of this figure.
The third paragraph of the Representative Results section was updated from:
Quantitative assessment of bacterial growth using the seedling flood assay
To confirm that the observed resistance in LA1329 to PstT1 resulted in lower bacterial growth, bacterial growth assays were carried out in tomato seedlings. The level of PstT1 growth in Moneymaker-PtoS and S. neorickii LA1329 was determined 4 days post-infection. Moneymaker-PtoS is a near-isogenic line with consistent susceptibility among individual seedlings. Wild accessions such as S. neorickii LA1329 are often more genetically complex. LA1329 displays approximately 60% resistance to PstT1 across the population22. Because seedlings may drop their cotyledons after infection, one seedling was grown on each plate to correlate bacterial growth in the harvested cotyledon with overall seedling survival or death as determined phenotypically at least 10 days after flooding. The bacterial counts on day 4 for each seedling were normalized to 0.01 g of tissue and converted to log growth (CFU/0.01 g(log10)). Log growth for phenotypically resistant LA1329 seedlings (LA1329RES) or phenotypically susceptible seedlings (LA1329SUS) were separately pooled and compared to each other and the susceptible cultivar Moneymaker-PtoS. For example, there was a 1.7 log difference in bacterial growth between LA1329RES (log 6.3) and LA1329SUS (log 8.0), and a 1.6 log difference between LA1329RES (log 6.3) and Moneymaker-PtoS (log 7.9) (Figure 7). Therefore, phenotypic resistance correlated with quantitative resistance in the seedling assays.
to:
Quantitative assessment of bacterial growth using the seedling flood assay
To confirm that the observed resistance in LA1329 to Pst19 resulted in lower bacterial growth, bacterial growth assays were carried out in tomato seedlings. The level of Pst19 growth in Moneymaker-PtoS and S. neorickii LA1329 was determined 4 days post-infection. Moneymaker-PtoS is a near-isogenic line with consistent susceptibility among individual seedlings. Wild accessions such as S. neorickii LA1329 are often more genetically complex. LA1329 displays approximately 60% resistance to Pst19 across the population22. Because seedlings may drop their cotyledons after infection, one seedling was grown on each plate to correlate bacterial growth in the harvested cotyledon with overall seedling survival or death as determined phenotypically at least 10 days after flooding. The bacterial counts on day 4 for each seedling were normalized to 0.01 g of tissue and converted to log growth (CFU/0.01 g(log10)). Log growth for phenotypically resistant LA1329 seedlings (LA1329RES) or phenotypically susceptible seedlings (LA1329SUS) were separately pooled and compared to each other and the susceptible cultivar Moneymaker-PtoS. For example, there was a 1.7 log difference in bacterial growth between LA1329RES (log 6.3) and LA1329SUS (log 8.0), and a 1.6 log difference between LA1329RES (log 6.3) and Moneymaker-PtoS (log 7.9) (Figure 7). Therefore, phenotypic resistance correlated with quantitative resistance in the seedling assays.
Figure 7 in the Representative Results section was updated from:
x
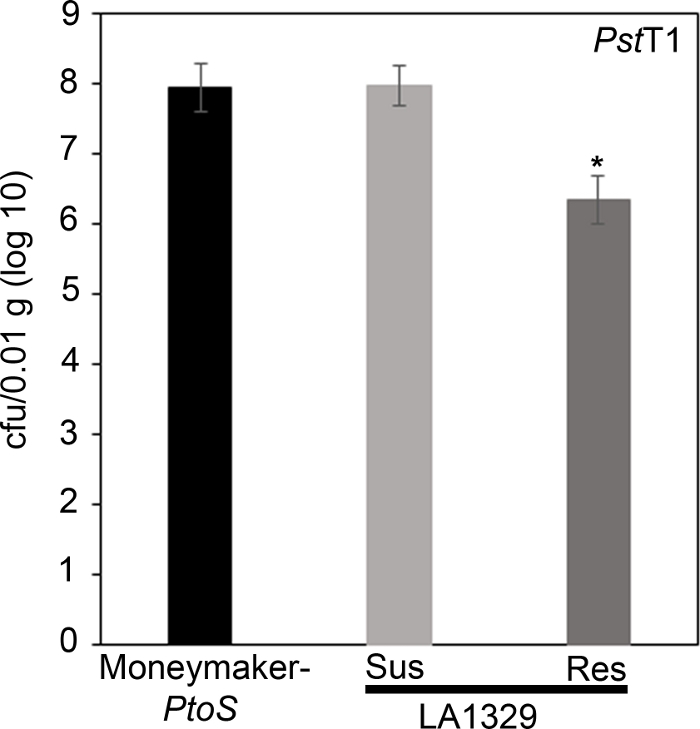
Figure 7: Resistant Solanum neorickii LA1329 seedlings support lower bacterial growth than Moneymaker-PtoS or susceptible S. neorickii LA1329. Bacterial counts were determined 4 days post-inoculation from S. neorickii LA1329 (n = 14) and Moneymaker-PtoS (n = 10) seedlings infected with PstT1 and normalization was performed to 0.01 g of tissue. For LA1329, the two phenotypic groups, susceptible (SUS) or resistant (RES), were observed and counted separately. Above the bar * = statistically significant difference determined by a one-factor analysis of variance. A general linear model procedure (p < 0.001) followed by a multiple comparison of means using Tukey's post hoc test was used. Error bars = standard error. The figure indicates one representative experiment. Please click here to view a larger version of this figure.
x
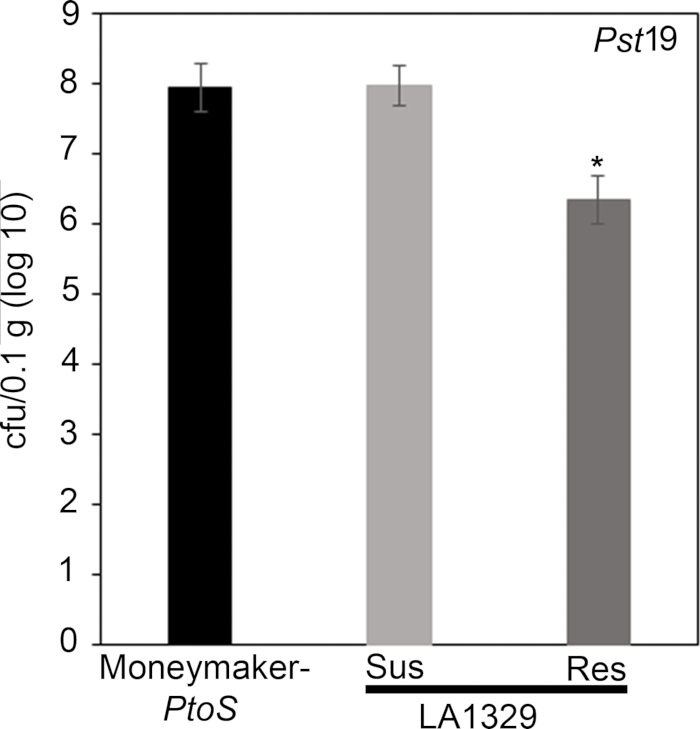
Figure 7: Resistant Solanum neorickii LA1329 seedlings support lower bacterial growth than Moneymaker-PtoS or susceptible S. neorickii LA1329. Bacterial counts were determined 4 days post-inoculation from S. neorickii LA1329 (n = 14) and Moneymaker-PtoS (n = 10) seedlings infected with Pst19 and normalization was performed to 0.1 g of tissue. For LA1329, the two phenotypic groups, susceptible (SUS) or resistant (RES), were observed and counted separately. Above the bar * = statistically significant difference determined by a one-factor analysis of variance. A general linear model procedure (p < 0.001) followed by a multiple comparison of means using Tukey's post hoc test was used. Error bars = standard error. The figure indicates one representative experiment. Please click here to view a larger version of this figure.
The first paragraph of the Discussion section was updated from:
A protocol for flood inoculation with PstDC3000 or PstT1 optimized to detect resistance to these bacterial strains in tomato seedlings is described. There are several critical parameters for optimal results in the seedling resistance assay, including bacterial concentration and surfactant concentration, which were empirically determined22. For PstDC3000, the optical density was optimized to achieve complete survival on a resistant cultivar containing the Pto/Prf cluster and complete death on a susceptible cultivar lacking the Pto/Prf cluster22. For a strain such as PstT1, where there are no known resistant varieties, the optical density was optimized to be the lowest possible for consistent and complete plant death22. Uppalapati et al.24 designed a tomato seedling assay to investigate the pathogenesis of PstDC3000 and the virulence function of coronatine. In this virulence assay, infections were performed using bacteria concentrated to an OD600 of 0.124, 20x higher than the optical density of strains used in our resistance assay. Recognition of PstDC3000 effectors AvrPto and AvrPtoB in tomato seedlings carrying the Pto/Prf gene cluster results in ETI and a macroscopic HR22. In the context of a strong immune response such as ETI, a lower bacterial titer was used for PstDC3000 to avoid overwhelming genetic resistance from the Pto/Prf gene cluster22. In addition, these results suggest that a high bacterial concentration could overwhelm weaker immune responses such as PTI or quantitative partial resistance, where multiple genes contribute to the overall phenotype. Surfactant is necessary for the bacteria to adhere to the leaf surface; however, high concentrations can cause chlorosis of the leaf22. We previously tested a range of surfactant concentrations to empirically determine the ideal concentration in 10-day-old tomato seedlings22. When testing new species that may differ in their sensitivity to surfactant, the surfactant concentration should be optimized to identify a concentration that does not cause damage or chlorosis in the absence of bacteria. Appropriate assay conditions will require optimization of a surfactant concentration that does not cause damage, and a bacterial concentration that causes disease in all susceptible controls.
to:
A protocol for flood inoculation with PstDC3000 or Pst19 optimized to detect resistance to these bacterial strains in tomato seedlings is described. There are several critical parameters for optimal results in the seedling resistance assay, including bacterial concentration and surfactant concentration, which were empirically determined22. For PstDC3000, the optical density was optimized to achieve complete survival on a resistant cultivar containing the Pto/Prf cluster and complete death on a susceptible cultivar lacking the Pto/Prf cluster22. For a strain such as Pst19, where there are no known resistant varieties, the optical density was optimized to be the lowest possible for consistent and complete plant death22. Uppalapati et al.24 designed a tomato seedling assay to investigate the pathogenesis of PstDC3000 and the virulence function of coronatine. In this virulence assay, infections were performed using bacteria concentrated to an OD600 of 0.124, 20x higher than the optical density of strains used in our resistance assay. Recognition of PstDC3000 effectors AvrPto and AvrPtoB in tomato seedlings carrying the Pto/Prf gene cluster results in ETI and a macroscopic HR22. In the context of a strong immune response such as ETI, a lower bacterial titer was used for PstDC3000 to avoid overwhelming genetic resistance from the Pto/Prf gene cluster22. In addition, these results suggest that a high bacterial concentration could overwhelm weaker immune responses such as PTI or quantitative partial resistance, where multiple genes contribute to the overall phenotype. Surfactant is necessary for the bacteria to adhere to the leaf surface; however, high concentrations can cause chlorosis of the leaf22. We previously tested a range of surfactant concentrations to empirically determine the ideal concentration in 10-day-old tomato seedlings22. When testing new species that may differ in their sensitivity to surfactant, the surfactant concentration should be optimized to identify a concentration that does not cause damage or chlorosis in the absence of bacteria. Appropriate assay conditions will require optimization of a surfactant concentration that does not cause damage, and a bacterial concentration that causes disease in all susceptible controls.
The third paragraph of the Discussion section was updated from:
Pst is a foliar pathogen that preferentially colonizes the aerial parts of tomato seedlings, including the cotyledons24 (Figure 3). Therefore, qualitative phenotyping in the seedling flood assay focuses on growth and disease symptoms in aerial portions of the seedling, and tissue for the bacterial growth assay is sampled from the cotyledons for quantitative analysis. After flood inoculation, seedlings may die within 7–10 days after inoculation with PstDC3000 or 10–14 days after inoculation with PstT1, as discussed in section 11. Seedling death is visualized by a brown apical meristem, arrested epicotyl elongation, and/or arrested vegetative growth. If different bacterial strains are used, the timing will have to be empirically determined. In addition, the progression of disease on control plants should be monitored daily after flooding until a consistent time frame from the onset of disease symptoms to seedling death can be identified. Depending on the genotypes and treatments used in the flood assay, seedling phenotypes can be recorded as binary phenotypes or on a disease spectrum (Figure 4). A broader spectrum of phenotypes may be observed when flood inoculating F2 mapping populations from wild tomato accessions crossed to susceptible cultivars (Figure 4C). It may be best to phenotype segregating populations on a disease spectrum depending on how quickly the seedling dies and the degree of new vegetative growth and branching (Figure 4C). The seedling flood assay can also be used in conjunction with the seedling bacterial growth assay to quantitatively assess levels of bacterial growth associated with qualitative phenotypes in individual seedlings (Figure 7). Very large reductions (i.e., ~log 3) in bacterial growth or strong resistance in resistant seedlings of a wild accession compared to a susceptible cultivar suggest that the underlying genetic basis of resistance may be due to ETI22. Smaller reductions in bacterial growth (i.e., ~log 1.7), as observed in LA1329 seedlings, may be due to the contribution of weaker resistance from quantitative trait loci and/or PTI. Thus, the seedling growth assay can be an important tool in further characterizing resistance in wild tomato lines.
to:
Pst is a foliar pathogen that preferentially colonizes the aerial parts of tomato seedlings, including the cotyledons24 (Figure 3). Therefore, qualitative phenotyping in the seedling flood assay focuses on growth and disease symptoms in aerial portions of the seedling, and tissue for the bacterial growth assay is sampled from the cotyledons for quantitative analysis. After flood inoculation, seedlings may die within 7–10 days after inoculation with PstDC3000 or 10–14 days after inoculation with Pst19, as discussed in section 11. Seedling death is visualized by a brown apical meristem, arrested epicotyl elongation, and/or arrested vegetative growth. If different bacterial strains are used, the timing will have to be empirically determined. In addition, the progression of disease on control plants should be monitored daily after flooding until a consistent time frame from the onset of disease symptoms to seedling death can be identified. Depending on the genotypes and treatments used in the flood assay, seedling phenotypes can be recorded as binary phenotypes or on a disease spectrum (Figure 4). A broader spectrum of phenotypes may be observed when flood inoculating F2 mapping populations from wild tomato accessions crossed to susceptible cultivars (Figure 4C). It may be best to phenotype segregating populations on a disease spectrum depending on how quickly the seedling dies and the degree of new vegetative growth and branching (Figure 4C). The seedling flood assay can also be used in conjunction with the seedling bacterial growth assay to quantitatively assess levels of bacterial growth associated with qualitative phenotypes in individual seedlings (Figure 7). Very large reductions (i.e., ~log 3) in bacterial growth or strong resistance in resistant seedlings of a wild accession compared to a susceptible cultivar suggest that the underlying genetic basis of resistance may be due to ETI22. Smaller reductions in bacterial growth (i.e., ~log 1.7), as observed in LA1329 seedlings, may be due to the contribution of weaker resistance from quantitative trait loci and/or PTI. Thus, the seedling growth assay can be an important tool in further characterizing resistance in wild tomato lines.
The fourth paragraph of the Discussion section was updated from:
Typically, genetic screens have been performed on four- to five-week-old adult tomato plants to identify the genetic basis of P. syringae resistance in wild accessions20,21. Adult tomato plants require much longer growth times, require more space in the growth chamber, and are much larger plants, which means that usually few individuals are screened for each line. The seedling flood assay provides a powerful, alternative approach in the identification of P. syringae resistance in wild tomato accessions. Screening at the seedling stage permits a large sample size to be tested which can be particularly advantageous in detecting resistance in genetically complex populations. Reduced growth chamber space requirements and growth time facilitate a high-throughput approach and rapid detection of natural resistance in wild accessions to emerging pathogens. Furthermore, P. syringae resistance that was identified at the seedling stage in this assay is not restricted to the developmental stage. S. neorickii LA1329 and S. habrochaites LA1253 were initially identified at the seedling stage and also display resistance to PstT1 in adult plants as previously described22.
to:
Typically, genetic screens have been performed on four- to five-week-old adult tomato plants to identify the genetic basis of P. syringae resistance in wild accessions20,21. Adult tomato plants require much longer growth times, require more space in the growth chamber, and are much larger plants, which means that usually few individuals are screened for each line. The seedling flood assay provides a powerful, alternative approach in the identification of P. syringae resistance in wild tomato accessions. Screening at the seedling stage permits a large sample size to be tested which can be particularly advantageous in detecting resistance in genetically complex populations. Reduced growth chamber space requirements and growth time facilitate a high-throughput approach and rapid detection of natural resistance in wild accessions to emerging pathogens. Furthermore, P. syringae resistance that was identified at the seedling stage in this assay is not restricted to the developmental stage. S. neorickii LA1329 and S. habrochaites LA1253 were initially identified at the seedling stage and also display resistance to Pst19 in adult plants as previously described22.
