

ERRATUM NOTICE
Important: There has been an erratum issued for this article. Read more …
Summary
De zaailing overstromingstest vergemakkelijkt een snelle screening van wilde tomaten toetredingen voor de weerstand tegen de Pseudomonas syringae bacterie. Deze test, gebruikt in combinatie met de zaailing bacteriële groei test, kan helpen bij het verder karakteriseren van de onderliggende weerstand tegen de bacterie, en kan worden gebruikt om het scherm mapping populaties om de genetische basis van resistentie te bepalen.
Abstract
Tomaat is een agronomisch belangrijk gewas dat kan worden geïnfecteerd door Pseudomonas syringae, een gram-negatieve bacterie, wat resulteert in bacteriële vlekziekte. De tomaat-P. syringae pv. tomaat pathosystem wordt veel gebruikt om de genetische basis van plantaardige aangeboren reacties en resistentie tegen ziekten te ontleden. Terwijl de ziekte met succes werd beheerd voor vele decennia door de invoering van de Pto / Prf gencluster van Solanum pimpinellifolium in gecultiveerde tomaat, ras 1 stammen van P. syringae zijn geëvolueerd om resistentie verleend door de Pto / Prf gencluster te overwinnen en wereldwijd optreden.
Wilde tomatensoorten zijn belangrijke reservoirs van natuurlijke diversiteit in pathogene herkenning, omdat ze evolueerden in verschillende omgevingen met verschillende pathogene druk. In typische schermen voor ziekteresistentie in wilde tomaat worden volwassen planten gebruikt, die het aantal planten kunnen beperken dat kan worden gescreend vanwege hun langere groeitijd en grotere groeiruimtevereisten. We ontwikkelden een methode om 10-dagen-oude tomatenzaailingen te screenen op resistentie, die de groeitijd van planten en de groeiruimte minimaliseert, een snelle omzet van planten mogelijk maakt en grote monstermaten laat testen. Zaailing resultaten van overleving of dood kan worden behandeld als discrete fenotypes of op een weerstand schaal gedefinieerd door de hoeveelheid nieuwe groei in overlevende zaailingen na overstromingen. Deze methode is geoptimaliseerd om 10-dagen-oude tomatenzaailingen te screenen op weerstand tegen twee P. syringae stammen en kan gemakkelijk worden aangepast aan andere P. syringae stammen.
Introduction
Pseudomonas syringae is een Gram-negatieve pathogene bacterie die een breed scala aan plantengastheren infecteert. Bacteriën komen de gastheer plant door de stomata of fysieke wonden en vermenigvuldigen zich in de apoplast1. Planten hebben een tweeledige immuunrespons ontwikkeld om te beschermen tegen infectie door bacteriële pathogenen. Het eerste niveau vindt plaats op het plantenceloppervlak, waar patroonherkenningsreceptoren op het plantencelmembraan zeer geconserveerde pathogene moleculaire patronen (PP's) waarnemen in een proces genaamd PAMP-triggered immunity (PTI)2. Tijdens dit proces, de gastheer plant upregulates defensie respons trajecten, met inbegrip van depositie van callose aan de celwand, sluiting van stomata, de productie van reactieve zuurstofsoorten, en inductie van pathogenese-gerelateerde genen.
Bacteriën kunnen PTI overwinnen door gebruik te maken van een type III secretiesysteem om eiwitten, zogenaamde effectoren, rechtstreeks in de plantencel te leveren3. Effector eiwitten richten zich meestal op componenten van PTI en bevorderen ziekteverwekkervirulentie4. De tweede laag van plantenimmuniteit treedt op in de plantencel bij de herkenning van de effectoreiwitten. Deze erkenning is afhankelijk van weerstandsgenen, die nucleotide-bindende plaats leucine-rijke herhaling die receptoren (NLRs) bevat coderen. Nlrs zijn in staat om ofwel direct effectoren te herkennen of hun activiteit te herkennen op een virulentiedoel of lokkracht5. Ze activeren dan een secundaire immuunrespons in een proces genaamd effector-triggered immunity (ETI), die vaak wordt geassocieerd met een overgevoelige respons (HR), een vorm van gelokaliseerde celdood op de plaats van infectie6. In tegenstelling tot gen-voor-genresistentie geassocieerd met ETI, kunnen planten kwantitatieve gedeeltelijke resistentie vertonen, die afhankelijk is van de bijdrage van meerdere genen7.
P. syringae pv. tomaat (Pst) is het oorzakelijke middel van bacteriële vlek op tomaat en is een hardnekkig landbouwprobleem. Overheersende stammen in het veld zijn meestal Pst race 0 stammen die een van beide of beide van het type III effectors AvrPto en AvrPtoB uitdrukken. DC3000(PstDC3000) is een representatieve ras 0 stam en een model ziekteverwekker die bacteriële vlek in tomaat kan veroorzaken. Om bacteriële vlekziekte te bestrijden, hebben fokkers de Pto [P. syringae pv. tomaat]/Prf [Pto-resistentie en fenthiongevoeligheid] gencluster van de wilde tomatensoorten Solanum pimpinellifolium in moderne cultivars8,9. Het Pto-gen codeert een serine-threonine eiwit kinase die samen met het Prf NLR weerstand verleent tegen PstDC3000 via erkenning van de effectoren AvrPto en AvrPtoB10,11,12,13,14. Deze weerstand is echter niet effectief tegen opkomende rassen 1 stammen, waardoor hun snelle en agressieve spreiding in de afgelopen jaren15,16. Race 1 stammen ontwijken erkenning door de Pto / Prf cluster, omdat AvrPto is ofwel verloren of gemuteerd in deze stammen, en AvrPtoB lijkt te accumuleren minimaal15,17,18.
Wilde tomatenpopulaties zijn belangrijke reservoirs van natuurlijke variatie voor Pst resistentie en zijn eerder gebruikt om potentiële resistentie loci19,20,21te identificeren . Echter, de huidige schermen voor pathogene resistentie gebruik maken van 4-5 weken oude volwassen planten20,21. Daarom worden ze beperkt door groeitijd, groeiruimte en relatief kleine steekproefgroottes. Om de beperkingen van conventionele benaderingen aan te pakken, ontwikkelden we een high-throughput tomaat P. syringae resistentie test met behulp van 10-dagen-oude tomatenzaailingen22. Deze aanpak biedt verschillende voordelen ten opzichte van het gebruik van volwassen planten: namelijk kortere groeitijd, verminderde ruimtevereisten en een hogere doorvoer. Bovendien hebben we aangetoond dat deze aanpak getrouw de ziekteresistentie fenotypes in volwassen planten recapituleert22.
In de zaailing overstroming assay beschreven in dit protocol, tomaten zaailingen worden geteeld op petrischaaltjes van steriele Murashige en Skoog (MS) media gedurende 10 dagen en vervolgens worden overspoeld met een inentingum met de bacteriën van belang en een oppervlakteactieve stof. Na overstromingen kunnen zaailingen kwantitatief worden geëvalueerd op ziekteresistentie via bacteriële groeitesten. Bovendien kan het overleven of de dood van zaailing fungeren als een discrete resistentie of ziekte fenotype 7-14 dagen na overstromingen. Deze aanpak biedt een high-throughput alternatief voor het screenen van grote aantallen wilde tomaten toetredingen voor resistentie tegen Pst ras 1 stammen, zoals Pst stam T1 (PstT1), en kan gemakkelijk worden aangepast aan andere bacteriële stammen van belang.
Subscription Required. Please recommend JoVE to your librarian.
Protocol
1. Voorbereiding en gebruik van bioveiligheidskast
- Veeg bioveiligheidskast met 70% ethanol weg.
- Sluit de sjerp en zet het ultraviolette licht in de bioveiligheidskast voor 15 min.
- Na 15 min, zet het ultraviolette licht in de bioveiligheidskast. Til de sjerp op en zet de blower 15 min aan.
- Veeg alle items die in de bioveiligheidskast moeten worden gebruikt met 70% ethanol voordat u de items in de gesteriliseerde kast stopt.
- Schone handschoenen of blote handen met 70% ethanol voordat u in de bioveiligheidskast werkt.
- Werk in het midden van de bioveiligheidskast, weg van de blower.
- Gebruik ongeopende flessen autoclaved steriele 10 mM MgCl2 en ultrapure H2O voor experimenten. Doe flessen in de bioveiligheidskast en open ze alleen in de gesteriliseerde bioveiligheidskast, niet op de banktop.
- Gebruik speciale glazen pipetten en pipet tips voor het werk in de gesteriliseerde bioveiligheidskast. Zorg ervoor dat deze alleen worden geopend in de bioveiligheidskast, nooit op de banktop.
- Na gebruik van de bioveiligheidskast, autoclave al het afval (met uitzondering van bleekmiddel afval) en veeg het oppervlak met 70% ethanol.
2. Bereiding van plantaardige media
- Weeg af en los 0,5x MS basale zouten op in ultrapure H2O. Weeg 0,8% bacto agar af en voeg vervolgens toe aan opgeloste 0,5x MS.
- Autoclave en laat de media afkoelen in 50 °C waterbad gedurende 1 uur voorafgaand aan het gieten of pipetteren.
- Om ervoor te zorgen dat de platen niet overvol zijn, markeert u polystyreen wegwerp steriele steriel platen van 100 x 25 mm tot een vulniveau van 40 mL. Giet media in 100 x 25 mm steriele platen in een gesteriliseerde bioveiligheidskast.
3. Bereiding van plantaardige materialen en groeiomstandigheden
- Plaats tomatenzaden in een microcentrifugebuis van 2,2 mL en voeg een 50 mL-bleekoplossing toe.
- Rock de buis op een rocker voor 25 min.
- Verwijder na 25 min de zaadjes van de tuimelschakelaar en verwijder de bleekoplossing met een pipet in de steriele bioveiligheidskast. Zorg ervoor dat al het bleekmiddel wordt verwijderd.
- Voeg 2 mL steriele ultrapure H2O toe om de zaden te wassen. Keer de buis 5x om.
- Verwijder de vloeistof uit de buis met een pipet.
- Herhaal stap 3.3–3.5 om de zaden 4x meer te wassen.
- Voeg 2 mL steriele ultrapure H2O toe en giet de zaden in een lege steriele petrischaal.
- Vlam forceert in ethanol en laat afkoelen voorafgaand aan de overdracht en gelijkmatig afstand zaden op 100 x 25 mm platen met 0,5x MS + 0,8% agar media.
- Breng 5-7 zaden in een lijn over het midden van een plaat en verzegel de randen van de platen met chirurgische tape (1,25 cm x 9,1 m).
- Beveel de gesteriliseerde zaden bij 4 °C in het donker gedurende ten minste 3 dagen om de kieming te synchroniseren. Zorg ervoor dat de platen plat gestapeld zijn en naar boven worden gestapeld, zodat de zaden niet op de plaat verschuiven.
- Verticaal oriënteren van de platen, zodat de wortels zal groeien langs het oppervlak van de plaat, met de lijn van zaden horizontaal georiënteerd, bij de overdracht naar de groeikamer.
OPMERKING: Stel de groeikamer in op 22 °C en zorg voor 16 uur licht bij een lichtintensiteit van ~200-220 μE meter-2 s-1 en 8 uur duisternis. - Voorafgaand aan overstromingen, groeien zaailingen gedurende 10 dagen in de groeikamer op welk punt zaailingen meestal volledig weergegeven en uitgebreid cotyledons en opkomende eerste echte bladeren (Figuur 1).

Figuur 1: Ontwikkelingsfase van typische 10-dagen-oude tomatenzaailingen. Rio Grande-PtoR tomatenzaden werden gesteriliseerd, verguld en gestratificeerd gedurende ten minste 3 dagen in het donker bij 4 °C. De zaailingen werden 10 dagen lang op 0,5x MS-platen bij 22 °C geteeld voordat ze onder water werden gezet. Typisch, op 10 dagen de cotyledons zijn volledig uitgebreid, en de eerste echte bladeren beginnen te ontstaan. Klik hier om een grotere versie van dit cijfer te bekijken.
4. Voorbereiding van King's B23 (KB) media
- Vul beker met 500 mL ultrapure H2O en roer op een roerplaat.
- Los 20 g bacto pepton, 1,5 g watervrije K2HPO4en 12,5 mL glycerol volledig op in een beker met ultrapure H2O.
- Giet het opgeloste mengsel in een 1 L gegradueerde cilinder en breng tot een 1 L laatste volume met ultrapure H2O.
- Giet de bouillon terug in het bekerglas en roer tot gemengd.
- Weeg 7,5 g bacto agar af in twee glazen flessen van 500 mL en voeg 500 mL KB bouillon toe vanaf stap 4,4 in elke fles. Autoclave voor 20 min.
- Haal de flessen uit het autoclave en wervel zachtjes om de agar te verdelen.
- Breng de flessen gedurende 1 uur over op een waterbad van 50 °C.
- Breng na 1 uur de fles over naar de bioveiligheidskast en voeg onder aseptische omstandigheden 1.600 μL steriele 1 M MgSO4toe en breng de juiste antibiotica naar de media.
OPMERKING: Gebruik rifampicine opgelost in dimethylformamide bij een eindconcentratie van 50 μg/mL voor rifampicine opgelost in dimethylformamide. Gebruik cycloheximide opgelost in ethanol bij een eindconcentratie van 50 μg/mL om schimmelgroei op de platen te voorkomen. - Wervel de media voorzichtig te mengen en giet vervolgens om de onderkant van de platen te dekken.
- Laat de platen minstens 1 uur stollen voordat ze ondersteboven worden opgeslagen bij 4 °C.
5. Handhaving van bacteriestammen en kweekomstandigheden
- Houd een glycerol bestand van enkele kolonie bacteriën als 1 mL van verzadigde bacteriële cultuur en 333 μL steriele 80% glycerol bij -80 °C.
- Patch bacteriën (d.w.z. PstT1) uit een glycerol voorraad op KB agar met de juiste antibiotica (sectie 4).
- Laat de bacteriën 2 dagen bij 28 °C herstellen voordat verse bacteriën op selectieve KB agar worden gestreepd met behulp van een platte, steriele tandenstoker.
- Streep verse bacteriën uit de glycerol voorraad op de juiste selectieve KB agar met behulp van een platte, steriele tandenstoker.
LET OP: Zorg ervoor dat de gepatchte glycerol voorraad niet meer dan 2 weken oud is. - Voor PstDC3000, incubeer de KB plaat op 28 °C voor 24 uur voorafgaand aan het gebruik van bacteriën in de overstroming experiment.
- Voor PstT1, incubeer de KB plaat op 28 °C voor 48 uur voorafgaand aan het gebruik van bacteriën in de overstroming experiment.
6. Bereiding van pstT1 inoculum
- Aseptisch resuspenderen van de bacteriën in steriele 10 mM MgCl2 tot een optische dichtheid op 600 nm (OD600) van 0,1, of ongeveer 5 x 10⁷ kolonie vormeneenheden (CFU)/mL).
- Voer seriële verdunningen uit met steriele 10 mM MgCl2-oplossing in de bioveiligheidskast. Gebruik voor PstT1 een spectrofotometer om intculum te maken met een startconcentratie van OD600 = 0,1.
- Maak voor PstT1 een verdunning van 1/10 van de eerste resuspension bij OD600 = 0,1 om een seriële verdunning te verkrijgen bij een concentratie van OD600 = 0,01.
- Maak met behulp van de seriële verdunning bij OD600 = 0,01 van stap 6.3 een 3/4 verdunning om een definitieve OD600 = 0,0075 te verkrijgen.
- Maak een 1/10 verdunning van niet-ionische organosiliconen oppervlakteactieve stof copolymeer C13H34O4Si3 (d.w.z. oppervlakteactieve stof) in 10 mM MgCl2 en vortex voor 15 s. Voeg de 1/10 voorraad oppervlakteactieve stof toe aan de laatste seriële verdunning (OD600 = 0,0075) tot een eindconcentratie van 0,015% en wervel goed om te mengen.
7. Voorbereiding van pstDC3000 inoculum
- Aseptisch resuspendbacteriën in steriele 10 mM MgCl2 tot een optische dichtheid bij 600 nm (OD600)van 0,1 (ongeveer 5 x 10⁷ CFU/mL).
- Voer seriële verdunningen uit met steriele 10 mM MgCl2-oplossing in de bioveiligheidskast. Gebruik voor PstDC3000 een spectrofotometer om intculum te maken met een startconcentratie van OD600 = 0,1.
- Maak voor PstDC3000 een verdunning van 1/10 van de eerste resuspension bij OD600 = 0,1 om een seriële verdunning te verkrijgen bij een concentratie van OD600 = 0,01.
- Met behulp van de seriële verdunning bij OD600 = 0,01 van stap 3, maak een 1/2 verdunning om een definitieve OD600 = 0,005 te verkrijgen.
- Maak een 1/10 verdunning van oppervlakteactieve stof in 10 mM MgCl2 en vortex voor 15 s. Voeg de 1/10 voorraad oppervlakteactieve stof toe aan de laatste seriële verdunning (OD600 = 0,005) aan een eindconcentratie van 0,015% en wervel goed om te mengen.
8. Tomaatzaaiing overstromingsmethode
- Haal de platen met de 10 dagen oude zaailingen uit de groeikamer en zet in de bioveiligheidskast om de platen voor te bereiden op overstromingen.
- Verwijder de chirurgische tape van twee platen.
- Stel een timer in voor 3 min. Meet 6 mL van het laatste inoculum(PstT1 OD600 = 0,0075 [sectie 6] of PstDC3000 OD600 = 0,005 [sectie 7]) en breng 6 mL inoculum over op elke plaat met de 10-dagenoude zaailingen.
- Duw de zaailingen voorzichtig in het inoculum met een steriele pipettip. Start de timer.
- Houd één bord in elke hand. Kantel de voorkant van de plaat naar beneden om inoculum te accumuleren en dompel voornamelijk de cotyledons en bladeren van de zaailingen onder.
- Swish van links naar rechts 5-7x en dan tip de platen terug naar de wortels en de hele plaat te dekken.
- Kantel de platen weer naar beneden om de cotyledons en bladeren onder te dompelen en herhaal gedurende een totaal van 3 minuten.
- Giet het inoculum van de platen, zet de platen neer op een vlakke ondergrond en giet vervolgens eventuele resterende inoculum een tweede keer.
- Pak de platen opnieuw in met chirurgische tape en herhaal stappen 8.2–8.8 voor eventuele resterende platen.
- Herbroed de platen in de groeikamer (zie stap 3.11 LET OP) nadat alle platen zijn overstroomd.
- Fenotype na 7-10 dagen voor PstDC3000 of 10-14 dagen voor PstT1 (sectie 11). Bij het uitvoeren van bacteriële groeitests, verzamel dan bladweefsel na 4 dagen (secties 9 en 10) en vervolgens fenotype (sectie 11). Als alternatief, uitvoeren fenotypische analyse en bacteriële groei tests op afzonderlijke sets van planten.
9. Oppervlaktesterilisatie van cotyledons voor bacteriële groeitest
- Vier dagen na overstromingen en re-incubatie van de zaailingen in de groeikamer (sectie 8), verwijder de platen met de tomatenzaailingen uit de groeikamer.
- Nummer de afzonderlijke zaailingen aan de onderkant van de plaat waar de zaailing zich voor elk genotype aan de plaat hecht.
- Label steriele 1,5 mL microcentrifuge buizen met de individuele zaailing nummers en gebruik schone tangen om een 3 mm steriele borosilicaat kraal te laten vallen in elke buis voor gebruik met een kraal klopper. (Zie OPMERKING in stap 10.1.)
- Pipetteer 200 μL van 10 mM MgCl2 in elke buis en sluit buizen.
- Bereid 70% ethanol en giet 100 mL in een schone beker. Giet 100 mL steriele ultrapure H2O in een aparte, schone beker.
- Schoon roestvrij staal rechte fine-point tangen met getande tips met ethanol. Open de plaat iets om aseptische verwijdering van een cotyledon met de schone tangen mogelijk te maken.
- Knijp de petiole aan de basis van de cotyledon om een blad te verwijderen en laat in het bekerglas vallen met 70% ethanol om 10 s. Spoel de cotyledon in ultrapure H2O voor 10 s.
- Leg de cotyledon op een papieren handdoek en dep droog met delicate wetenschappelijke doekjes.
- Individueel wegen elke cotyledon na oppervlakte sterilisatie en blotting, en het gewicht registreren.
- Plaats de cotyledon in een eerder bereide microcentrifugebuis van 1,5 m L (uit de stappen 9.3 en 9.4) met het overeenkomstige genotype en het individuele nummer.
- Sluit de platen opnieuw af met steriele tape en broed de zaailingen in de groeikamer opnieuw uit (zie stap 3.11 LET OP).
10. Bacteriële groeitest
- Met behulp van monsters van stap 9.10 homogeniseer het weefsel met behulp van de kraalklopper in 10 mM MgCl2 gedurende 1-2 min. Als het weefsel niet voldoende macereert, homogeniseer dan opnieuw.
LET OP: Veel fabrikanten produceren kraalklopper homogenisatoren. Het aantal en type kralen, evenals de homogenisatietijd en -snelheid (indien programmeerbaar) moeten worden geoptimaliseerd voor elk type homogenisator. Zorg ervoor dat de monsters niet oververhit raken tijdens de homogenisatie. - Voeg vanaf stap 10.1 800 μL van 10 mM MgCl2 toe aan elke buis met gemacereerd weefsel en omkeer meerdere keren om te mengen.
- Bereid seriële verdunningen voor elk monster in 10 mM MgCl2 in 96 putplaat (100, 10-1, 10-2, 10-3, 10-4, 10-5) met behulp van een meerkanaals pipet(figuur 2A).
- Pipetteer 5 μL uit elke verdunningsreeks met behulp van een meerkanaals pipet op een KB agarplaat (150 mm x 15 mm) met cycloheximide en passende selectie voor de bacteriële belasting van belang (zie stap 4.8 OPMERKING). Laat de platen volledig drogen.
- Incubeer de plaat ondersteboven bij 28 °C gedurende 36 uur en visualiseerdekolonies op de platen met behulp van een ontlaadmicroscoop om te bepalen of de kolonies groot genoeg zijn om te tellen.
LET OP: Als de kolonies niet groot genoeg zijn, opnieuw uitbroeden van de platen en opnieuw controleren van de grootte van de kolonies om de paar uur. Typisch, de kolonies zijn te tellen ~ 36-48 uur na incubatie.

Figuur 2: Seriële verdunningen voor zaailing bacteriële groei testen. (A) Gemacereerd bladweefsel van besmette planten wordt verdund voordat de kolonie wordt geteld. Verdunningen worden uitgevoerd in een 96 putplaat (100 is onverdund). Meestal worden verdunningen gemaakt van 10-1 tot 10-5. (B) Beplating verdunningen voor bacteriële kolonie telt. Een totaal van 5 μL van elke kolom van de verdunningsreeks is verguld, van de meeste verdunnende tot meest geconcentreerde. Nadat de kolonies volledig gedroogd zijn, wordt de plaat uitgebroed bij 28 °C voor 36-48 uur. Kolonies worden geteld onder een 10x ontledenmicroscoop. Klik hier om een grotere versie van dit cijfer te bekijken.
- Tel de kolonies onder een ontledende microscoop voordat ze fuseren(figuur 2B). Tel de kolonies uit de verdunningsserie platen met minder dan 100 kolonies.
- Na het verkrijgen van kolonietellingen(figuur 2B)normaliseert u de tellingen tot 0,01 g weefsel voor zaailingen en zet u om tot logbacteriële groei(tabel 1).
OPMERKING: De gemiddelde massa van een Moneymaker-PtoS cotyledon is 0,01 g en is empirisch bepaald22.
| Genotype1 Kolom A | Weefselgewicht (g) kolom B | # van Koloniën op een plek Kolom C | Verdunningsfactor voor plek2 Kolom D | Aangepast # van Koloniën3 Kolom E | Verdunningsfactor voor seriële verdunningkolom F | Totaal aantal kolonies Kolom G (cfu/0,01 g)4 | Gemiddelde # van kolonies (cfu/0.01 g) Kolom H | Gemiddelde loggroei (cfu/0,01 g (log10))Kolom I |
| Voorbeeld 1 | 0,004 g | 10 | 200 | berekend als: (C2 x 0,01 g) / B2 = 25 | 1000 | berekend als: (D2 x E2 x F2) = 5000000 | gemiddelde voor monster 1 tot en met laatste steekproef: (d.w.z. gemiddelde G1:G3) = 7000000 | log van gemiddelde dat wil zeggen. log(H2) = 6,85 |
| Voorbeeld 2 | 0,003 g | 15 | 200 | 50 | 1000 | 10000000 | ||
| Voorbeeld 3 | 0,002 g | 6 | 200 | 30 | 1000 | 6000000 | ||
| 1. Gegevens die voor 3 monsters worden weergegeven | ||||||||
| 2. Op basis van beplating 5 μL x 200 voor 1 mL | ||||||||
| 3. Cotyledons zijn te klein tot kern zodat kolonietellingen aan 0.01 g van weefsel werden genormaliseerd die op de gemiddelde massa van MoneyMaker-PtoS cotyledon (niet getoonde gegevens) werden gebaseerd | ||||||||
| 4. Aangepast per mL op basis van volumeverguld | ||||||||
Tabel 1: Voorbeeldberekeningen voor zaailing bacteriële groeitest. Steekproefberekeningen laten zien hoe bacteriële tellingen te normaliseren en log bacteriële groei te bepalen.
- Voor wilde toetredingen en andere lijnen met complexe genetische achtergronden, correleren het niveau van bacteriële groei in individuele zaailingen met hun fenotype zoals beschreven in sectie 11.
11. Fenotypering voor resistentie
- Verwijder de platen uit de groeikamer en fenotype individuele zaailingen voor de dood (als gevolg van ziekte) of overleving (als gevolg van resistentie) na 7-14 dagen.
- Fenotype planten besmet met een zeer virulente stam zoals PstDC3000 eerder, op 7-10 dagen na overstroming inenting.
- Fenotype planten besmet met PstT1 op 10-14 dagen na overstrominginenting.
- Bepaal een scoresysteem op basis van het bereik van resistentie fenotypes waargenomen. Neem binaire fenotypes op voor cultivars, isogene lijnen en wilde toetredingen met consistente, sterke tot intermediaire resistentiefenotypes(figuur 4A, 4B).
- Als de zaailing binnen het tijdsbestek nieuwe groei van de apicale meristem laat zien voor fenotypering, tel het dan als een overleving. Als de zaailing een bruine apicale meristem heeft en geen nieuwe, groene vegetatieve groei vertoont, tel het dan als een dood (figuur 3).

Figuur 3: Schematische weergave van een tomatenzaailing. Verschillende delen van een tomaat zaailing zijn afgebeeld, met inbegrip van de hypocotyl, cotyledons, epicotyl, schiet apicale meristem, en ware bladeren. Klik hier om een grotere versie van dit cijfer te bekijken.
- Neem fenotypes op een ziektespectrum op voor populaties, zoals F2-populaties, met een breed scala aan resistentiefenotypes(figuur 4C).
- Controleer de zaailingen zorgvuldig op het verschijnen van ziektesymptomen en de dood om het juiste venster voor fenotypering te identificeren.

Figuur 4: Schematische weergave van verwachte fenotypes voor zaailingresistentie en dood in verschillende genetische achtergronden. (A) Zaailingen van Rio Grande-PtoR en de bijna-isogenische cultivar Rio Grande-PtoS worden weergegeven 7 dagen na overstromingen met PstDC3000 (OD600 = 0,005) + 0,015% oppervlakteactieve stof. Rio Grande-PtoR vertoont consistente weerstand en Rio Grande-PtoS vertoont consistente vatbaarheid voor infectie met PstDC3000. Deze lijnen geven aanleiding tot discrete en binaire fenotypes. (B) Zaailingen van een wilde toetreding, zoals Solanum neorickii LA1329, worden 10 dagen na overstromingen met PstT1 (OD600 = 0,0075) + 0,015% oppervlakteactieve stof getoond. Zaailingen vertonen fenotypische variabiliteit, maar werden geregistreerd als binaire fenotypes. De hoeveelheid fenotypische variabiliteit en de methode van fenotypering (binaire resistentie of resistentiespectrum) zal afhangen van de specifieke geteste toetreding. (C) Het in kaart brengen van populaties die worden gegenereerd door het overschrijden van wilde toetredingen tot gevoelige cultivars kan een breder spectrum van fenotypes vertonen in f2-segregatiepopulaties. In dit geval kan het het meest geschikt zijn om zaailing fenotypes op een spectrum op te nemen. Zeer gevoelige zaailingen uit een mapping bevolking kunnen worden fenotypeerd voor de dood zo vroeg op dag 7 wanneer overspoeld met PstT1, en meestal tonen een bruine apicale meristem, geen tot zeer weinig uitbreiding van de epicotyl, en geen nieuwe, groene vegetatieve groei. De apicale meristem van vatbare zaailingen kan groen of zeer lichtbruin blijven voor meer tijd, en er kan een uitbreiding van de epicotyl en zeer weinig vegetatieve groei, die bruin wordt en arrestaties door dag 10. Individuele zaailingen kunnen worden fenotypeerd voor resistentie op basis van de hoeveelheid nieuwe en voortdurende vegetatieve groei door dag 14. Zaailingen kunnen vervolgens worden gegroepeerd op basis van de hierboven beschreven fenotypes in verschillende categorieën van resistentie, zoals zwakke, middelgrote of sterke weerstand. Klik hier om een grotere versie van dit cijfer te bekijken.
Subscription Required. Please recommend JoVE to your librarian.
Representative Results
Detectie van PtoR-gemedieerde immuniteit in cultivars en isogenische lijnen met behulp van de zaailing resistentie test
Figuur 5 toont representatieve resultaten voor Moneymaker-PtoR en Moneymaker-PtoS cultivars 7-10 dagen na overstromingen met PstDC3000. Voorafgaand aan infectie, 10-dagen-oude zaailingen weergegeven volledig ontstaan en uitgebreid cotyledons en opkomende eerste echte bladeren. De zaailingen werden overspoeld met 10 mM MgCl2 + 0,015% oppervlakteactieve stof als een negatieve controle (niet getoonde gegevens) en PstDC3000 met een optische dichtheid van 0,005 + 0,015% oppervlakteactieve stof. De zaailingen werden 7-10 dagen na overstromingen fenotypeerd (figuur 5). Individuele zaailingen van genotypisch homogene lijnen, zoals Moneymaker-PtoR en Moneymaker-PtoS geven zeer consistente en binaire fenotypes in de zaailing overstromingstest. Toen Moneymaker-PtoR, dat het Pto/Prf-gencluster (n = 5) draagt, werd behandeld met PstDC3000 bij de optimale concentratie van OD600 = 0,005, was de weerstand als gevolg van PtoR-gemedieerde immuniteit sterk en werd getypeerd door nieuwe, groene vegetatieve groei in alle individuen22. Near-isogene Moneymaker-PtoS zaailingen (n = 5), die niet kunnen herkennen van de PstDC3000 effectors AvrPto of AvrPtoB, stierf snel binnen 7 dagen na overstromingen en karakteristiek had bruine apicale meristems, bacteriële vlek, chlorose, en geen tekenen van nieuwe, groene vegetatieve groei (Figuur 5).

Figuur 5: Fenotypische karakterisering van resistentie of ziektesymptomen 7-10 dagen na infectie in een cultivar. Moneymaker-PtoR en Moneymaker-PtoS tomatenzaailingen werden geteeld op 0,5x MS platen voor 10 dagen voordat ze werden overspoeld met P. syringae pv. Tomaat DC3000 (OD600 = 0,005) + 0,015% oppervlakteactieve stof. Moneymaker-PtoR zaailingen overleefden (n = 5) en Moneymaker-PtoS zaailingen (n = 5) overleden. Het aantal overlevende zaailingen voor elk genotype uit het totale geteste aantal wordt weergegeven. Schaalbalk = 1 cm. Klik hier om een grotere versie van dit cijfer te bekijken.
Fenotypische screening van wilde toetredingen met behulp van de zaailing resistentie test
Figuur 6 toont representatieve resultaten voor zaailingen van gevoelige en resistente toetredingen 10-14 dagen na overstromingen met PstT1. Gevoelige toetredingen omvattenRG-PtoR, S. pimpinellifolium LA1375, en S. pimpinellifolium LA1606, en resistente toetredingen omvatten S. neorickii LA1329. Tien dagen oude zaailingen werden overstroomd met 10 mM MgCl2 + 0,015% oppervlakteactieve stof als een negatieve controle, en PstT1 bij een optische dichtheid van 0,0075 + 0,015% oppervlakteactieve stof. De zaailingen werden fenotypeerd ten minste 10 dagen na overstromingen, als PstT1-geïnfecteerde zaailingen stierven langzamer dan PstDC3000-geïnfecteerde zaailingen. Mock-ingeëntzaailingen waren groen, gezond en actief groeiende. Deze controle is belangrijk om ervoor te zorgen dat de toetredingen niet gevoelig zijn voor de concentratie van oppervlakteactieve stoffen en om ervoor te zorgen dat er geen bacteriële besmetting optreedt. De gevoelige toetredingen (Rio Grande-PtoR [n = 7], S. pimpinellifolium LA1375 [n = 7], en S. pimpinellifolium LA1606 [n = 5]) waren dood, hadden bruine apicale meristems, en misten nieuwe groei 10-14 dagen na inenting met PstT1. Daarentegen vertoonden twee S. neorickii LA1329 (n = 3) zaailingen een hoog niveau van nieuwe, groene groei en overleefden infectie met PstT1 (figuur 6). Drie LA1329 zaailingen ontkiemden niet. Typisch, 5-7 individuen werden gescreend voor elke toetreding in een primair scherm om de prevalentie van resistentie in de bevolking te bepalen. Wanneer een meer genetisch complexe wilde toetreding, zoals LA1329, wordt overspoeld met PstT1, de weerstand fenotypes tonen iets meer variabiliteit onder individuele zaailingen, in vergelijking met Moneymaker-PtoR behandeld met PstDC3000. Echter, de weerstand fenotypes waren meestal minder variabel dan die gezien in F2 mapping populaties. Zo werden binaire fenotyperingscriteria gebruikt voor LA1329.

Figuur 6: Fenotypische karakterisering van resistentie of ziektesymptomen 10-14 dagen na infectie bij wilde toetredingen. Rio Grande-PtoR, S. pimpinellifolium LA1606, S. pimpinellifolium LA1375 en S. neorickii LA1329 tomatenzaailingen werden geteeld op 0,5x MS platen gedurende 10 dagen, en vervolgens overspoeld met PstT1 (OD600 = 0,0075) + 0,015% oppervlakteactieve stof. Het aantal overlevende zaailingen voor elke wilde toetreding uit het totale geteste aantal wordt vermeld. Schaalbalk = 1 cm. Klik hier om een grotere versie van dit cijfer te bekijken.
Kwantitatieve beoordeling van bacteriële groei met behulp van de zaailing overstromingtest
Om te bevestigen dat de waargenomen weerstand in LA1329 tegen PstT1 resulteerde in een lagere bacteriële groei, werden bacteriële groeitests uitgevoerd in tomatenzaailingen. Het niveau van pstT1 groei in Moneymaker-PtoS en S. neorickii LA1329 werd bepaald 4 dagen na de infectie. Moneymaker-PtoS is een bijna-isogenische lijn met consistente gevoeligheid onder individuele zaailingen. Wilde toetredingen zoals S. neorickii LA1329 zijn vaak genetisch complexer. LA1329 vertoont ongeveer 60% weerstand tegen PstT1 over de bevolking22. Omdat zaailingen hun cotyledons na infectie kunnen laten vallen, werd op elke plaat één zaailing gekweekt om bacteriële groei in de geoogste cotyledon te correleren met de algehele zaailing overleving of de dood zoals bepaald fenotypisch ten minste 10 dagen na overstromingen. De bacteriële tellingen op dag 4 voor elke zaailing werden genormaliseerd tot 0,01 g weefsel en omgezet in loggroei (CFU/0,01 g(log10)). Log groei voor fenotypisch resistente LA1329 zaailingen (LA1329RES) of fenotypisch vatbare zaailingen (LA1329SUS) werden afzonderlijk samengevoegd en vergeleken met elkaar en de gevoelige cultivar Moneymaker-PtoS. Zo was er een verschil in 1,7 log in bacteriële groei tussen LA1329RES (log 6.3) en LA1329SUS (log 8.0) en een 1,6 log verschil tussen LA1329RES (log 6.3) en Moneymaker-PtoS (log 7.9) (figuur 7). Daarom correleerde fenotypische resistentie met kwantitatieve resistentie in de zaailingtests.

Figuur 7: Resistente Solanum neorickii LA1329 zaailingen ondersteunen een lagere bacteriële groei dan Moneymaker-PtoS of vatbare S. neorickii LA1329. Bacteriële tellingen werden vastgesteld 4 dagen na inenting van S. neorickii LA1329 (n = 14) en Moneymaker-PtoS (n = 10) zaailingen besmet met PstT1 en normalisatie werd uitgevoerd tot 0,01 g weefsel. Voor LA1329 werden de twee fenotypische groepen, vatbaar (SUS) of resistent (RES), geobserveerd en afzonderlijk geteld. Boven de balk * = statistisch significant verschil bepaald door een eenfactoranalyse van variantie. Er werd gebruik gemaakt van een algemene lineaire modelprocedure (p < 0,001), gevolgd door een meervoudige vergelijking van middelen met behulp van tukey's post hoc-test. Foutbalken = standaardfout. De figuur geeft één representatief experiment aan. Klik hier om een grotere versie van dit cijfer te bekijken.
Subscription Required. Please recommend JoVE to your librarian.
Discussion
Een protocol voor overstromingsinenting met PstDC3000 of PstT1 geoptimaliseerd om resistentie tegen deze bacteriële stammen in tomatenzaailingen te detecteren wordt beschreven. Er zijn verschillende kritische parameters voor optimale resultaten in de zaailing resistentie test, met inbegrip van bacteriële concentratie en oppervlakteactieve concentratie, die empirisch werden bepaald22. Voor PstDC3000 werd de optische dichtheid geoptimaliseerd om volledige overleving te bereiken op een resistente cultivar met de Pto/Prf-cluster en volledige dood op een gevoelige cultivar die de Pto/Prf cluster22miste. Voor een stam zoals PstT1, waar geen resistente rassen bekend zijn, werd de optische dichtheid geoptimaliseerd als de laagst mogelijke voor consistente en volledige plantensterfte22. Uppalapati et al.24 ontwierpen een tomatenzaaieltest om de pathogenese van PstDC3000 en de virulentiefunctie van coronatine te onderzoeken. In deze virulentie test, infecties werden uitgevoerd met behulp van bacteriën geconcentreerd op een OD600 van 0,124, 20x hoger dan de optische dichtheid van stammen gebruikt in onze weerstand test. Erkenning van PstDC3000-effectoren AvrPto en AvrPtoB in tomatenzaailingen die het Pto/Prf-gencluster dragen, resulteert in ETI en een macroscopische HR22. In de context van een sterke immuunrespons zoals ETI werd een lagere bacteriële titer gebruikt voor PstDC3000 om overweldigende genetische resistentie van de Pto/Prf-gencluster 22te voorkomen. Bovendien suggereren deze resultaten dat een hoge bacteriële concentratie zwakkere immuunreacties zoals PTI of kwantitatieve gedeeltelijke resistentie kan overweldigen, waarbij meerdere genen bijdragen aan het totale fenotype. Oppervlakteactieve stof is noodzakelijk om de bacteriën aan het bladoppervlak te laten hechten; Hoge concentraties kunnen echter chlorose van het blad22veroorzaken . We hebben eerder een reeks oppervlakteactieve concentraties getest om empirisch de ideale concentratie in 10-dagenoude tomatenzaailingen22te bepalen. Bij het testen van nieuwe soorten die kunnen verschillen in hun gevoeligheid voor oppervlakteactieve stof, moet de oppervlakteactieve concentratie worden geoptimaliseerd om een concentratie te identificeren die geen schade of chlorose veroorzaakt bij afwezigheid van bacteriën. Geschikte testvoorwaarden vereisen optimalisatie van een oppervlakteactieve concentratie die geen schade veroorzaakt, en een bacteriële concentratie die ziekte veroorzaakt bij alle gevoelige controles.
Extra kritische parameters voor succes in de zaailing overstromingstest zijn het gebruik van zaailingen in specifieke ontwikkelingsstadia (10-dagen oude zaailingen) (figuur 1),het handhaven van stabiele groeikameromstandigheden (lichtintensiteit van ongeveer 200 μE m-2 s-1,constante temperatuur van 22 °C, 16 uur licht) en het uitvoeren van experimenten in een steriele bioveiligheidskast. Mediavolume boven 45 mL of lager dan 35 mL kan van invloed zijn op een consistente dood van vatbare controles, omdat het volume van invloed kan zijn op de omringende microomgeving van de zaailingen op de plaat. Bijvoorbeeld, verschillen in relatieve vochtigheid in de verzegelde platen kunnen invloed hebben op de infectiviteit van de bacteriën en het vermogen van de planten om infectie te overleven. Steriele techniek is van cruciaal belang, omdat besmetting op de platen de bron van dood of gevoeligheid in zaailingen kan verwarren. Bovendien, omdat planten-pathogene interacties worden beïnvloed door de circadiane klok24,25,26, wordt aanbevolen dat de planten worden besmet op een consistent tijdstip van de dag.
Pst is een bladziekteverwekker die bij voorkeur de luchtdelen van tomatenzaailingen koloniseert, inclusief de cotyledons24 (figuur 3). Daarom, kwalitatieve fenotypering in de zaailing overstromingassay richt zich op groei en ziekte symptomen in luchtdelen van de zaailing, en weefsel voor de bacteriële groei test wordt bemonsterd uit de cotyledons voor kwantitatieve analyse. Na overstromingsinenting kunnen zaailingen binnen 7-10 dagen na inenting met PstDC3000 of 10-14 dagen na inenting met PstT1 sterven, zoals besproken in sectie 11. Zaailing dood wordt gevisualiseerd door een bruine apicalmeristem, gearresteerd epicotyl verlenging, en / of gearresteerd vegetatieve groei. Als verschillende bacteriële stammen worden gebruikt, zal de timing empirisch moeten worden bepaald. Bovendien moet de progressie van de ziekte op controleplanten dagelijks worden gecontroleerd na overstromingen totdat een consistent tijdsbestek vanaf het begin van ziektesymptomen tot zaailingdood kan worden geïdentificeerd. Afhankelijk van de genotypen en behandelingen die in de overstromingstest worden gebruikt, kunnen zaailingfenotypes worden geregistreerd als binaire fenotypes of op een ziektespectrum(figuur 4). Een breder spectrum van fenotypes kan worden waargenomen wanneer overstromingen f2-populaties van wilde tomateninkaart nemen die zijn overgestoken naar gevoelige cultivars (figuur 4C). Het kan het beste zijn om fenotype scheiden populaties op een ziektespectrum, afhankelijk van hoe snel de zaailing sterft en de mate van nieuwe vegetatieve groei en vertakking(figuur 4C). De zaailing overstromingstest kan ook worden gebruikt in combinatie met de zaailing bacteriële groei test om kwantitatief te beoordelen niveaus van bacteriële groei in verband met kwalitatieve fenotypen in individuele zaailingen (figuur 7). Zeer grote reducties (d.w.z. ~log 3) in bacteriële groei of sterke resistentie bij resistente zaailingen van een wilde toetreding in vergelijking met een gevoelige cultivar suggereren dat de onderliggende genetische basis van resistentie te wijten kan zijn aan ETI22. Kleinere reducties van bacteriële groei (d.w.z. ~log 1.7), zoals waargenomen in LA1329 zaailingen, kan te wijten zijn aan de bijdrage van een zwakkere weerstand van kwantitatieve eigenschap loci en/of PTI. Zo kan de zaailing groeitest een belangrijk instrument zijn bij het verder karakteriseren van resistentie in wilde tomatenlijnen.
Typisch, genetische schermen zijn uitgevoerd op vier- tot vijf weken oude volwassen tomatenplanten om de genetische basis van P. syringae resistentie in wilde toetredingen20,21identificeren . Volwassen tomatenplanten vereisen veel langere groeitijden, vereisen meer ruimte in de groeikamer, en zijn veel grotere planten, wat betekent dat meestal weinig individuen worden gescreend voor elke lijn. De zaailing overstromingstest biedt een krachtige, alternatieve aanpak bij de identificatie van P. syringae resistentie in wilde tomaten toetredingen. Screening in de zaailing fase maakt het mogelijk een grote steekproef grootte te testen die bijzonder voordelig kan zijn bij het opsporen van resistentie in genetisch complexe populaties. Verminderde behoefte aan groeiruimte ruimte en groeitijd vergemakkelijken een hoge doorvoer aanpak en snelle detectie van natuurlijke resistentie in wilde toetredingen tot opkomende ziekteverwekkers. Bovendien beperkt de weerstand van P. syringae die in de zaailingfase in deze test is vastgesteld, zich niet tot de ontwikkelingsfase. S. neorickii LA1329 en S. habrochaites LA1253 werden aanvankelijk geïdentificeerd in de zaailing fase en tonen ook weerstand tegen PstT1 in volwassen planten zoals eerder beschreven22.
De zaailing overstromingstest is een veelzijdig protocol dat kan worden gewijzigd en geoptimaliseerd om gastheerweerstand tegen andere P. syringae-stammen te detecteren. Het kan mogelijk verder worden toegepast in de context van verschillende bacteriële pathogenen van tomaat, zoals de Xanthomonas soorten. Deze methode zal het zoeken naar nieuwe bronnen van ziekteresistentie tegen bacteriële pathogenen versnellen.
Subscription Required. Please recommend JoVE to your librarian.
Disclosures
De auteurs hebben niets te onthullen.
Acknowledgments
Wij danken Jamie Calma voor het testen van het effect van media-volume op ziekte of resistentie resultaten. Wij danken Dr. Maël Baudin en Dr. Karl J. Scheiber van het Lewis Lab voor het geven van constructieve opmerkingen en suggesties over het manuscript. Het onderzoek naar plantenimmuniteit in het Lewis-laboratorium werd ondersteund door het USDA ARS 2030-21000-046-00D en 2030-21000-050-00D (JDL) en het NSF Directoraat biologische wetenschappen IOS-1557661 (JDL).
Materials
| Name | Company | Catalog Number | Comments |
| 3M Tape Micropore 1/2" x 10 YD CS 240 (1.25 cm x 9.1 m) | VWR International | 56222-182 | |
| 3mm borosilicate glass beads | Friedrich & Dimmock | GB3000B | |
| Bacto peptone | BD | 211677 | |
| Bacto agar | BD | 214010 | |
| Biophotometer Plus | Eppendorf | E952000006 | |
| Biosafety cabinet, class II type A2 | |||
| BRAND Disposable Plastic Cuvettes, Polystyrene | VWR International | 47744-642 | |
| Chenille Kraft Flat Wood Toothpicks | VWR International | 500029-808 | |
| cycloheximide | Research Products International | C81040-5.0 | |
| Dibasic potassium phosphate anhydrous, ACS grade | Fisher Scientific | P288-500 | |
| Dimethylformamide | |||
| Dissecting microscope (Magnification of at least 10x) | |||
| Ethanol - 190 Proof | |||
| Falcon polystyrene 96 well microplates, flat-bottom | Fisher Scientific | 08-772-3 | |
| Glass Alcohol Burner Wick | Fisher Scientific | S41898A / No. W-125 | |
| Glass Alcohol Burners | Fisher Scientific | S41898 / No. BO125 | |
| Glycerol ACS reagent | VWR International | EMGX0185-5 | |
| Kimberly-Clark™ Kimtech Science™ Kimwipes™ Delicate Task Wipers | Fisher Scientific | 06-666-A | |
| Magnesium chloride, ACS grade | VWR International | 97061-356 | |
| Magnesium sulfate heptahydrate, ACS grade | VWR International | 97062-130 | |
| Microcentrifuge tubes, 1.5 mL | |||
| Microcentrifuge tubes, 2.2 mL | |||
| Mini Beadbeater-96, 115 volt | Bio Spec Products Inc. | 1001 | |
| Murashige & Skoog, Basal Salts | Caisson Laboratories, Inc. | MSP01-50LT | |
| Pipet-Lite XLS LTS 8-CH Pipet 20-200uL | Rainin | L8-200XLS | |
| Pipet-Lite XLS LTS 8-CH Pipet 2-20uL | Rainin | L8-20XLS | |
| Polystyrene 100mm x 25mm sterile petri dish | VWR International | 89107-632 | |
| Polystyrene 150mm x 15mm sterile petri dish | Fisher Scientific | FB08-757-14 | |
| Polystyrene 150x15mm sterile petri dish | Fisher Scientific | 08-757-148 | |
| Pure Bright Germicidal Ultra Bleach 5.7% Available Chlorine (defined as 100% bleach) | Staples | 1013131 | |
| Rifampicin | Gold Biotechnology | R-120-25 | |
| Silwet L-77 (non-ionic organosilicone surfactant co-polymer C13H34O4Si3 surfactant) | Fisher Scientific | NCO138454 | |
| Tips LTS 20 μL 960/10 GPS-L10 | Rainin | 17005091 | |
| Tips LTS 250 μL 960/10 GPS-L250 | Rainin | 17005093 | |
| VWR dissecting forceps fine tip, 4.5" | VWR International | 82027-386 |
References
- Underwood, W., Melotto, M., He, S. Y. Role of plant stomata in bacterial invasion. Cell Microbiology. 9 (7), 1621-1629 (2007).
- Zipfel, C. Early molecular events in PAMP-triggered immunity. Current Opinion in Plant Biology. 12 (4), 414-420 (2009).
- Galan, J. E., Wolf-Watz, H. Protein delivery into eukaryotic cells by type III secretion machines. Nature. 444 (7119), 567-573 (2006).
- Lewis, J. D., Desveaux, D., Guttman, D. S. The targeting of plant cellular systems by injected type III effector proteins. Seminars in Cell and Developmental Biology. 20 (9), 1055-1063 (2009).
- Schreiber, K. J., Baudin, M., Hassan, J. A., Lewis, J. D. Die another day: molecular mechanisms of effector-triggered immunity elicited by type III secreted effector proteins. Seminars in Cell and Developmental Biology. 56, 124-133 (2016).
- Heath, M. C. Hypersensitive response-related death. Plant Molecular Biology. 44 (3), 321-334 (2000).
- Boyd, L. A., Ridout, C., O'Sullivan, D. M., Leach, J. E., Leung, H. Plant-pathogen interactions: disease resistance in modern agriculture. Trends in Genetics. 29 (4), 233-240 (2013).
- Pitblado, R. E., MacNeill, B. H. Genetic basis of resistance to Pseudomonas syringae pv. tomato in field tomatoes. Canadian Journal of Plant Pathology. 5 (4), 251-255 (1983).
- Pedley, K. F., Martin, G. B. Molecular basis of Pto-mediated resistance to bacterial speck disease in tomato. Annual Reviews of Phytopathology. 41, 215-243 (2003).
- Ronald, P. C., Salmeron, J. M., Carland, F. M., Mehta, A. Y., Staskawicz, B. J. The cloned avirulence gene AvrPto induces disease resistance in tomato cultivars containing the Pto resistance gene. Journal of Bacteriology. 174 (5), 1604-1611 (1992).
- Martin, G. B., et al. Map-based cloning of a protein kinase gene conferring disease resistance in tomato. Science. 262 (5138), 1432-1436 (1993).
- Salmeron, J. M., Barker, S. J., Carland, F. M., Mehta, A. Y., Staskawicz, B. J. Tomato mutants altered in bacterial disease resistance provide evidence for a new locus controlling pathogen recognition. Plant Cell. 6 (4), 511-520 (1994).
- Salmeron, J. M., et al. Tomato Prf is a member of the leucine-rich repeat class of plant disease resistance genes and lies embedded within the Pto kinase gene cluster. Cell. 86 (1), 123-133 (1996).
- Scofield, S. R., et al. Molecular basis of gene-for-gene specificity in bacterial speck disease of tomato. Science. 274 (5295), 2063-2065 (1996).
- Kunkeaw, S., Tan, S., Coaker, G. Molecular and evolutionary analyses of Pseudomonas syringae pv. tomato race 1. Molecular Plant-Microbe Interactions. 23 (4), 415-424 (2010).
- Cai, R., et al. The plant pathogen Pseudomonas syringae pv. tomato is genetically monomorphic and under strong selection to evade tomato immunity. PLoS Pathogens. 7 (8), 1002130 (2011).
- Almeida, N. F., et al. A draft genome sequence of Pseudomonas syringae pv. tomato T1 reveals a type III effector repertoire significantly divergent from that of Pseudomonas syringae pv. tomato DC3000. Molecular Plant-Microbe Interactions. 22 (1), 52-62 (2009).
- Lin, N. C., Abramovitch, R. B., Kim, Y. J., Martin, G. B. Diverse AvrPtoB homologs from several Pseudomonas syringae pathovars elicit Pto-dependent resistance and have similar virulence activities. Applied and Environmental Microbiology. 72 (1), 702-712 (2006).
- Rose, L. E., Langley, C. H., Bernal, A. J., Michelmore, R. W. Natural variation in the Pto pathogen resistance gene within species of wild tomato (Lycopersicon). I. Functional analysis of Pto alleles. Genetics. 171 (1), 345-357 (2005).
- Thapa, S. P., Miyao, E. M., Davis, R. M., Coaker, G. Identification of QTLs controlling resistance to Pseudomonas syringae pv. tomato race 1 strains from the wild tomato Solanum habrochaites LA1777. Theoretical and Applied Genetics. 128 (4), 681-692 (2015).
- Bao, Z. L., et al. Identification of a candidate gene in Solanum habrochaites for resistance to a race 1 strain of Pseudomonas syringae pv. tomato. Plant Genome. 8 (3), 1-15 (2015).
- Hassan, J. A., Zhou, Y. J., Lewis, J. D. A rapid seedling resistance assay identifies wild tomato lines that are resistant to Pseudomonas syringae pv. tomato race 1. Molecular Plant-Microbe Interactions. 30 (9), 701-709 (2017).
- King, E. O., Ward, M. K., Raney, D. E. Two simple media for the demonstration of pyocyanin and fluorescin. Journal of Laboratory and Clinical Medicine. 44 (2), 301-307 (1954).
- Uppalapati, S. R., et al. Pathogenicity of Pseudomonas syringae pv. tomato on tomato seedlings: phenotypic and gene expression analyses of the virulence function of coronatine. Molecular Plant-Microbe Interactions. 21 (4), 383-395 (2008).
- Bhardwaj, V., Meier, S., Petersen, L. N., Ingle, R. A., Roden, L. C. Defence responses of Arabidopsis thaliana to infection by Pseudomonas syringae are regulated by the circadian clock. PLoS One. 6 (10), 26968 (2011).
- Lu, H., McClung, C. R., Zhang, C. Tick tock: circadian regulation of plant innate immunity. Annual Review of Phytopathology. 55, 287-311 (2017).
- Wang, W., et al. Timing of plant immune responses by a central circadian regulator. Nature. 470 (7332), 110-114 (2011).
Tags
Bio-engineering Pseudomonas syringae tomaat resistentie tegen ziekten scherm bacteriële groei fenotypesErratum
Formal Correction: Erratum: High-Throughput Identification of Resistance to Pseudomonas syringae pv. Tomato in Tomato using Seedling Flood Assay
Posted by JoVE Editors on 10/18/2023.
Citeable Link.
An erratum was issued for: High-Throughput Identification of Resistance to Pseudomonas syringae pv. Tomato in Tomato using Seedling Flood Assay. The Introduction, Protocol, Representative Results and Discussion sections were updated.
The last paragraph of the Introduction section was updated from:
In the seedling flood assay described in this protocol, tomato seedlings are grown on Petri dishes of sterile Murashige and Skoog (MS) media for 10 days and then are flooded with an inoculum containing the bacteria of interest and a surfactant. Following flooding, seedlings can be quantitatively evaluated for disease resistance via bacterial growth assays. Additionally, seedling survival or death can act as a discrete resistance or disease phenotype 7–14 days after flooding. This approach offers a high-throughput alternative for screening large numbers of wild tomato accessions for resistance to Pst race 1 strains, such as Pst strain T1 (PstT1), and can easily be adapted to other bacterial strains of interest.
to:
In the seedling flood assay described in this protocol, tomato seedlings are grown on Petri dishes of sterile Murashige and Skoog (MS) media for 10 days and then are flooded with an inoculum containing the bacteria of interest and a surfactant. Following flooding, seedlings can be quantitatively evaluated for disease resistance via bacterial growth assays. Additionally, seedling survival or death can act as a discrete resistance or disease phenotype 7–14 days after flooding. This approach offers a high-throughput alternative for screening large numbers of wild tomato accessions for resistance to Pst race 1 strains, such as Pst strain 19 (Pst19), and can easily be adapted to other bacterial strains of interest.
Step 4.8 of the Protocol section was updated from:
- After 1 h, transfer the bottle to the biosafety cabinet and under aseptic conditions, add 1,600 µL of sterile 1 M MgSO4, and appropriate antibiotics to the media.
NOTE: For rifampicin resistant strains PstDC3000 and PstT1, use rifampicin dissolved in dimethylformamide at a final concentration of 50 µg/mL. Use cycloheximide dissolved in ethanol at a final concentration of 50 µg/mL to prevent fungal growth on the plates.
to:
- After 1 h, transfer the bottle to the biosafety cabinet and under aseptic conditions, add 1,600 µL of sterile 1 M MgSO4, and appropriate antibiotics to the media.
NOTE: For rifampicin resistant strains PstDC3000 and Pst19, use rifampicin dissolved in dimethylformamide at a final concentration of 50 µg/mL. Use cycloheximide dissolved in ethanol at a final concentration of 50 µg/mL to prevent fungal growth on the plates.
Step 5.2 of the Protocol section was updated from:
- Patch bacteria (i.e., PstT1) from a glycerol stock onto KB agar with appropriate antibiotics (section 4).
to:
- Patch bacteria (i.e., Pst19) from a glycerol stock onto KB agar with appropriate antibiotics (section 4).
Step 5.6 of the Protocol section was updated from:
- For PstT1, incubate the KB plate at 28 ˚C for 48 h prior to using bacteria in the flood experiment.
to:
- For Pst19, incubate the KB plate at 28 ˚C for 48 h prior to using bacteria in the flood experiment.
Step 6 of the Protocol section was updated from:
6. Preparation of PstT1 inoculum
to
6. Preparation of Pst19 inoculum
Step 6.2 of the Protocol section was updated from:
- Perform serial dilutions using sterile 10 mM MgCl2 solution in the biosafety cabinet. For PstT1, use a spectrophotometer to make inoculum with a starting concentration of OD600 = 0.1.
to:
- Perform serial dilutions using sterile 10 mM MgCl2 solution in the biosafety cabinet. For Pst19, use a spectrophotometer to make inoculum with a starting concentration of OD600 = 0.1.
Step 6.3 of the Protocol section was updated from:
- For PstT1, make a 1/10 dilution from the initial resuspension at OD600 = 0.1 to obtain a serial dilution at a concentration of OD600 = 0.01.
to:
- For Pst19, make a 1/10 dilution from the initial resuspension at OD600 = 0.1 to obtain a serial dilution at a concentration of OD600 = 0.01.
Step 8.3 of the Protocol section was updated from:
- Set a timer for 3 min. Measure 6 mL of final inoculum (PstT1 OD600 = 0.0075 [section 6] or PstDC3000 OD600 = 0.005 [section 7]) and transfer 6 mL of inoculum to each plate with the 10-day-old seedlings.
to:
- Set a timer for 3 min. Measure 6 mL of final inoculum (Pst19 OD600 = 0.0075 [section 6] or PstDC3000 OD600 = 0.005 [section 7]) and transfer 6 mL of inoculum to each plate with the 10-day-old seedlings.
Step 8.11 of the Protocol section was updated from:
- Phenotype after 7–10 days for PstDC3000 or 10–14 days for PstT1 (section 11). If carrying out bacterial growth assays, collect leaf tissue after 4 days (sections 9 and 10) and then phenotype (section 11). Alternatively, perform phenotypic analysis and bacterial growth assays on separate sets of plants.
to:
- Phenotype after 7–10 days for PstDC3000 or 10–14 days for Pst19 (section 11). If carrying out bacterial growth assays, collect leaf tissue after 4 days (sections 9 and 10) and then phenotype (section 11). Alternatively, perform phenotypic analysis and bacterial growth assays on separate sets of plants.
Step 10.7 of the Protocol section was updated from:
- After obtaining colony counts (Figure 2B), normalize the counts to 0.01 g of tissue for seedlings and convert to log bacterial growth (Table 1).
NOTE: The average mass of one Moneymaker-PtoS cotyledon is 0.01 g and is empirically determined22.
| Genotype1 Column A | Tissue Weight (g) Column B | # of Colonies in a spot Column C | Dilution factor for spot2 Column D | Adjusted # of Colonies3 Column E | Dilution factor for serial dilution Column F | Total # of Colonies Column G (cfu/0.01 g)4 | Average # of Colonies (cfu/0.01 g) Column H | Average Log Growth (cfu/0.01 g (log10)) Column I |
| Sample 1 | 0.004 g | 10 | 200 | calculated as: (C2 x 0.01 g) / B2 = 25 | 1000 | calculated as: (D2 x E2 x F2) = 5000000 | average for sample 1 through last sample: (ie. average G1:G3) = 7000000 | log of average ie. log(H2) = 6.85 |
| Sample 2 | 0.003 g | 15 | 200 | 50 | 1000 | 10000000 | ||
| Sample 3 | 0.002 g | 6 | 200 | 30 | 1000 | 6000000 | ||
| 1Data shown for 3 samples | ||||||||
| 2Based on plating 5 µL x 200 for 1 mL | ||||||||
| 3Cotyledons are too small to core so colony counts were normalized to 0.01 g of tissue based on the average mass of one MoneyMaker-PtoS cotyledon (data not shown) | ||||||||
| 4Adjusted per mL based on volume plated | ||||||||
Table 1: Sample calculations for seedling bacterial growth assay. Sample calculations demonstrate how to normalize bacterial counts and determine log bacterial growth.
to:
- After obtaining colony counts (Figure 2B), normalize the counts to 0.1 g of tissue for seedlings and convert to log bacterial growth (Table 1).
NOTE: The average mass of one Moneymaker-PtoS cotyledon is 0.1 g and is empirically determined22.
| Genotype1 Column A | Tissue Weight (g) Column B | # of Colonies in a spot Column C | Dilution factor for spot2 Column D | Adjusted # of Colonies3 Column E | Dilution factor for serial dilution Column F | Total # of Colonies Column G (cfu/0.01 g)4 | Average # of Colonies (cfu/0.01 g) Column H | Average Log Growth (cfu/0.1 g (log10)) Column I |
| Sample 1 | 0.04 g | 10 | 200 | calculated as: (C2 x 0.1 g) / B2 = 25 | 1000 | calculated as: (D2 x E2 x F2) = 5000000 | average for sample 1 through last sample: (ie. average G1:G3) = 7000000 | log of average ie. log(H2) = 6.85 |
| Sample 2 | 0.03 g | 15 | 200 | 50 | 1000 | 10000000 | ||
| Sample 3 | 0.02 g | 6 | 200 | 30 | 1000 | 6000000 | ||
| 1Data shown for 3 samples | ||||||||
| 2Based on plating 5 µL x 200 for 1 mL | ||||||||
| 3Cotyledons are too small to core so colony counts were normalized to 0.1 g of tissue based on the average mass of one MoneyMaker-PtoS cotyledon (data not shown) | ||||||||
| 4Adjusted per mL based on volume plated | ||||||||
Table 1: Sample calculations for seedling bacterial growth assay. Sample calculations demonstrate how to normalize bacterial counts and determine log bacterial growth.
Step 11.3 of the Protocol section was updated from:
- Phenotype plants infected with PstT1 at 10–14 days after flood inoculation.
to:
- Phenotype plants infected with Pst19 at 10–14 days after flood inoculation.
Figure 4 in the Protocol section was updated from:

Figure 4: Schematic representation of expected phenotypes for seedling resistance and death in various genetic backgrounds. (A) Seedlings of Rio Grande-PtoR and the near-isogenic cultivar Rio Grande-PtoS are displayed 7 days after flooding with PstDC3000 (OD600 = 0.005) + 0.015% surfactant. Rio Grande-PtoR displays consistent resistance, and Rio Grande-PtoS displays consistent susceptibility to infection with PstDC3000. These lines give rise to discrete and binary phenotypes. (B) Seedlings of a wild accession, such as Solanum neorickii LA1329, are shown 10 days after flooding with PstT1 (OD600 = 0.0075) + 0.015% surfactant. Seedlings display phenotypic variability but were recorded as binary phenotypes. The amount of phenotypic variability and the method of phenotyping (binary resistance or resistance spectrum) will depend on the particular accession tested. (C) Mapping populations generated by outcrossing wild accessions to susceptible cultivars may display a wider spectrum of phenotypes in F2 segregating populations. In this case, it may be most appropriate to record seedling phenotypes on a spectrum. Highly susceptible seedlings from a mapping population may be phenotyped for death as early as day 7 when flooded with PstT1, and typically show a brown apical meristem, no to very little extension of the epicotyl, and no new, green vegetative growth. The apical meristem of susceptible seedlings may stay green or very light brown for more time, and there may be some extension of the epicotyl and very little vegetative growth, which turns brown and arrests by day 10. Individual seedlings can be phenotyped for resistance based on the amount of new and ongoing vegetative growth by day 14. Seedlings can then be grouped based on the phenotypes described above into different categories of resistance such as weak, medium, or strong resistance. Please click here to view a larger version of this figure.
to:
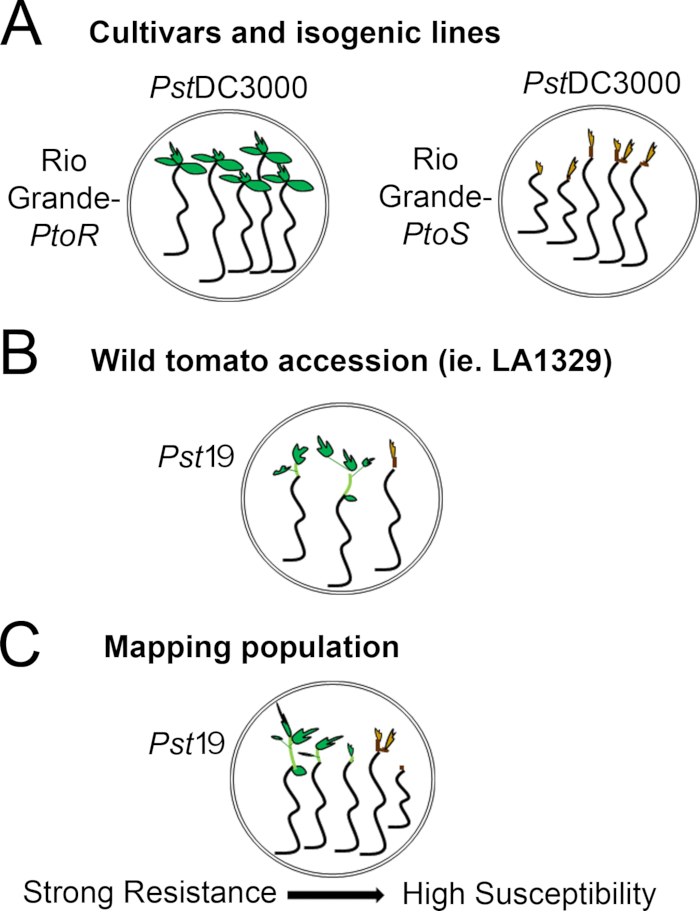
Figure 4: Schematic representation of expected phenotypes for seedling resistance and death in various genetic backgrounds. (A) Seedlings of Rio Grande-PtoR and the near-isogenic cultivar Rio Grande-PtoS are displayed 7 days after flooding with PstDC3000 (OD600 = 0.005) + 0.015% surfactant. Rio Grande-PtoR displays consistent resistance, and Rio Grande-PtoS displays consistent susceptibility to infection with PstDC3000. These lines give rise to discrete and binary phenotypes. (B) Seedlings of a wild accession, such as Solanum neorickii LA1329, are shown 10 days after flooding with Pst19 (OD600 = 0.0075) + 0.015% surfactant. Seedlings display phenotypic variability but were recorded as binary phenotypes. The amount of phenotypic variability and the method of phenotyping (binary resistance or resistance spectrum) will depend on the particular accession tested. (C) Mapping populations generated by outcrossing wild accessions to susceptible cultivars may display a wider spectrum of phenotypes in F2 segregating populations. In this case, it may be most appropriate to record seedling phenotypes on a spectrum. Highly susceptible seedlings from a mapping population may be phenotyped for death as early as day 7 when flooded with Pst19, and typically show a brown apical meristem, no to very little extension of the epicotyl, and no new, green vegetative growth. The apical meristem of susceptible seedlings may stay green or very light brown for more time, and there may be some extension of the epicotyl and very little vegetative growth, which turns brown and arrests by day 10. Individual seedlings can be phenotyped for resistance based on the amount of new and ongoing vegetative growth by day 14. Seedlings can then be grouped based on the phenotypes described above into different categories of resistance such as weak, medium, or strong resistance. Please click here to view a larger version of this figure.
The second paragraph of the Representative Results section was updated from:
Phenotypic screening of wild accessions using the seedling resistance assay
Figure 6 shows representative results for seedlings of susceptible and resistant accessions 10–14 days after flooding with PstT1. Susceptible accessions include RG-PtoR, S. pimpinellifolium LA1375, and S. pimpinellifolium LA1606, and resistant accessions include S. neorickii LA1329. Ten-day-old seedlings were flooded with 10 mM MgCl2 + 0.015% surfactant as a negative control, and PstT1 at an optical density of 0.0075 + 0.015% surfactant. The seedlings were phenotyped at least 10 days after flooding, as PstT1-infected seedlings died more slowly than PstDC3000-infected seedlings. Mock-inoculated seedlings were green, healthy, and actively growing. This control is important to ensure that the accessions are not sensitive to the concentration of surfactant, and to ensure there is no bacterial contamination. Susceptible accessions (Rio Grande-PtoR [n = 7], S. pimpinellifolium LA1375 [n = 7], and S. pimpinellifolium LA1606 [n = 5]) were dead, had brown apical meristems, and lacked new growth 10–14 days after inoculation with PstT1. In contrast, two S. neorickii LA1329 (n = 3) seedlings displayed a high level of new, green growth and survived infection with PstT1 (Figure 6). Three LA1329 seedlings did not germinate. Typically, 5–7 individuals were screened for each accession in a primary screen to determine the prevalence of resistance in the population. When a more genetically complex wild accession, such as LA1329, is flooded with PstT1, the resistance phenotypes display slightly more variability among individual seedlings, compared to Moneymaker-PtoR treated with PstDC3000. However, the resistance phenotypes were usually less variable than those seen in F2 mapping populations. Thus, binary phenotyping criteria was used for LA1329.
to:
Phenotypic screening of wild accessions using the seedling resistance assay
Figure 6 shows representative results for seedlings of susceptible and resistant accessions 10–14 days after flooding with Pst19. Susceptible accessions include RG-PtoR, S. pimpinellifolium LA1375, and S. pimpinellifolium LA1606, and resistant accessions include S. neorickii LA1329. Ten-day-old seedlings were flooded with 10 mM MgCl2 + 0.015% surfactant as a negative control, and Pst19 at an optical density of 0.0075 + 0.015% surfactant. The seedlings were phenotyped at least 10 days after flooding, as Pst19-infected seedlings died more slowly than PstDC3000-infected seedlings. Mock-inoculated seedlings were green, healthy, and actively growing. This control is important to ensure that the accessions are not sensitive to the concentration of surfactant, and to ensure there is no bacterial contamination. Susceptible accessions (Rio Grande-PtoR [n = 7], S. pimpinellifolium LA1375 [n = 7], and S. pimpinellifolium LA1606 [n = 5]) were dead, had brown apical meristems, and lacked new growth 10–14 days after inoculation with Pst19. In contrast, two S. neorickii LA1329 (n = 3) seedlings displayed a high level of new, green growth and survived infection with Pst19 (Figure 6). Three LA1329 seedlings did not germinate. Typically, 5–7 individuals were screened for each accession in a primary screen to determine the prevalence of resistance in the population. When a more genetically complex wild accession, such as LA1329, is flooded with Pst19, the resistance phenotypes display slightly more variability among individual seedlings, compared to Moneymaker-PtoR treated with PstDC3000. However, the resistance phenotypes were usually less variable than those seen in F2 mapping populations. Thus, binary phenotyping criteria was used for LA1329.
Figure 6 in the Representative Results section was updated from:
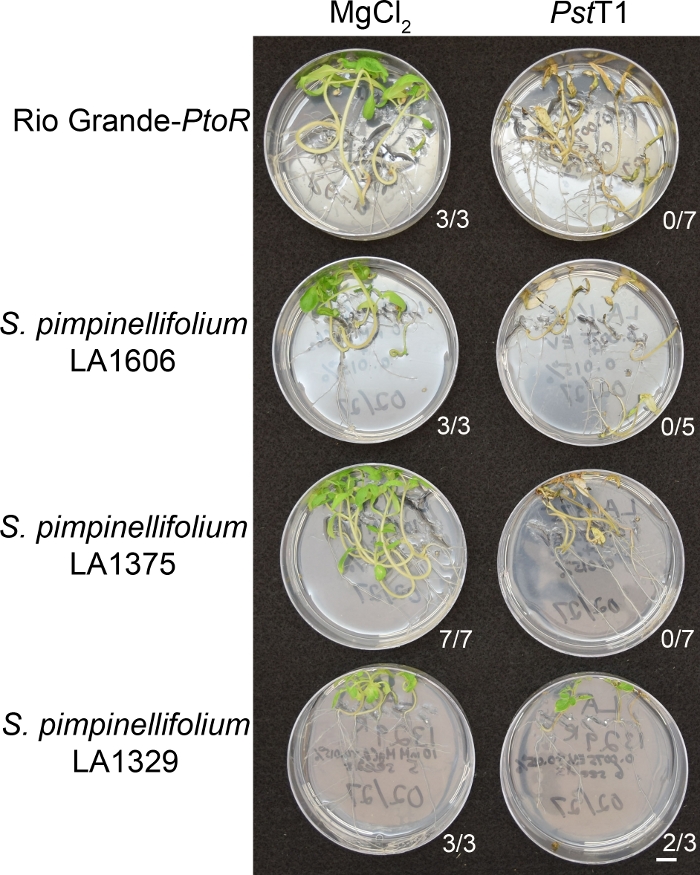
Figure 6: Phenotypic characterization of resistance or disease symptoms 10–14 days post-infection in wild accessions. Rio Grande-PtoR, S. pimpinellifolium LA1606, S. pimpinellifolium LA1375 and S. neorickii LA1329 tomato seedlings were grown on 0.5x MS plates for 10 days, and then flooded with PstT1 (OD600 = 0.0075) + 0.015% surfactant. The number of surviving seedlings for each wild accession out of the total number tested is shown. Scale bar = 1 cm. Please click here to view a larger version of this figure.
to:

Figure 6: Phenotypic characterization of resistance or disease symptoms 10–14 days post-infection in wild accessions. Rio Grande-PtoR, S. pimpinellifolium LA1606, S. pimpinellifolium LA1375 and S. neorickii LA1329 tomato seedlings were grown on 0.5x MS plates for 10 days, and then flooded with Pst19 (OD600 = 0.0075) + 0.015% surfactant. The number of surviving seedlings for each wild accession out of the total number tested is shown. Scale bar = 1 cm. Please click here to view a larger version of this figure.
The third paragraph of the Representative Results section was updated from:
Quantitative assessment of bacterial growth using the seedling flood assay
To confirm that the observed resistance in LA1329 to PstT1 resulted in lower bacterial growth, bacterial growth assays were carried out in tomato seedlings. The level of PstT1 growth in Moneymaker-PtoS and S. neorickii LA1329 was determined 4 days post-infection. Moneymaker-PtoS is a near-isogenic line with consistent susceptibility among individual seedlings. Wild accessions such as S. neorickii LA1329 are often more genetically complex. LA1329 displays approximately 60% resistance to PstT1 across the population22. Because seedlings may drop their cotyledons after infection, one seedling was grown on each plate to correlate bacterial growth in the harvested cotyledon with overall seedling survival or death as determined phenotypically at least 10 days after flooding. The bacterial counts on day 4 for each seedling were normalized to 0.01 g of tissue and converted to log growth (CFU/0.01 g(log10)). Log growth for phenotypically resistant LA1329 seedlings (LA1329RES) or phenotypically susceptible seedlings (LA1329SUS) were separately pooled and compared to each other and the susceptible cultivar Moneymaker-PtoS. For example, there was a 1.7 log difference in bacterial growth between LA1329RES (log 6.3) and LA1329SUS (log 8.0), and a 1.6 log difference between LA1329RES (log 6.3) and Moneymaker-PtoS (log 7.9) (Figure 7). Therefore, phenotypic resistance correlated with quantitative resistance in the seedling assays.
to:
Quantitative assessment of bacterial growth using the seedling flood assay
To confirm that the observed resistance in LA1329 to Pst19 resulted in lower bacterial growth, bacterial growth assays were carried out in tomato seedlings. The level of Pst19 growth in Moneymaker-PtoS and S. neorickii LA1329 was determined 4 days post-infection. Moneymaker-PtoS is a near-isogenic line with consistent susceptibility among individual seedlings. Wild accessions such as S. neorickii LA1329 are often more genetically complex. LA1329 displays approximately 60% resistance to Pst19 across the population22. Because seedlings may drop their cotyledons after infection, one seedling was grown on each plate to correlate bacterial growth in the harvested cotyledon with overall seedling survival or death as determined phenotypically at least 10 days after flooding. The bacterial counts on day 4 for each seedling were normalized to 0.01 g of tissue and converted to log growth (CFU/0.01 g(log10)). Log growth for phenotypically resistant LA1329 seedlings (LA1329RES) or phenotypically susceptible seedlings (LA1329SUS) were separately pooled and compared to each other and the susceptible cultivar Moneymaker-PtoS. For example, there was a 1.7 log difference in bacterial growth between LA1329RES (log 6.3) and LA1329SUS (log 8.0), and a 1.6 log difference between LA1329RES (log 6.3) and Moneymaker-PtoS (log 7.9) (Figure 7). Therefore, phenotypic resistance correlated with quantitative resistance in the seedling assays.
Figure 7 in the Representative Results section was updated from:
x
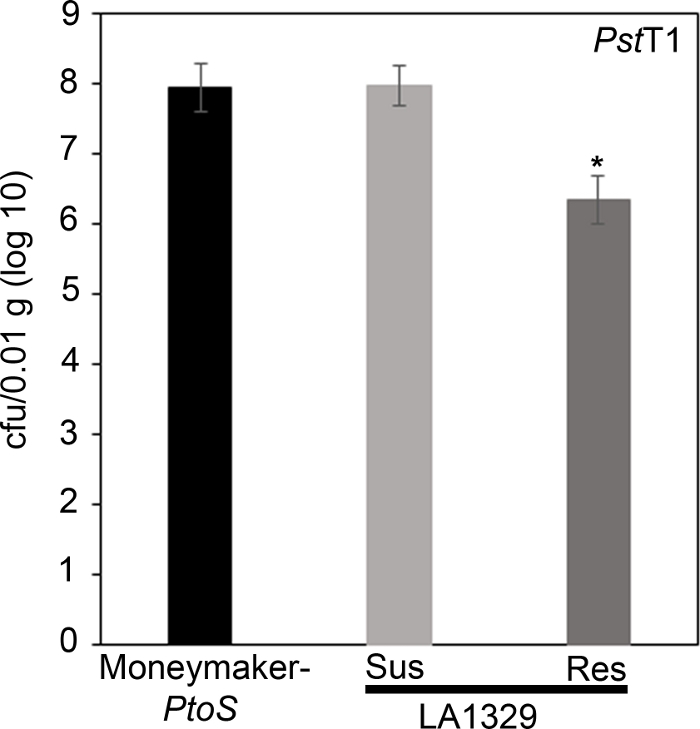
Figure 7: Resistant Solanum neorickii LA1329 seedlings support lower bacterial growth than Moneymaker-PtoS or susceptible S. neorickii LA1329. Bacterial counts were determined 4 days post-inoculation from S. neorickii LA1329 (n = 14) and Moneymaker-PtoS (n = 10) seedlings infected with PstT1 and normalization was performed to 0.01 g of tissue. For LA1329, the two phenotypic groups, susceptible (SUS) or resistant (RES), were observed and counted separately. Above the bar * = statistically significant difference determined by a one-factor analysis of variance. A general linear model procedure (p < 0.001) followed by a multiple comparison of means using Tukey's post hoc test was used. Error bars = standard error. The figure indicates one representative experiment. Please click here to view a larger version of this figure.
x
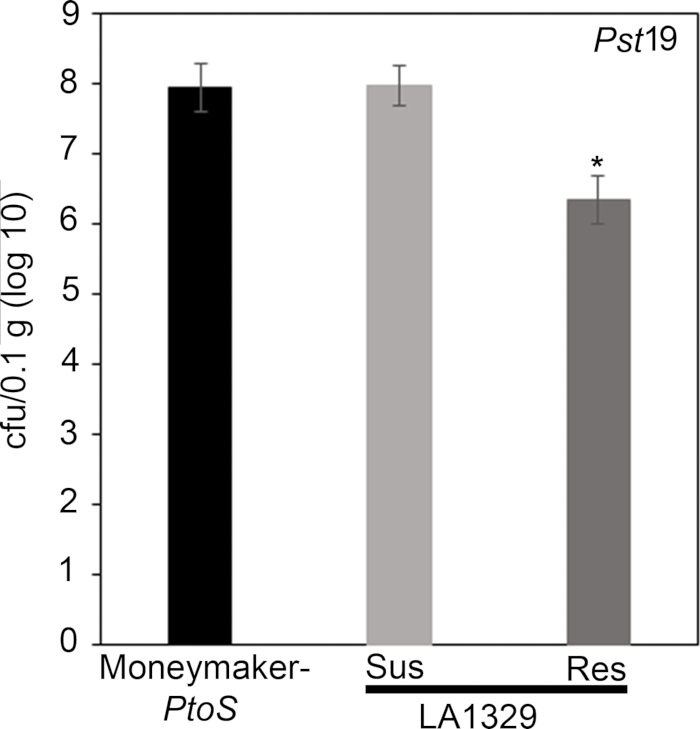
Figure 7: Resistant Solanum neorickii LA1329 seedlings support lower bacterial growth than Moneymaker-PtoS or susceptible S. neorickii LA1329. Bacterial counts were determined 4 days post-inoculation from S. neorickii LA1329 (n = 14) and Moneymaker-PtoS (n = 10) seedlings infected with Pst19 and normalization was performed to 0.1 g of tissue. For LA1329, the two phenotypic groups, susceptible (SUS) or resistant (RES), were observed and counted separately. Above the bar * = statistically significant difference determined by a one-factor analysis of variance. A general linear model procedure (p < 0.001) followed by a multiple comparison of means using Tukey's post hoc test was used. Error bars = standard error. The figure indicates one representative experiment. Please click here to view a larger version of this figure.
The first paragraph of the Discussion section was updated from:
A protocol for flood inoculation with PstDC3000 or PstT1 optimized to detect resistance to these bacterial strains in tomato seedlings is described. There are several critical parameters for optimal results in the seedling resistance assay, including bacterial concentration and surfactant concentration, which were empirically determined22. For PstDC3000, the optical density was optimized to achieve complete survival on a resistant cultivar containing the Pto/Prf cluster and complete death on a susceptible cultivar lacking the Pto/Prf cluster22. For a strain such as PstT1, where there are no known resistant varieties, the optical density was optimized to be the lowest possible for consistent and complete plant death22. Uppalapati et al.24 designed a tomato seedling assay to investigate the pathogenesis of PstDC3000 and the virulence function of coronatine. In this virulence assay, infections were performed using bacteria concentrated to an OD600 of 0.124, 20x higher than the optical density of strains used in our resistance assay. Recognition of PstDC3000 effectors AvrPto and AvrPtoB in tomato seedlings carrying the Pto/Prf gene cluster results in ETI and a macroscopic HR22. In the context of a strong immune response such as ETI, a lower bacterial titer was used for PstDC3000 to avoid overwhelming genetic resistance from the Pto/Prf gene cluster22. In addition, these results suggest that a high bacterial concentration could overwhelm weaker immune responses such as PTI or quantitative partial resistance, where multiple genes contribute to the overall phenotype. Surfactant is necessary for the bacteria to adhere to the leaf surface; however, high concentrations can cause chlorosis of the leaf22. We previously tested a range of surfactant concentrations to empirically determine the ideal concentration in 10-day-old tomato seedlings22. When testing new species that may differ in their sensitivity to surfactant, the surfactant concentration should be optimized to identify a concentration that does not cause damage or chlorosis in the absence of bacteria. Appropriate assay conditions will require optimization of a surfactant concentration that does not cause damage, and a bacterial concentration that causes disease in all susceptible controls.
to:
A protocol for flood inoculation with PstDC3000 or Pst19 optimized to detect resistance to these bacterial strains in tomato seedlings is described. There are several critical parameters for optimal results in the seedling resistance assay, including bacterial concentration and surfactant concentration, which were empirically determined22. For PstDC3000, the optical density was optimized to achieve complete survival on a resistant cultivar containing the Pto/Prf cluster and complete death on a susceptible cultivar lacking the Pto/Prf cluster22. For a strain such as Pst19, where there are no known resistant varieties, the optical density was optimized to be the lowest possible for consistent and complete plant death22. Uppalapati et al.24 designed a tomato seedling assay to investigate the pathogenesis of PstDC3000 and the virulence function of coronatine. In this virulence assay, infections were performed using bacteria concentrated to an OD600 of 0.124, 20x higher than the optical density of strains used in our resistance assay. Recognition of PstDC3000 effectors AvrPto and AvrPtoB in tomato seedlings carrying the Pto/Prf gene cluster results in ETI and a macroscopic HR22. In the context of a strong immune response such as ETI, a lower bacterial titer was used for PstDC3000 to avoid overwhelming genetic resistance from the Pto/Prf gene cluster22. In addition, these results suggest that a high bacterial concentration could overwhelm weaker immune responses such as PTI or quantitative partial resistance, where multiple genes contribute to the overall phenotype. Surfactant is necessary for the bacteria to adhere to the leaf surface; however, high concentrations can cause chlorosis of the leaf22. We previously tested a range of surfactant concentrations to empirically determine the ideal concentration in 10-day-old tomato seedlings22. When testing new species that may differ in their sensitivity to surfactant, the surfactant concentration should be optimized to identify a concentration that does not cause damage or chlorosis in the absence of bacteria. Appropriate assay conditions will require optimization of a surfactant concentration that does not cause damage, and a bacterial concentration that causes disease in all susceptible controls.
The third paragraph of the Discussion section was updated from:
Pst is a foliar pathogen that preferentially colonizes the aerial parts of tomato seedlings, including the cotyledons24 (Figure 3). Therefore, qualitative phenotyping in the seedling flood assay focuses on growth and disease symptoms in aerial portions of the seedling, and tissue for the bacterial growth assay is sampled from the cotyledons for quantitative analysis. After flood inoculation, seedlings may die within 7–10 days after inoculation with PstDC3000 or 10–14 days after inoculation with PstT1, as discussed in section 11. Seedling death is visualized by a brown apical meristem, arrested epicotyl elongation, and/or arrested vegetative growth. If different bacterial strains are used, the timing will have to be empirically determined. In addition, the progression of disease on control plants should be monitored daily after flooding until a consistent time frame from the onset of disease symptoms to seedling death can be identified. Depending on the genotypes and treatments used in the flood assay, seedling phenotypes can be recorded as binary phenotypes or on a disease spectrum (Figure 4). A broader spectrum of phenotypes may be observed when flood inoculating F2 mapping populations from wild tomato accessions crossed to susceptible cultivars (Figure 4C). It may be best to phenotype segregating populations on a disease spectrum depending on how quickly the seedling dies and the degree of new vegetative growth and branching (Figure 4C). The seedling flood assay can also be used in conjunction with the seedling bacterial growth assay to quantitatively assess levels of bacterial growth associated with qualitative phenotypes in individual seedlings (Figure 7). Very large reductions (i.e., ~log 3) in bacterial growth or strong resistance in resistant seedlings of a wild accession compared to a susceptible cultivar suggest that the underlying genetic basis of resistance may be due to ETI22. Smaller reductions in bacterial growth (i.e., ~log 1.7), as observed in LA1329 seedlings, may be due to the contribution of weaker resistance from quantitative trait loci and/or PTI. Thus, the seedling growth assay can be an important tool in further characterizing resistance in wild tomato lines.
to:
Pst is a foliar pathogen that preferentially colonizes the aerial parts of tomato seedlings, including the cotyledons24 (Figure 3). Therefore, qualitative phenotyping in the seedling flood assay focuses on growth and disease symptoms in aerial portions of the seedling, and tissue for the bacterial growth assay is sampled from the cotyledons for quantitative analysis. After flood inoculation, seedlings may die within 7–10 days after inoculation with PstDC3000 or 10–14 days after inoculation with Pst19, as discussed in section 11. Seedling death is visualized by a brown apical meristem, arrested epicotyl elongation, and/or arrested vegetative growth. If different bacterial strains are used, the timing will have to be empirically determined. In addition, the progression of disease on control plants should be monitored daily after flooding until a consistent time frame from the onset of disease symptoms to seedling death can be identified. Depending on the genotypes and treatments used in the flood assay, seedling phenotypes can be recorded as binary phenotypes or on a disease spectrum (Figure 4). A broader spectrum of phenotypes may be observed when flood inoculating F2 mapping populations from wild tomato accessions crossed to susceptible cultivars (Figure 4C). It may be best to phenotype segregating populations on a disease spectrum depending on how quickly the seedling dies and the degree of new vegetative growth and branching (Figure 4C). The seedling flood assay can also be used in conjunction with the seedling bacterial growth assay to quantitatively assess levels of bacterial growth associated with qualitative phenotypes in individual seedlings (Figure 7). Very large reductions (i.e., ~log 3) in bacterial growth or strong resistance in resistant seedlings of a wild accession compared to a susceptible cultivar suggest that the underlying genetic basis of resistance may be due to ETI22. Smaller reductions in bacterial growth (i.e., ~log 1.7), as observed in LA1329 seedlings, may be due to the contribution of weaker resistance from quantitative trait loci and/or PTI. Thus, the seedling growth assay can be an important tool in further characterizing resistance in wild tomato lines.
The fourth paragraph of the Discussion section was updated from:
Typically, genetic screens have been performed on four- to five-week-old adult tomato plants to identify the genetic basis of P. syringae resistance in wild accessions20,21. Adult tomato plants require much longer growth times, require more space in the growth chamber, and are much larger plants, which means that usually few individuals are screened for each line. The seedling flood assay provides a powerful, alternative approach in the identification of P. syringae resistance in wild tomato accessions. Screening at the seedling stage permits a large sample size to be tested which can be particularly advantageous in detecting resistance in genetically complex populations. Reduced growth chamber space requirements and growth time facilitate a high-throughput approach and rapid detection of natural resistance in wild accessions to emerging pathogens. Furthermore, P. syringae resistance that was identified at the seedling stage in this assay is not restricted to the developmental stage. S. neorickii LA1329 and S. habrochaites LA1253 were initially identified at the seedling stage and also display resistance to PstT1 in adult plants as previously described22.
to:
Typically, genetic screens have been performed on four- to five-week-old adult tomato plants to identify the genetic basis of P. syringae resistance in wild accessions20,21. Adult tomato plants require much longer growth times, require more space in the growth chamber, and are much larger plants, which means that usually few individuals are screened for each line. The seedling flood assay provides a powerful, alternative approach in the identification of P. syringae resistance in wild tomato accessions. Screening at the seedling stage permits a large sample size to be tested which can be particularly advantageous in detecting resistance in genetically complex populations. Reduced growth chamber space requirements and growth time facilitate a high-throughput approach and rapid detection of natural resistance in wild accessions to emerging pathogens. Furthermore, P. syringae resistance that was identified at the seedling stage in this assay is not restricted to the developmental stage. S. neorickii LA1329 and S. habrochaites LA1253 were initially identified at the seedling stage and also display resistance to Pst19 in adult plants as previously described22.
