

ERRATUM NOTICE
Important: There has been an erratum issued for this article. Read more …
Summary
Den planta översvämninganalysen underlättar snabb screening av vilda tomat anslutningar för motståndet mot Pseudomonas syringae bakterie. Denna analys, som används tillsammans med planta bakteriell tillväxt analys, kan bidra till att ytterligare karakterisera den underliggande resistens mot bakterien, och kan användas för att skärmen kartläggning populationer för att bestämma den genetiska grunden för resistens.
Abstract
Tomat är en agronomically viktig gröda som kan infekteras av Pseudomonas syringae, en Gram-negativ bakterie, vilket resulterar i bakteriell fläck sjukdom. Tomat-P. syringae pv. tomat pathosystem används ofta för att dissekera den genetiska grunden för växtmedfödda svar och motståndskraft mot sjukdomar. Medan sjukdomen framgångsrikt förvaltades under många decennier genom införandet av Pto / Prf genkluster från Solanum pimpinellifolium till odlad tomat, ras 1 stammar av P. syringae har utvecklats för att övervinna motstånd som tilldelats av Pto / Prf genkluster och förekommer över hela världen.
Vilda tomatarter är viktiga reservoarer av naturlig mångfald i patogenerkännande, eftersom de utvecklats i olika miljöer med olika patogentryck. I typiska skärmar för sjukdomsresistens i vild tomat används vuxna växter, vilket kan begränsa antalet växter som kan screenas på grund av deras förlängda tillväxttid och större tillväxtutrymmeskrav. Vi utvecklade en metod för att screena 10-dagars gamla tomatplantor för motstånd, vilket minimerar växttillväxt tid och tillväxt kammare utrymme, möjliggör en snabb omsättning av växter, och tillåter stora provstorlekar som ska testas. Planta resultat av överlevnad eller död kan behandlas som diskreta fenotyper eller på en motståndsskala definieras av mängden ny tillväxt i överlevande plantor efter översvämningar. Denna metod har optimerats för att skärmen 10-dagars gamla tomatplantor för motstånd mot två P. syringae stammar och kan enkelt anpassas till andra P. syringae stammar.
Introduction
Pseudomonas syringae är en gramnegativ patogen bakterie som infekterar ett brett spektrum av växtvärdar. Bakterier in i värdväxten genom stomata eller fysiska sår och föröka sig i apoplast1. Växter har utvecklat en tudelad immunsvar för att skydda mot infektion av bakteriella patogener. Den första nivån uppstår på växtcellytan, där mönsterigenkänningsreceptorer på växtcellmembranet uppfattar mycket bevarade patogenassocierade molekylära mönster (PAMPs) i en process som kallas PAMP-utlöst immunitet (PTI)2. Under denna process, värdväxten upregulates försvar svar vägar, inklusive nedfall av callose till cellväggen, stängning av stomata, produktion av reaktiva syrearter, och induktion av patogenes-relaterade gener.
Bakterier kan övervinna PTI genom att använda en typ III utsöndring system för att leverera proteiner, så kallade effektorer, direkt in iväxtcellen 3. Effektorproteiner riktar vanligen in sig på komponenter i PTI och främjar patogenvirulens4. Den andra nivån av växtimmunitet sker inom växtcellen vid erkännande av effektorproteiner. Detta erkännande är beroende av resistensgener, som kodar nukleotidbindningsstället leucin-rik upprepning som innehåller receptorer (NLRs). NLRs kan antingen känna igen effektorer direkt eller erkänna sin verksamhet på ett virulensmål eller lockbete5. De utlöser sedan ett sekundärt immunsvar i en process som kallas effector-utlöst immunitet (ETI), som ofta förknippas med ett överkänsligt svar (HR), en form av lokaliserad celldöd vid infektionsplatsen6. I motsats till gen-för-genresistens i samband med ETI, växter kan uppvisa kvantitativ partiell resistens, som är beroende av bidraget från flera gener7.
P. syringae pv. tomat (Pst) är orsaksmedlet för bakteriell fläck på tomat och är ett ihållande jordbruksproblem. Dominerande stammar på fältet har vanligtvis pst race 0 stammar som uttrycker antingen eller båda av typ III effektorer AvrPto och AvrPtoB. DC3000(PstDC3000) är en representativ ras 0 stam och en modell patogen som kan orsaka bakteriell fläck i tomat. För att bekämpa bakteriell fläck sjukdom, introgressed uppfödare Pto [P. syringae pv. tomat]/ Prf [Pto motstånd och fenthion känslighet] genkluster från vilda tomatarter Solanum pimpinellifolium till moderna sorter8,9. Pto-genen kodar en serin-treoninproteinkinas som tillsammans med Prf NLR ger resistens mot PstDC3000 genom erkännande av effektorerna AvrPto och AvrPtoB10,11,12,13,14. Detta motstånd är dock ineffektivt mot nya ras 1 stammar, vilket möjliggör deras snabba och aggressiva spridning under de senaste åren15,16. Race 1 stammar undgå erkännande av Pto / Prf kluster, eftersom AvrPto antingen är förlorad eller muterad i dessa stammar, och AvrPtoB verkar ackumuleras minimalt15,17,18.
Vilda tomatpopulationer är viktiga reservoarer av naturlig variation för Pst-resistens och har tidigare använts för att identifiera potentiella resistens lokus19,20,21. Nuvarande skärmar för patogenresistens använder dock 4–5 veckor gamla vuxna växter20,21. Därför begränsas de av tillväxttid, tillväxtkammare utrymme, och relativt små urvalsstorlekar. För att ta itu med begränsningarna i konventionella metoder, utvecklade vi en hög genomströmning tomat P. syringae motstånd analys med hjälp av 10-dagars gamla tomat plantor22. Detta tillvägagångssätt erbjuder flera fördelar jämfört med att använda vuxna växter: nämligen kortare tillväxttid, minskade utrymmeskrav och högre genomströmning. Dessutom har vi visat att detta tillvägagångssätt troget rekapitulerar sjukdomsresistens fenotyper observerats i vuxna växter22.
I den planta översvämning analys som beskrivs i detta protokoll, tomat plantor odlas på Petri rätter av sterila Murashige och Skoog (MS) media i 10 dagar och sedan översvämmas med en inoculum som innehåller bakterier av intresse och en ytaktiva. Efter översvämningar kan plantor kvantitativt utvärderas för sjukdomsresistens via bakterielltillväxtanalyser. Dessutom kan planta överlevnad eller död fungera som en diskret resistens eller sjukdom fenotyp 7-14 dagar efter översvämningar. Detta tillvägagångssätt erbjuder ett alternativ med hög genomströmning för screening av ett stort antal vilda tomatanslutningar för motstånd mot Pst race 1-stammar, såsom Pst-stam T1(PstT1), och kan enkelt anpassas till andra bakteriestammar av intresse.
Subscription Required. Please recommend JoVE to your librarian.
Protocol
1. Beredning och användning av biosäkerhetsskåp
- Torka av biosäkerhetsskåpet med 70% etanol.
- Stäng skärp och slå på ultraviolett ljus i biosäkerhetsskåpet i 15 min.
- Efter 15 min, stäng av ultraviolett ljus i biosäkerhetsskåpet. Lyft skärp och slå på fläkten i 15 min.
- Torka bort alla föremål som ska användas i biosäkerhetsskåpet med 70% etanol innan du lägger föremålen i det steriliserade skåpet.
- Rengör handskar eller bara händer med 70% etanol innan du arbetar i biosäkerhetsskåpet.
- Arbeta i centrum av biosäkerhetsskåpet, bort från fläkten.
- Använd oöppnade flaskor autoklavsterila 10 mM MgCl2 och ultraren H2O för experiment. Lägg flaskor i biosäkerhetsskåpet och öppna dem bara i det steriliserade biosäkerhetsskåpet, inte på bänkskivan.
- Använd dedikerade glaspipetter och pipettspetsar för arbete i det steriliserade biosäkerhetsskåpet. Se till att dessa endast öppnas i biosäkerhetsskåpet, aldrig på bänkskivan.
- Efter användning av biosäkerhetsskåpet, autoklav allt avfall (utom blekmedelavfall) och torka av ytan med 70% etanol.
2. Beredning av växtmedier
- Väg ut och lös 0,5 x MS basalsalter i ultraren H2O. Väg ut 0,8% bacto agar och tillsätt sedan upplöst0,5 x MS.
- Autoklav och låt media svalna i 50 °C vattenbad i 1 h före hällning eller pipetting.
- För att säkerställa att plattorna inte är överfyllda, markera polystyren engångssteril100 x 25 mm plattor till en fyllningsnivå på 40 ml. Häll media i 100 x 25 mm sterila plattor i ett steriliserat biosäkerhetsskåp.
3. Beredning av växtmaterial och tillväxtförhållanden
- Placera tomatfrön i ett 2,2 ml mikrocentrifugrör och tillsätt 2,0 ml 50% blekmedellösning.
- Rockröret på en rocker i 25 min.
- Efter 25 min, ta bort fröna från vippen och ta bort blekmedelslösningen med en pipett i det sterila biosäkerhetsskåpet. Se till att allt blekmedel avlägsnas.
- Tillsätt 2 ml sterila ultrapure H2O för att tvätta fröna. Vänd röret 5x.
- Ta bort vätskan från röret med en pipett.
- Upprepa steg 3,3–3,5 för att tvätta fröna 4x mer.
- Tillsätt 2 ml sterilt ultrapure H2O och häll fröna i en tom steril Petriskål.
- Flamkraftnät i etanol och låt svalna innan de överför och jämnt avståndfrön på 100 x 25 mm plattor som innehåller 0,5 x MS + 0,8% agarmedia.
- Överför 5–7 frön i en linje över mitten av en platta och försegla plattornas kanter med kirurgisk tejp (1,25 cm x 9,1 m).
- Stratifiera de steriliserade fröna vid 4 °C i mörker i minst 3 dagar för att synkronisera grobarheten. Se till att plattorna är staplade platt och uppåt, så att fröna inte skiftar på plattan.
- Vertikalt orientera plattorna så att rötterna kommer att växa ner längs ytan av plattan, med raden av frön orienterade horisontellt, när de överförs till tillväxtkammaren.
OBS: Ställ tillväxtkammaren på 22 °C och ge 16 h ljus vid en ljusintensitet på ~200–220 μE meter-2 s-1 och 8 h mörker. - Före översvämningar, växa plantor i 10 dagar i tillväxtkammaren då plantor vanligtvis visar helt uppstått och expanderade cotyledons och framväxande första sanna blad(figur 1).

Figur 1: Utvecklingsstadiet av typiska 10-dagars gamla tomatplantor. Rio Grande-PtoR tomatfrön steriliserades, pläterades och stratifierade i minst 3 dagar i mörkret vid 4 °C. Plantorna odlades på 0,5 x MS plattor i 10 dagar vid 22 °C innan de översvämmades. Vanligtvis, vid 10 dagar cotyledons är helt expanderade, och de första sanna bladen börjar dyka upp. Klicka här för att se en större version av denna siffra.
4. Beredning av Kungens B23 (KB) media
- Fyll bägaren med 500 ml ultraren H2O och rör om på en rörplatta.
- Lös upp 20 g bactopepton, 1,5 g vattenfri K2HPO4och 12,5 ml glycerol i bägare med ultraren H2O.
- Häll den upplösta blandningen i en 1 L graderad cylinder och ta upp till en 1 L slutlig volym med ultrapure H2O.
- Häll buljongen tillbaka i bägaren och rör om tills den blandas.
- Väg ut 7,5 g bacto agar i två 500 ml glasflaskor och tillsätt 500 ml KB buljong från steg 4,4 i varje flaska. Autoklav i 20 min.
- Ta bort flaskorna från autoklaven och snurra försiktigt för att fördela agaren.
- Överför flaskorna till ett 50 °C vattenbad i 1 h.
- Efter 1 h, överför flaskan till biosäkerhetsskåpet och under aseptiska förhållanden, tillsätt 1 600 μL sterilt 1 M MgSO4och lämpliga antibiotika till medierna.
OBS: För spänningsresistenta stammar PstDC3000 och PstT1, använd rifampicin upplöst i dimetylformamid vid en slutlig koncentration på 50 μg/ml. Använd cykloheximid upplöst i etanol vid en slutlig koncentration på 50 μg/ml för att förhindra svamptillväxt på plattorna. - Snurra media försiktigt för att blanda och häll sedan för att täcka botten av plattorna.
- Låt plattorna stelna minst 1 h innan de förvaras upp och ner vid 4 °C.
5. Underhåll av bakteriestammar och kulturförhållanden
- Upprätthålla ett glycerolbestånd från en koloni av bakterier som 1 ml mättad bakteriekultur och 333 μL sterila 80% glycerol vid -80 °C.
- Plåsterbakterier (dvs. PstT1) från ett glycerollager på KB agar med lämpliga antibiotika (avsnitt 4).
- Låt bakterierna återhämta sig i 2 dagar vid 28 °C innan de strimmer nya bakterier på selektiv KB-agar med hjälp av en platt, steril tandpetare.
- Streak färska bakterier från glycerol lager på lämpliga selektiv KB agar med hjälp av en platt, steril tandpetare.
OBS: Se till att det lappade glycerolbeståndet inte är äldre än 2 veckor. - För PstDC3000, inkubera KB plattan vid 28 °C för 24 h innan du använder bakterier i översvämningsexperimentet.
- För PstT1, inkubera KB plattan vid 28 °C för 48 h innan du använder bakterier i översvämningsexperimentet.
6. Beredning av PstT1 inoculum
- Aseptiskt återsuspend bakterierna i sterila 10 mM MgCl2 till en optisk densitet vid 600 nm (OD600) av 0,1, eller cirka 5 x 10⁷ kolonibildande enheter (CFU)/mL).
- Utför seriella utspädningar med steril 10 mM MgCl2-lösning i biosäkerhetsskåpet. För PstT1, använd en spektrofotometer för att göra inokulat med en startkoncentration av OD600 = 0,1.
- För PstT1 ska du göra en 1/10-utspädning från den första återsuspensionen vid OD600 = 0,1 för att erhålla en seriell utspädning vid en koncentration av OD600 = 0,01.
- Med hjälp av den seriella utspädningen vid OD600 = 0,01 från steg 6.3, gör en 3/4 utspädning för att få en slutlig OD600 = 0,0075.
- Gör en 1/10 utspädning av icke-jonisk organosilikonytaktivt sampolymer C13H34O4Si3 (dvs. ytaktivt) i 10 mM MgCl2 och virvel för 15 s. Tillsätt 1/10 lager ytaktiva till den sista seriella utspädningen (OD600 = 0,0075) till en slutlig koncentration på 0,015% och virvla väl blanda.
7. Beredning av PstDC3000 inokulat
- Aseptiskt återsuspendera bakterier i sterila 10 mM MgCl2 till en optisk densitet vid 600 nm (OD600) av 0,1 (ca 5 x 10⁷ CFU/ml).
- Utför seriella utspädningar med steril 10 mM MgCl2-lösning i biosäkerhetsskåpet. För PstDC3000, använd en spektrofotometer för att göra inokulat med en startkoncentration på OD600 = 0,1.
- För PstDC3000, gör en 1/10 utspädning från den första återsuspensionen vid OD600 = 0,1 för att erhålla en seriell utspädning vid en koncentration av OD600 = 0,01.
- Med hjälp av den seriella utspädningen vid OD600 = 0,01 från steg 3, gör en 1/2 utspädning för att få en slutlig OD600 = 0,005.
- Gör en 1/10 utspädning av ytaktiva ämnen i 10 mM MgCl2 och virvel för 15 s. Tillsätt 1/10 lager ytaktiva till den sista seriella utspädningen (OD600 = 0,005) till en slutlig koncentration på 0,015% och virvla väl att blanda.
8. Tomat planta översvämning metod
- Ta plattorna med de 10 dagar gamla plantorna ut ur tillväxtkammaren och sätt i biosäkerhetsskåpet för att förbereda plattorna för översvämningar.
- Ta bort det kirurgiska bandet från två plattor.
- Ställ in en timer för 3 min. Åtgärd 6 ml slutlig inoculum(PstT1 OD600 = 0,0075 [avsnitt 6] eller PstDC3000 OD600 = 0,005 [avsnitt 7]) och överför 6 ml inokulat till varje platta med de 10 dagar gamla plantorna.
- Tryck försiktigt ner plantorna i inokulatmed en steril pipettspets. Starta timern.
- Håll en platta i varje hand. Luta framsidan av plattan ner för att ackumulera inoculum och främst doppa cotyledons och blad av plantorna.
- Swish sida till sida 5–7x och tippa sedan tillbaka plattorna för att täcka rötterna och hela plattan.
- Luta plattorna igen för att dränka cotyledons och blad, och upprepa i totalt 3 min.
- Häll inokulat av plattorna, ställ plattorna ner på en plan yta och häll sedan av eventuella kvarvarande inokulat en andra gång.
- Packa om plattorna med kirurgisk tejp och upprepa steg 8.2–8.8 för eventuella återstående plattor.
- Återruvade plattorna i tillväxtkammaren (se steg 3.11 OBS) efter att alla plattor har översvämmats.
- Fenotyp efter 7–10 dagar för PstDC3000 eller 10–14 dagar för PstT1 (avsnitt 11). Om du utför bakterielltillväxtanalyser, samla bladvävnad efter 4 dagar (avsnitten 9 och 10) och sedan fenotyp (avsnitt 11). Alternativt utföra fenotypisk analys och bakteriell tillväxt analyser på separata uppsättningar av växter.
9. Ytsterilisering av cotyledons för bakteriell tillväxt analys
- Fyra dagar efter översvämningar och åter inkubatora plantorna i tillväxtkammaren (avsnitt 8), ta bort plattorna med tomatplantorna från tillväxtkammaren.
- Numrera de enskilda plantorna på plattans nedre utsida där plantan fäster på plattan för varje genotyp.
- Etikettsterila 1,5 ml mikrocentrifugrör med de individuella plantanumren och använd rena pinps för att släppa en 3 mm steril borosilikatpilikatp i varje rör för användning med en pärlvisp. (Se OBS i steg 10.1.)
- Pipette 200 μL på 10 mM MgCl2 i varje rör och nära rör.
- Förbered 70% etanol och häll 100 ml i en ren bägare. Häll 100 ml sterilt ultrapure H2O i en separat, ren bägare.
- Rengör rostfria raka finpunktspinpar med tandade spetsar med etanol. Öppna plattan något för att tillåta aseptisk borttagning av en cotyledon med rena pinps.
- Nyp fast petiolen vid basen av cotyledon för att ta bort ett blad och släpp in i bägaren med 70% etanol för att ytsterilisera i 10 s. Skölj cotyledon i ultraren H2O för 10 s.
- Placera cotyledon på en pappershandduk och blot torr med känsliga vetenskapliga våtservetter.
- Individuellt väga varje cotyledon efter ytan sterilisering och blotting, och registrera vikten.
- Placera cotyledon i ett tidigare berett 1,5 ml mikrocentrifugrör (från steg 9.3 och 9.4) märkt med motsvarande genotyp och individuellt nummer.
- Förtäta plattorna med steril tejp och inkubera plantorna i tillväxtkammaren igen (se steg 3.11 OBS).
10. Bakteriell tillväxt analys
- Använd prover från steg 9.10, homogenisera vävnaden med hjälp av pärlvisian i 10 mM MgCl2 i 1–2 min. Om vävnaden inte är tillräckligt macerated, homogenisera igen.
OBS: Många tillverkare producerar pärlor visar homogenisatorer. Antal och typ av pärlor, liksom homogeniseringstid och hastighet (om programmerbar) bör optimeras för varje typ av homogenisator. Se till att proverna inte överhettas under homogenisering. - Tillsätt 800 μL på 10 mM MgCl2 till varje rör som innehåller macerated vävnad från steg 10.1 och vänd flera gånger för att blanda.
- Förbered seriella utspädningar för varje prov i 10 mM MgCl2 i 96 brunnsplatta (100,10-1,10-2, 10-3, 10-4, 10-5) med hjälp av en flerkanalig pipett (figur 2A).
- Pipett5 μL från varje utspädningsserie med en flerkanalig pipett på en KB agarplatta (150 mm x 15 mm) med cykloheximid och lämpligt val för bakteriestammen av intresse (se steg 4.8 OBS). Låt plattorna torka helt.
- Inkubera plattan upp och ner vid 28 °C i 36 timmar, visualisera sedan (figur 2B) kolonierna på plattorna med hjälp av ett dissekerande mikroskop för att avgöra om kolonierna är tillräckligt stora för att räkna.
OBS: Om kolonierna inte är tillräckligt stora, inkubera plattorna igen och kontrollera koloniernas storlek med några timmars mellanrum. Vanligtvis kolonierna är räknebara ~ 36-48 h efter inkubation.

Figur 2: Seriella utspädningar för plantning av bakterietillväxtanalyser. (A)Macerated bladvävnad från infekterade växter späds före koloniräkning. Utspädningar utförs i en 96 brunnsplatta (100 är outspädd). Typiskt, utspädningar är gjorda av 10-1 till 10-5. (B)Pläteringsutspädningar för bakteriekoloniantal. Totalt 5 μL i varje kolonn i utspädningsserien är pläterad, från de flesta späda till mest koncentrerade. När kolonierna har torkat helt, är plattan ruvad vid 28 °C för 36-48 h. Kolonier räknas under en 10x dissekera mikroskop. Klicka här för att se en större version av denna siffra.
- Räkna kolonierna under ett dissekeringmikroskop innan de går samman (figur 2B). Räkna kolonierna från utspädningsserieplattorna med färre än 100 kolonier.
- Efter att ha erhållit koloniräknas (figur 2B),normalisera antalet till 0,01 g vävnad för plantor och konvertera till log bakterietillväxt (Tabell 1).
OBS: Den genomsnittliga massan av en Moneymaker-PtoS cotyledon är 0,01 g och är empiriskt bestäms22.
| Genotyp1 Kolumn A | Vävnadsvikt (g) Kolumn B | Kolonier på en plats Kolumn C | Utspädningsfaktor för punkt2 Kolumn D | Justerat antal kolonier3 kolumn E | Utspädningsfaktor för serieutspädning Kolumn F | Totalt antal kolonier Kolumn G (cfu/0,01 g)4 | Genomsnittlig tavla för kolonier (cfu/0,01 g) Kolumn H | Genomsnittlig logtillväxt (cfu/0,01 g (logg10))Kolumn I |
| Prov 1 | 0,004 g | 10 | 200 | beräknas som: (C2 x 0,01 g) / B2 = 25 | 1000 | beräknas som: (D2 x E2 x F2) = 5000000 | genomsnitt för prov 1 till och med sista provet: (dvs. genomsnitt G1:G3) = 7000000 | logg av genomsnittliga dvs. logg(H2) = 6,85 |
| Prov 2 | 0,003 g | 15 | 200 | 50 | 1000 | 10000000 | ||
| Exempel 3 | 0.002 g | 6 | 200 | 30 | 1000 | 6000000 | ||
| 1 (på) Data som visas för 3 prover | ||||||||
| 2 (2) Baserat på plätering 5 μL x 200 för 1 ml | ||||||||
| 3( 3) Cotyledons är för små för att kärna så koloni räknas normaliserades till 0,01 g vävnad baserat på den genomsnittliga massan av en MoneyMaker-PtoS cotyledon (data visas inte) | ||||||||
| 4 (på) Justerat per ml baserat på volympläterade | ||||||||
Tabell 1: Exempelberäkningar för plantning av bakterietillväxtanalys. Exempelberäkningar visar hur man normaliserar antalet bakterier och bestämmer log bakterietillväxt.
- För vilda anslutningar och andra linjer med komplex genetisk bakgrund, korrelera nivån av bakteriell tillväxt i enskilda plantor med sin fenotyp som beskrivs i avsnitt 11.
11. Fenotypning för motstånd
- Ta bort plattorna från tillväxtkammaren och fenotyp enskilda plantor för döden (på grund av sjukdom) eller överlevnad (på grund av resistens) efter 7-14 dagar.
- Fenotyp växter infekterade med en mycket virulent stam som PstDC3000 tidigare, på 7-10 dagar efter översvämning inokulering.
- Fenotyp växter infekterade med PstT1 på 10-14 dagar efter översvämning inokulering.
- Bestäm ett poängsystem baserat på intervallet för resistans fenotyper som observerats. Spela in binära fenotyper för sorter, isoentalinjer och vilda anslutningar med konsekventa, starka till mellanliggande motståndfenotyper (figur 4A, 4B).
- Om plantan visar ny tillväxt från den apikala meristem inom tidsramen för fenotypning, räkna det som en överlevnad. Om plantan har en brun apikal meristem och visar ingen ny, grön vegetativ tillväxt, räkna det som en död (figur 3).

Figur 3: Schematisk representation av en tomatplanta. Olika delar av en tomatplanta avbildas, inklusive hypokotyl, cotyledons, epicotyl, skjuta apical meristem och sanna blad. Klicka här för att se en större version av denna siffra.
- Spela in fenotyper på ett sjukdomsspektrum för populationer, såsom F2-kartpopulationer, med ett brett spektrum av resistensfenotyper (figur 4C).
- Övervaka noggrant plantorna för uppkomsten av sjukdomssymtom och död för att identifiera lämpligt fönster för fenotypning.

Figur 4: Schematisk representation av förväntade fenotyper för plantning sresistans och död i olika genetiska bakgrunder. (A)Plantor i Rio Grande-PtoR och den nästan isoenta kultisten Rio Grande-PtoS visas 7 dagar efter översvämningar med PstDC3000 (OD600 = 0,005) + 0,015% ytaktivt ämne. Rio Grande-PtoR visar konsekvent motstånd, och RioGrande-PtoS visar konsekvent känslighet för infektion med PstDC3000. Dessa linjer ger upphov till diskreta och binära fenotyper. (B)Plantor för en vild anslutning, såsom Solanum neorickii LA1329, visas 10 dagar efter översvämningar med PstT1 (OD600 = 0,0075) + 0,015% ytaktivt ämne. Plantor visar fenotypiska variationer men spelades in som binära fenotyper. Mängden fenotypisk variabilitet och metoden för fenotypning (binärresistens eller motståndspektrum) beror på den särskilda anslutningen testas. (C)Kartläggning av populationer som genereras av överkorsningar av vilda anslutningar till mottagliga sorter kan visa upp ett bredare spektrum av fenotyper i F2 segregerande populationer. I det här fallet kan det vara lämpligast att spela in planta fenotyper på ett spektrum. Mycket mottagliga plantor från en kartläggning population kan fenotypas för döden så tidigt som dag 7 när översvämmas med PstT1, och vanligtvis visar en brun apikal meristem, ingen till mycket liten förlängning av epicotyl, och ingen ny, grön vegetativ tillväxt. Den apikala meristem av mottagliga plantor kan stanna grönt eller mycket ljusbrunt för mer tid, och det kan finnas en viss förlängning av epicotyl och mycket lite vegetativ tillväxt, som blir brun och gripanden av dag 10. Enskilda plantor kan fenotypas för resistens baserat på mängden nya och pågående vegetativ tillväxt av dag 14. Plantor kan sedan grupperas baserat på fenotyper som beskrivs ovan i olika kategorier av motstånd såsom svag, medium eller starkt motstånd. Klicka här för att se en större version av denna siffra.
Subscription Required. Please recommend JoVE to your librarian.
Representative Results
Upptäckt av PtoR-medieradimmunitet i sorter och isogena linjer med hjälp av plantmotståndsanalysen
Figur 5 visar representativa resultat förMoneymaker- PtoR och Moneymaker-PtoS sorter 7-10 dagar efter översvämningar med PstDC3000. Före infektion, 10-dagars gamla plantor visas helt uppstått och expanderade cotyledons och framväxande första sanna blad. Plantorna översvämmades med 10 mM MgCl2 + 0,015% ytaktiva som en negativ kontroll (data visas inte) och PstDC3000 vid en optisk densitet på 0,005 + 0,015% ytaktiva ämnen. Plantorna var fenotypade 7–10 dagar efter översvämningarna (figur 5). Enskilda plantor från genotypiskt homogena linjer, såsom Moneymaker-PtoR och Moneymaker-PtoS ger mycket konsekvent och binära fenotyper i planta översvämning analysen. När Moneymaker-PtoR, som bär Pto/Prf genkluster (n = 5), behandlades med PstDC3000 vid optimal koncentration av OD600 = 0,005, motstånd på grund av PtoR-medieradimmunitet var stark och kännetecknades av nya, grön vegetativ tillväxt hos alla individer22. Nästan isogenic Moneymaker-PtoS plantor (n = 5), som inte kan känna igen PstDC3000 effektorer AvrPto eller AvrPtoB, dog snabbt inom 7 dagar efter översvämningar och karakteristiskt hade bruna apikala meristems, bakteriell fläck, kloros, och inga tecken på nya, grön vegetativ tillväxt(figur 5).

Figur 5: Fenotypisk karakterisering av resistens eller sjukdomssymtom 7–10 dagar efter infektion en sort. Moneymaker-PtoR och Moneymaker-PtoS tomatplantor odlades på 0.5x MS plattor i 10 dagar innan de översvämmas med P. syringae pv. Tomat DC3000 (OD600 = 0,005) + 0,015% ytaktivt ämne. Moneymaker-PtoR plantor överlevde (n = 5) och Moneymaker-PtoS plantor (n = 5) dog. Antalet överlevande plantor för varje genotyp av det totala antalet testade visas. Skala bar = 1 cm. Klicka här för att se en större version av denna siffra.
Fenotypisk screening av vilda anslutningar med hjälp av plantan motstånd analysen
Figur 6 visar representativa resultat för plantor av mottagliga och resistenta anslutningar 10–14 dagar efter översvämningar med PstT1. Mottagliga anslutningar inkluderar RG-PtoR, S. pimpinellifolium LA1375, och S. pimpinellifolium LA1606, och resistenta anslutningar inkluderar S. neorickii LA1329. Tio dagar gamla plantor översvämmades med 10 mM MgCl2 + 0,015% ytaktiva som en negativ kontroll, och PstT1 vid en optisk densitet på 0,0075 + 0,015% ytaktiva. Plantorna var fenotypade minst 10 dagar efter översvämningar, som PstT1-infekterade plantor dog långsammare än PstDC3000-infekterade plantor. Mock-inoculated plantor var gröna, friska och aktivt växande. Denna kontroll är viktig för att se till att anslutningarna inte är känsliga för koncentrationen av ytaktiva ämnen och för att säkerställa att det inte förekommer någon bakteriell kontaminering. Mottagliga anslutningar (Rio Grande-PtoR [n = 7], S. pimpinellifolium LA1375 [n = 7], och S. pimpinellifolium LA1606 [n = 5]) var döda, hade bruna apikala meristems och saknade ny tillväxt 10–14 dagar efter inokulering med PstT1. Däremot visade två S. neorickii LA1329 (n = 3) plantor en hög nivå av ny, grön tillväxt och överlevde infektion med PstT1 (figur 6). Tre LA1329 plantor inte gro. Vanligtvis var 5-7 individer screenas för varje anslutning i en primär skärm för att avgöra förekomsten av resistens i befolkningen. När en mer genetiskt komplex vild anslutning, såsom LA1329, är översvämmad med PstT1, motståndet fenotyper visar något mer variation bland enskilda plantor, jämfört med Moneymaker-PtoR behandlas med PstDC3000. Emellertid, motståndet fenotyper var oftast mindre varierande än de som ses i F2 kartläggning populationer. Således, binära fenotypning kriterier användes för LA1329.

Figur 6: Fenotypisk karakterisering av resistens eller sjukdomssymtom 10–14 dagar efter infektion i vilda anslutningar. Rio Grande-PtoR, S. pimpinellifolium LA1606, S. pimpinellifolium LA1375 och S. neorickii LA1329 tomatplantor odlades på 0,5 x MS plattor i 10 dagar, och sedan översvämmade med PstT1 (OD600 = 0,0075) + 0,015% ytaktiva. Antalet efterlevande plantor för varje vild anslutning av det totala antalet testade visas. Skala bar = 1 cm. Klicka här för att se en större version av denna siffra.
Kvantitativ bedömning av bakterietillväxt med hjälp av plantan översvämningsanalys
För att bekräfta att det observerade motståndet i LA1329 till PstT1 resulterade i lägre bakterietillväxt, utfördes bakterielltillväxtanalyser i tomatplantor. Nivån på PstT1 tillväxt i Moneymaker-PtoS och S. neorickii LA1329 fastställdes 4 dagar efter infektion. Moneymaker-PtoS är en nästan isogen linje med konsekvent mottaglighet bland enskilda plantor. Vilda anslutningar som S. neorickii LA1329 är ofta mer genetiskt komplexa. LA1329 visar cirka 60% motstånd mot PstT1 över befolkningen22. Eftersom plantor kan släppa sina cotyledons efter infektion, en planta odlades på varje platta för att korrelera bakterietillväxt i skördade cotyledon med övergripande planta överlevnad eller död som bestäms fenotypiskt minst 10 dagar efter översvämningar. Bakterien räknas på dag 4 för varje planta normaliserades till 0,01 g vävnad och omvandlas till stock tillväxt (CFU/0,01 g (log10)). Log tillväxt för fenotypiskt resistenta LA1329 plantor (LA1329RES) eller fenotypiska mottagliga plantor (LA1329SUS) var separat poolade och jämfört med varandra och mottagliga cultivar Moneymaker-PtoS . Till exempel fanns det en 1,7 stock skillnad i bakterietillväxt mellan LA1329RES (log 6,3) och LA1329SUS (log 8.0), och en 1,6 logg skillnad mellan LA1329RES (log 6,3) och Moneymaker-PtoS (log 7,9)(bild 7). Därför är fenotypisk resistens korrelerad med kvantitativ resistens i plantornas analyser.

Figur 7: Resistenta Solanum neorickii LA1329 plantor stöder lägre bakterietillväxt än Moneymaker-PtoS eller mottagliga S. neorickii LA1329. Bakteriella antal fastställdes 4 dagar efter inokulering från S. neorickii LA1329 (n = 14) och Moneymaker-PtoS (n = 10) plantor infekterade med PstT1 och normalisering utfördes till 0,01 g vävnad. För LA1329 observerades och räknades de två fenotypiska grupperna, mottagliga (SUS) eller resistenta (RES), separat. Ovanför stapeln * = statistiskt signifikant skillnad bestäms av en enfaktorsanalys av variansen. En allmän linjär modell procedur (p < 0,001) följt av en multipel jämförelse av medel med Tukey post hoc-test användes. Felstaplar = standardfel. Figuren anger ett representativt experiment. Klicka här för att se en större version av denna siffra.
Subscription Required. Please recommend JoVE to your librarian.
Discussion
Ett protokoll för översvämningsinokulering med PstDC3000 eller PstT1 optimerat för att upptäcka resistens mot dessa bakteriestammar i tomatplantor beskrivs. Det finns flera kritiska parametrar för optimala resultat i plantan resistens analys, inklusive bakteriell koncentration och ytaktiva koncentration, som var empiriskt bestäms22. För PstDC3000 optimerades den optiska densiteten för att uppnå fullständig överlevnad på en resistent sort som innehåller Pto/Prf-klustret och fullständig död på en mottaglig sort som saknar Pto/Prf-klustret 22. För en stam som PstT1, där det inte finns några kända resistenta sorter, optimerades den optiska densiteten för att vara lägsta möjliga för konsekvent och fullständig växtdöd22. Uppalapati et al.24 utformade en tomatplantaanalys för att undersöka patogenesen vid PstDC3000 och den virulence funktionen av coronatine. I denna virulensanalys utfördes infektioner med hjälp av bakterier koncentrerade till en OD600 av 0,124, 20x högre än den optiska densiteten av stammar som används i vår resistens analys. Erkännande av PstDC3000 effektorer AvrPto och AvrPtoB i tomat plantor bär Pto / Prf genklustret resulterar i ETI och en makroskopiska HR22. I samband med ett starkt immunsvar såsom ETI, en lägre bakteriell titer användes för PstDC3000 för att undvika överväldigande genetisk resistens från Pto / Prf genkluster22. Dessutom, dessa resultat tyder på att en hög bakteriell koncentration kan överväldiga svagare immunsvar såsom PTI eller kvantitativ partiell resistens, där flera gener bidrar till den totala fenotyp. Ytaktivt ämne är nödvändigt för bakterierna att hålla sig till bladytan; dock kan höga koncentrationer orsaka kloros i bladet22. Vi har tidigare testat en rad ytaktiva koncentrationer för att empiriskt bestämma den idealiska koncentrationen i 10-dagars gamla tomatplantor22. Vid testning av nya arter som kan skilja sig åt deras känslighet för ytaktivt ämne, bör ytaktiva koncentrationen optimeras för att identifiera en koncentration som inte orsakar skador eller kloros i avsaknad av bakterier. Lämpliga analysvillkor kräver optimering av en ytaktiva koncentration som inte orsakar skada, och en bakteriekoncentration som orsakar sjukdom i alla mottagliga kontroller.
Ytterligare kritiska parametrar för framgång i plantan översvämningsanalys inkluderar att använda plantor i specifika utvecklingsstadier (10-dagars gamla plantor) (figur 1),upprätthålla stabil tillväxt kammare villkor (ljusintensitet på ca 200 μE m-2 s-1, konstant temperatur på 22 °C, 16 h av ljus) och utför experiment i en steril biosäkerhet skåp. Medievolym över 45 ml eller under 35 ml kan påverka konsekvent död av mottagliga kontroller, eftersom volymen kan påverka den omgivande mikromiljön i plantorna på plattan. Till exempel kan skillnader i relativ luftfuktighet inuti de förseglade plattorna påverka bakteriernas smittsamhet och växternas förmåga att överleva infektion. Steril teknik är kritisk, eftersom kontaminering på plattorna kan förvirra källan till död eller mottaglighet i plantor. Dessutom, eftersom växt-patogen interaktioner påverkas av dygnsrytmen klockan24,25,26, rekommenderas att växterna smittas vid en konsekvent tid på dagen.
Pst är en bladpatogen som företrädesvis koloniserar antenndelarna av tomatplantor, inklusive cotyledons24 (figur 3). Därför fokuserar kvalitativ fenotypning i plantan översvämningsanalys på tillväxt och sjukdom symtom i luften delar av plantan, och vävnad för bakteriell tillväxt analysen tas från cotyledons för kvantitativ analys. Efter översvämningsinokulering kan plantorna dö inom 7–10 dagar efter inokulering med PstDC3000 eller 10–14 dagar efter inokulering med PstT1, som diskuteras i avsnitt 11. Planta död visualiseras av en brun apikal meristem, arresterade epicotyl förlängning, och / eller arresterade vegetativ tillväxt. Om olika bakteriestammar används måste tidpunkten vara empiriskt bestämd. Dessutom bör sjukdomsprogressionen på kontrollväxter övervakas dagligen efter översvämningar tills en konsekvent tidsram från sjukdomssymtomens början till plantning kan identifieras. Beroende på genotyper och behandlingar som används i översvämningsanalysen kan planta fenotyper registreras som binära fenotyper eller på ett sjukdomsspektrum (figur 4). Ett bredare spektrum av fenotyper kan observeras vid översvämning inokulering F2 kartläggning populationer från vilda tomat anslutningar korsade till mottagliga sorter(figur 4C). Det kan vara bäst att fenotyp segregerande populationer på en sjukdom spektrum beroende på hur snabbt plantan dör och graden av nya vegetativ tillväxt och förgrening(figur 4C). Den planta översvämninganalysen kan också användas tillsammans med planta bakteriell tillväxt analys för att kvantitativt bedöma nivåer av bakteriell tillväxt i samband med kvalitativa fenotyper i enskilda plantor (figur 7). Mycket stora minskningar (dvs. ~ log 3) i bakterietillväxt eller starkt motstånd i resistenta plantor av en vild anslutning jämfört med en mottaglig sort tyder på att den underliggande genetiska grunden för resistens kan bero på ETI22. Mindre minskningar av bakterietillväxten (dvs. ~log 1.7), som observerats i LA1329 plantor, kan bero på att svagare resistens från kvantitativa dragloci och/eller PTI bidrar. Således kan planta tillväxt analys vara ett viktigt verktyg för att ytterligare karakterisera motstånd i vilda tomat linjer.
Typiskt, genetiska skärmar har utförts på fyra till fem veckor gamla vuxna tomatplantor för att identifiera den genetiska grunden för P. syringae resistens i vilda anslutningar20,21. Vuxna tomatplantor kräver mycket längre tillväxttider, kräver mer utrymme i tillväxtkammaren, och är mycket större växter, vilket innebär att vanligtvis få individer screenas för varje linje. Den planta översvämning analysen ger en kraftfull, alternativ strategi för att identifiera P. syringae motstånd i vilda tomat anslutningar. Screening i plantstadiet gör det möjligt att testa en stor urvalsstorlek som kan vara särskilt fördelaktig för att upptäcka resistens hos genetiskt komplexa populationer. Minskad tillväxt kammare utrymme krav och tillväxt tid underlätta en hög genomströmning strategi och snabb upptäckt av naturligt motstånd i vilda anslutningar till nya patogener. Dessutom är P. syringae motstånd som identifierades i plantstadiet i denna analys inte begränsad till utvecklingsstadiet. S. neorickii LA1329 och S. habrochaites LA1253 identifierades ursprungligen vid plantstadiet och även visa motstånd mot PstT1 i vuxna växter som tidigare beskrivits22.
Den planta översvämning analys är ett mångsidigt protokoll som kan ändras och optimeras för att upptäcka värd motstånd mot andra P. syringae stammar. Det skulle kunna tillämpas ytterligare i samband med olika bakteriella patogener av tomat, såsom Xanthomonas arter. Denna metod kommer att påskynda sökandet efter nya källor till sjukdomsresistens mot bakteriella patogener.
Subscription Required. Please recommend JoVE to your librarian.
Disclosures
Författarna har inget att avslöja.
Acknowledgments
Vi tackar Jamie Calma för att testa effekten av medievolym på sjukdom eller resistens resultat. Vi tackar Dr Maël Baudin och Dr Karl J. Scheiber från Lewis Lab för att ge konstruktiva kommentarer och förslag på manuskriptet. Forskning om växtimmunitet i Lewis laboratoriet stöddes av USDA ARS 2030-21000-046-00D och 2030-21000-050-00D (JDL), och NSF Direktoratet för biologiska vetenskaper IOS-1557661 (JDL).
Materials
| Name | Company | Catalog Number | Comments |
| 3M Tape Micropore 1/2" x 10 YD CS 240 (1.25 cm x 9.1 m) | VWR International | 56222-182 | |
| 3mm borosilicate glass beads | Friedrich & Dimmock | GB3000B | |
| Bacto peptone | BD | 211677 | |
| Bacto agar | BD | 214010 | |
| Biophotometer Plus | Eppendorf | E952000006 | |
| Biosafety cabinet, class II type A2 | |||
| BRAND Disposable Plastic Cuvettes, Polystyrene | VWR International | 47744-642 | |
| Chenille Kraft Flat Wood Toothpicks | VWR International | 500029-808 | |
| cycloheximide | Research Products International | C81040-5.0 | |
| Dibasic potassium phosphate anhydrous, ACS grade | Fisher Scientific | P288-500 | |
| Dimethylformamide | |||
| Dissecting microscope (Magnification of at least 10x) | |||
| Ethanol - 190 Proof | |||
| Falcon polystyrene 96 well microplates, flat-bottom | Fisher Scientific | 08-772-3 | |
| Glass Alcohol Burner Wick | Fisher Scientific | S41898A / No. W-125 | |
| Glass Alcohol Burners | Fisher Scientific | S41898 / No. BO125 | |
| Glycerol ACS reagent | VWR International | EMGX0185-5 | |
| Kimberly-Clark™ Kimtech Science™ Kimwipes™ Delicate Task Wipers | Fisher Scientific | 06-666-A | |
| Magnesium chloride, ACS grade | VWR International | 97061-356 | |
| Magnesium sulfate heptahydrate, ACS grade | VWR International | 97062-130 | |
| Microcentrifuge tubes, 1.5 mL | |||
| Microcentrifuge tubes, 2.2 mL | |||
| Mini Beadbeater-96, 115 volt | Bio Spec Products Inc. | 1001 | |
| Murashige & Skoog, Basal Salts | Caisson Laboratories, Inc. | MSP01-50LT | |
| Pipet-Lite XLS LTS 8-CH Pipet 20-200uL | Rainin | L8-200XLS | |
| Pipet-Lite XLS LTS 8-CH Pipet 2-20uL | Rainin | L8-20XLS | |
| Polystyrene 100mm x 25mm sterile petri dish | VWR International | 89107-632 | |
| Polystyrene 150mm x 15mm sterile petri dish | Fisher Scientific | FB08-757-14 | |
| Polystyrene 150x15mm sterile petri dish | Fisher Scientific | 08-757-148 | |
| Pure Bright Germicidal Ultra Bleach 5.7% Available Chlorine (defined as 100% bleach) | Staples | 1013131 | |
| Rifampicin | Gold Biotechnology | R-120-25 | |
| Silwet L-77 (non-ionic organosilicone surfactant co-polymer C13H34O4Si3 surfactant) | Fisher Scientific | NCO138454 | |
| Tips LTS 20 μL 960/10 GPS-L10 | Rainin | 17005091 | |
| Tips LTS 250 μL 960/10 GPS-L250 | Rainin | 17005093 | |
| VWR dissecting forceps fine tip, 4.5" | VWR International | 82027-386 |
References
- Underwood, W., Melotto, M., He, S. Y. Role of plant stomata in bacterial invasion. Cell Microbiology. 9 (7), 1621-1629 (2007).
- Zipfel, C. Early molecular events in PAMP-triggered immunity. Current Opinion in Plant Biology. 12 (4), 414-420 (2009).
- Galan, J. E., Wolf-Watz, H. Protein delivery into eukaryotic cells by type III secretion machines. Nature. 444 (7119), 567-573 (2006).
- Lewis, J. D., Desveaux, D., Guttman, D. S. The targeting of plant cellular systems by injected type III effector proteins. Seminars in Cell and Developmental Biology. 20 (9), 1055-1063 (2009).
- Schreiber, K. J., Baudin, M., Hassan, J. A., Lewis, J. D. Die another day: molecular mechanisms of effector-triggered immunity elicited by type III secreted effector proteins. Seminars in Cell and Developmental Biology. 56, 124-133 (2016).
- Heath, M. C. Hypersensitive response-related death. Plant Molecular Biology. 44 (3), 321-334 (2000).
- Boyd, L. A., Ridout, C., O'Sullivan, D. M., Leach, J. E., Leung, H. Plant-pathogen interactions: disease resistance in modern agriculture. Trends in Genetics. 29 (4), 233-240 (2013).
- Pitblado, R. E., MacNeill, B. H. Genetic basis of resistance to Pseudomonas syringae pv. tomato in field tomatoes. Canadian Journal of Plant Pathology. 5 (4), 251-255 (1983).
- Pedley, K. F., Martin, G. B. Molecular basis of Pto-mediated resistance to bacterial speck disease in tomato. Annual Reviews of Phytopathology. 41, 215-243 (2003).
- Ronald, P. C., Salmeron, J. M., Carland, F. M., Mehta, A. Y., Staskawicz, B. J. The cloned avirulence gene AvrPto induces disease resistance in tomato cultivars containing the Pto resistance gene. Journal of Bacteriology. 174 (5), 1604-1611 (1992).
- Martin, G. B., et al. Map-based cloning of a protein kinase gene conferring disease resistance in tomato. Science. 262 (5138), 1432-1436 (1993).
- Salmeron, J. M., Barker, S. J., Carland, F. M., Mehta, A. Y., Staskawicz, B. J. Tomato mutants altered in bacterial disease resistance provide evidence for a new locus controlling pathogen recognition. Plant Cell. 6 (4), 511-520 (1994).
- Salmeron, J. M., et al. Tomato Prf is a member of the leucine-rich repeat class of plant disease resistance genes and lies embedded within the Pto kinase gene cluster. Cell. 86 (1), 123-133 (1996).
- Scofield, S. R., et al. Molecular basis of gene-for-gene specificity in bacterial speck disease of tomato. Science. 274 (5295), 2063-2065 (1996).
- Kunkeaw, S., Tan, S., Coaker, G. Molecular and evolutionary analyses of Pseudomonas syringae pv. tomato race 1. Molecular Plant-Microbe Interactions. 23 (4), 415-424 (2010).
- Cai, R., et al. The plant pathogen Pseudomonas syringae pv. tomato is genetically monomorphic and under strong selection to evade tomato immunity. PLoS Pathogens. 7 (8), 1002130 (2011).
- Almeida, N. F., et al. A draft genome sequence of Pseudomonas syringae pv. tomato T1 reveals a type III effector repertoire significantly divergent from that of Pseudomonas syringae pv. tomato DC3000. Molecular Plant-Microbe Interactions. 22 (1), 52-62 (2009).
- Lin, N. C., Abramovitch, R. B., Kim, Y. J., Martin, G. B. Diverse AvrPtoB homologs from several Pseudomonas syringae pathovars elicit Pto-dependent resistance and have similar virulence activities. Applied and Environmental Microbiology. 72 (1), 702-712 (2006).
- Rose, L. E., Langley, C. H., Bernal, A. J., Michelmore, R. W. Natural variation in the Pto pathogen resistance gene within species of wild tomato (Lycopersicon). I. Functional analysis of Pto alleles. Genetics. 171 (1), 345-357 (2005).
- Thapa, S. P., Miyao, E. M., Davis, R. M., Coaker, G. Identification of QTLs controlling resistance to Pseudomonas syringae pv. tomato race 1 strains from the wild tomato Solanum habrochaites LA1777. Theoretical and Applied Genetics. 128 (4), 681-692 (2015).
- Bao, Z. L., et al. Identification of a candidate gene in Solanum habrochaites for resistance to a race 1 strain of Pseudomonas syringae pv. tomato. Plant Genome. 8 (3), 1-15 (2015).
- Hassan, J. A., Zhou, Y. J., Lewis, J. D. A rapid seedling resistance assay identifies wild tomato lines that are resistant to Pseudomonas syringae pv. tomato race 1. Molecular Plant-Microbe Interactions. 30 (9), 701-709 (2017).
- King, E. O., Ward, M. K., Raney, D. E. Two simple media for the demonstration of pyocyanin and fluorescin. Journal of Laboratory and Clinical Medicine. 44 (2), 301-307 (1954).
- Uppalapati, S. R., et al. Pathogenicity of Pseudomonas syringae pv. tomato on tomato seedlings: phenotypic and gene expression analyses of the virulence function of coronatine. Molecular Plant-Microbe Interactions. 21 (4), 383-395 (2008).
- Bhardwaj, V., Meier, S., Petersen, L. N., Ingle, R. A., Roden, L. C. Defence responses of Arabidopsis thaliana to infection by Pseudomonas syringae are regulated by the circadian clock. PLoS One. 6 (10), 26968 (2011).
- Lu, H., McClung, C. R., Zhang, C. Tick tock: circadian regulation of plant innate immunity. Annual Review of Phytopathology. 55, 287-311 (2017).
- Wang, W., et al. Timing of plant immune responses by a central circadian regulator. Nature. 470 (7332), 110-114 (2011).
Tags
Bioteknik Pseudomonas syringae tomat sjukdomsresistens skärm bakterietillväxt fenotyperErratum
Formal Correction: Erratum: High-Throughput Identification of Resistance to Pseudomonas syringae pv. Tomato in Tomato using Seedling Flood Assay
Posted by JoVE Editors on 10/18/2023.
Citeable Link.
An erratum was issued for: High-Throughput Identification of Resistance to Pseudomonas syringae pv. Tomato in Tomato using Seedling Flood Assay. The Introduction, Protocol, Representative Results and Discussion sections were updated.
The last paragraph of the Introduction section was updated from:
In the seedling flood assay described in this protocol, tomato seedlings are grown on Petri dishes of sterile Murashige and Skoog (MS) media for 10 days and then are flooded with an inoculum containing the bacteria of interest and a surfactant. Following flooding, seedlings can be quantitatively evaluated for disease resistance via bacterial growth assays. Additionally, seedling survival or death can act as a discrete resistance or disease phenotype 7–14 days after flooding. This approach offers a high-throughput alternative for screening large numbers of wild tomato accessions for resistance to Pst race 1 strains, such as Pst strain T1 (PstT1), and can easily be adapted to other bacterial strains of interest.
to:
In the seedling flood assay described in this protocol, tomato seedlings are grown on Petri dishes of sterile Murashige and Skoog (MS) media for 10 days and then are flooded with an inoculum containing the bacteria of interest and a surfactant. Following flooding, seedlings can be quantitatively evaluated for disease resistance via bacterial growth assays. Additionally, seedling survival or death can act as a discrete resistance or disease phenotype 7–14 days after flooding. This approach offers a high-throughput alternative for screening large numbers of wild tomato accessions for resistance to Pst race 1 strains, such as Pst strain 19 (Pst19), and can easily be adapted to other bacterial strains of interest.
Step 4.8 of the Protocol section was updated from:
- After 1 h, transfer the bottle to the biosafety cabinet and under aseptic conditions, add 1,600 µL of sterile 1 M MgSO4, and appropriate antibiotics to the media.
NOTE: For rifampicin resistant strains PstDC3000 and PstT1, use rifampicin dissolved in dimethylformamide at a final concentration of 50 µg/mL. Use cycloheximide dissolved in ethanol at a final concentration of 50 µg/mL to prevent fungal growth on the plates.
to:
- After 1 h, transfer the bottle to the biosafety cabinet and under aseptic conditions, add 1,600 µL of sterile 1 M MgSO4, and appropriate antibiotics to the media.
NOTE: For rifampicin resistant strains PstDC3000 and Pst19, use rifampicin dissolved in dimethylformamide at a final concentration of 50 µg/mL. Use cycloheximide dissolved in ethanol at a final concentration of 50 µg/mL to prevent fungal growth on the plates.
Step 5.2 of the Protocol section was updated from:
- Patch bacteria (i.e., PstT1) from a glycerol stock onto KB agar with appropriate antibiotics (section 4).
to:
- Patch bacteria (i.e., Pst19) from a glycerol stock onto KB agar with appropriate antibiotics (section 4).
Step 5.6 of the Protocol section was updated from:
- For PstT1, incubate the KB plate at 28 ˚C for 48 h prior to using bacteria in the flood experiment.
to:
- For Pst19, incubate the KB plate at 28 ˚C for 48 h prior to using bacteria in the flood experiment.
Step 6 of the Protocol section was updated from:
6. Preparation of PstT1 inoculum
to
6. Preparation of Pst19 inoculum
Step 6.2 of the Protocol section was updated from:
- Perform serial dilutions using sterile 10 mM MgCl2 solution in the biosafety cabinet. For PstT1, use a spectrophotometer to make inoculum with a starting concentration of OD600 = 0.1.
to:
- Perform serial dilutions using sterile 10 mM MgCl2 solution in the biosafety cabinet. For Pst19, use a spectrophotometer to make inoculum with a starting concentration of OD600 = 0.1.
Step 6.3 of the Protocol section was updated from:
- For PstT1, make a 1/10 dilution from the initial resuspension at OD600 = 0.1 to obtain a serial dilution at a concentration of OD600 = 0.01.
to:
- For Pst19, make a 1/10 dilution from the initial resuspension at OD600 = 0.1 to obtain a serial dilution at a concentration of OD600 = 0.01.
Step 8.3 of the Protocol section was updated from:
- Set a timer for 3 min. Measure 6 mL of final inoculum (PstT1 OD600 = 0.0075 [section 6] or PstDC3000 OD600 = 0.005 [section 7]) and transfer 6 mL of inoculum to each plate with the 10-day-old seedlings.
to:
- Set a timer for 3 min. Measure 6 mL of final inoculum (Pst19 OD600 = 0.0075 [section 6] or PstDC3000 OD600 = 0.005 [section 7]) and transfer 6 mL of inoculum to each plate with the 10-day-old seedlings.
Step 8.11 of the Protocol section was updated from:
- Phenotype after 7–10 days for PstDC3000 or 10–14 days for PstT1 (section 11). If carrying out bacterial growth assays, collect leaf tissue after 4 days (sections 9 and 10) and then phenotype (section 11). Alternatively, perform phenotypic analysis and bacterial growth assays on separate sets of plants.
to:
- Phenotype after 7–10 days for PstDC3000 or 10–14 days for Pst19 (section 11). If carrying out bacterial growth assays, collect leaf tissue after 4 days (sections 9 and 10) and then phenotype (section 11). Alternatively, perform phenotypic analysis and bacterial growth assays on separate sets of plants.
Step 10.7 of the Protocol section was updated from:
- After obtaining colony counts (Figure 2B), normalize the counts to 0.01 g of tissue for seedlings and convert to log bacterial growth (Table 1).
NOTE: The average mass of one Moneymaker-PtoS cotyledon is 0.01 g and is empirically determined22.
| Genotype1 Column A | Tissue Weight (g) Column B | # of Colonies in a spot Column C | Dilution factor for spot2 Column D | Adjusted # of Colonies3 Column E | Dilution factor for serial dilution Column F | Total # of Colonies Column G (cfu/0.01 g)4 | Average # of Colonies (cfu/0.01 g) Column H | Average Log Growth (cfu/0.01 g (log10)) Column I |
| Sample 1 | 0.004 g | 10 | 200 | calculated as: (C2 x 0.01 g) / B2 = 25 | 1000 | calculated as: (D2 x E2 x F2) = 5000000 | average for sample 1 through last sample: (ie. average G1:G3) = 7000000 | log of average ie. log(H2) = 6.85 |
| Sample 2 | 0.003 g | 15 | 200 | 50 | 1000 | 10000000 | ||
| Sample 3 | 0.002 g | 6 | 200 | 30 | 1000 | 6000000 | ||
| 1Data shown for 3 samples | ||||||||
| 2Based on plating 5 µL x 200 for 1 mL | ||||||||
| 3Cotyledons are too small to core so colony counts were normalized to 0.01 g of tissue based on the average mass of one MoneyMaker-PtoS cotyledon (data not shown) | ||||||||
| 4Adjusted per mL based on volume plated | ||||||||
Table 1: Sample calculations for seedling bacterial growth assay. Sample calculations demonstrate how to normalize bacterial counts and determine log bacterial growth.
to:
- After obtaining colony counts (Figure 2B), normalize the counts to 0.1 g of tissue for seedlings and convert to log bacterial growth (Table 1).
NOTE: The average mass of one Moneymaker-PtoS cotyledon is 0.1 g and is empirically determined22.
| Genotype1 Column A | Tissue Weight (g) Column B | # of Colonies in a spot Column C | Dilution factor for spot2 Column D | Adjusted # of Colonies3 Column E | Dilution factor for serial dilution Column F | Total # of Colonies Column G (cfu/0.01 g)4 | Average # of Colonies (cfu/0.01 g) Column H | Average Log Growth (cfu/0.1 g (log10)) Column I |
| Sample 1 | 0.04 g | 10 | 200 | calculated as: (C2 x 0.1 g) / B2 = 25 | 1000 | calculated as: (D2 x E2 x F2) = 5000000 | average for sample 1 through last sample: (ie. average G1:G3) = 7000000 | log of average ie. log(H2) = 6.85 |
| Sample 2 | 0.03 g | 15 | 200 | 50 | 1000 | 10000000 | ||
| Sample 3 | 0.02 g | 6 | 200 | 30 | 1000 | 6000000 | ||
| 1Data shown for 3 samples | ||||||||
| 2Based on plating 5 µL x 200 for 1 mL | ||||||||
| 3Cotyledons are too small to core so colony counts were normalized to 0.1 g of tissue based on the average mass of one MoneyMaker-PtoS cotyledon (data not shown) | ||||||||
| 4Adjusted per mL based on volume plated | ||||||||
Table 1: Sample calculations for seedling bacterial growth assay. Sample calculations demonstrate how to normalize bacterial counts and determine log bacterial growth.
Step 11.3 of the Protocol section was updated from:
- Phenotype plants infected with PstT1 at 10–14 days after flood inoculation.
to:
- Phenotype plants infected with Pst19 at 10–14 days after flood inoculation.
Figure 4 in the Protocol section was updated from:

Figure 4: Schematic representation of expected phenotypes for seedling resistance and death in various genetic backgrounds. (A) Seedlings of Rio Grande-PtoR and the near-isogenic cultivar Rio Grande-PtoS are displayed 7 days after flooding with PstDC3000 (OD600 = 0.005) + 0.015% surfactant. Rio Grande-PtoR displays consistent resistance, and Rio Grande-PtoS displays consistent susceptibility to infection with PstDC3000. These lines give rise to discrete and binary phenotypes. (B) Seedlings of a wild accession, such as Solanum neorickii LA1329, are shown 10 days after flooding with PstT1 (OD600 = 0.0075) + 0.015% surfactant. Seedlings display phenotypic variability but were recorded as binary phenotypes. The amount of phenotypic variability and the method of phenotyping (binary resistance or resistance spectrum) will depend on the particular accession tested. (C) Mapping populations generated by outcrossing wild accessions to susceptible cultivars may display a wider spectrum of phenotypes in F2 segregating populations. In this case, it may be most appropriate to record seedling phenotypes on a spectrum. Highly susceptible seedlings from a mapping population may be phenotyped for death as early as day 7 when flooded with PstT1, and typically show a brown apical meristem, no to very little extension of the epicotyl, and no new, green vegetative growth. The apical meristem of susceptible seedlings may stay green or very light brown for more time, and there may be some extension of the epicotyl and very little vegetative growth, which turns brown and arrests by day 10. Individual seedlings can be phenotyped for resistance based on the amount of new and ongoing vegetative growth by day 14. Seedlings can then be grouped based on the phenotypes described above into different categories of resistance such as weak, medium, or strong resistance. Please click here to view a larger version of this figure.
to:
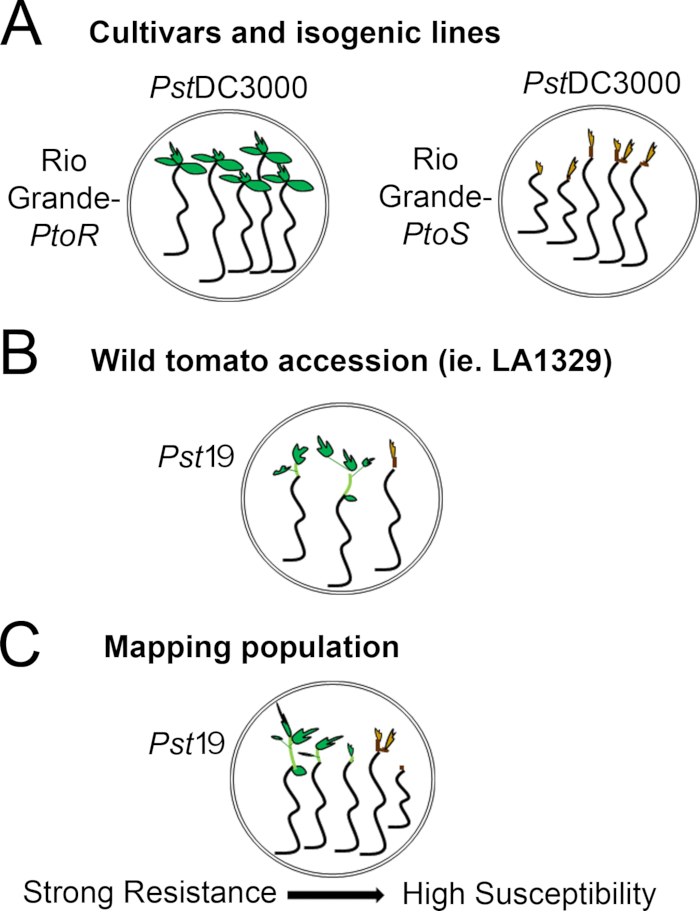
Figure 4: Schematic representation of expected phenotypes for seedling resistance and death in various genetic backgrounds. (A) Seedlings of Rio Grande-PtoR and the near-isogenic cultivar Rio Grande-PtoS are displayed 7 days after flooding with PstDC3000 (OD600 = 0.005) + 0.015% surfactant. Rio Grande-PtoR displays consistent resistance, and Rio Grande-PtoS displays consistent susceptibility to infection with PstDC3000. These lines give rise to discrete and binary phenotypes. (B) Seedlings of a wild accession, such as Solanum neorickii LA1329, are shown 10 days after flooding with Pst19 (OD600 = 0.0075) + 0.015% surfactant. Seedlings display phenotypic variability but were recorded as binary phenotypes. The amount of phenotypic variability and the method of phenotyping (binary resistance or resistance spectrum) will depend on the particular accession tested. (C) Mapping populations generated by outcrossing wild accessions to susceptible cultivars may display a wider spectrum of phenotypes in F2 segregating populations. In this case, it may be most appropriate to record seedling phenotypes on a spectrum. Highly susceptible seedlings from a mapping population may be phenotyped for death as early as day 7 when flooded with Pst19, and typically show a brown apical meristem, no to very little extension of the epicotyl, and no new, green vegetative growth. The apical meristem of susceptible seedlings may stay green or very light brown for more time, and there may be some extension of the epicotyl and very little vegetative growth, which turns brown and arrests by day 10. Individual seedlings can be phenotyped for resistance based on the amount of new and ongoing vegetative growth by day 14. Seedlings can then be grouped based on the phenotypes described above into different categories of resistance such as weak, medium, or strong resistance. Please click here to view a larger version of this figure.
The second paragraph of the Representative Results section was updated from:
Phenotypic screening of wild accessions using the seedling resistance assay
Figure 6 shows representative results for seedlings of susceptible and resistant accessions 10–14 days after flooding with PstT1. Susceptible accessions include RG-PtoR, S. pimpinellifolium LA1375, and S. pimpinellifolium LA1606, and resistant accessions include S. neorickii LA1329. Ten-day-old seedlings were flooded with 10 mM MgCl2 + 0.015% surfactant as a negative control, and PstT1 at an optical density of 0.0075 + 0.015% surfactant. The seedlings were phenotyped at least 10 days after flooding, as PstT1-infected seedlings died more slowly than PstDC3000-infected seedlings. Mock-inoculated seedlings were green, healthy, and actively growing. This control is important to ensure that the accessions are not sensitive to the concentration of surfactant, and to ensure there is no bacterial contamination. Susceptible accessions (Rio Grande-PtoR [n = 7], S. pimpinellifolium LA1375 [n = 7], and S. pimpinellifolium LA1606 [n = 5]) were dead, had brown apical meristems, and lacked new growth 10–14 days after inoculation with PstT1. In contrast, two S. neorickii LA1329 (n = 3) seedlings displayed a high level of new, green growth and survived infection with PstT1 (Figure 6). Three LA1329 seedlings did not germinate. Typically, 5–7 individuals were screened for each accession in a primary screen to determine the prevalence of resistance in the population. When a more genetically complex wild accession, such as LA1329, is flooded with PstT1, the resistance phenotypes display slightly more variability among individual seedlings, compared to Moneymaker-PtoR treated with PstDC3000. However, the resistance phenotypes were usually less variable than those seen in F2 mapping populations. Thus, binary phenotyping criteria was used for LA1329.
to:
Phenotypic screening of wild accessions using the seedling resistance assay
Figure 6 shows representative results for seedlings of susceptible and resistant accessions 10–14 days after flooding with Pst19. Susceptible accessions include RG-PtoR, S. pimpinellifolium LA1375, and S. pimpinellifolium LA1606, and resistant accessions include S. neorickii LA1329. Ten-day-old seedlings were flooded with 10 mM MgCl2 + 0.015% surfactant as a negative control, and Pst19 at an optical density of 0.0075 + 0.015% surfactant. The seedlings were phenotyped at least 10 days after flooding, as Pst19-infected seedlings died more slowly than PstDC3000-infected seedlings. Mock-inoculated seedlings were green, healthy, and actively growing. This control is important to ensure that the accessions are not sensitive to the concentration of surfactant, and to ensure there is no bacterial contamination. Susceptible accessions (Rio Grande-PtoR [n = 7], S. pimpinellifolium LA1375 [n = 7], and S. pimpinellifolium LA1606 [n = 5]) were dead, had brown apical meristems, and lacked new growth 10–14 days after inoculation with Pst19. In contrast, two S. neorickii LA1329 (n = 3) seedlings displayed a high level of new, green growth and survived infection with Pst19 (Figure 6). Three LA1329 seedlings did not germinate. Typically, 5–7 individuals were screened for each accession in a primary screen to determine the prevalence of resistance in the population. When a more genetically complex wild accession, such as LA1329, is flooded with Pst19, the resistance phenotypes display slightly more variability among individual seedlings, compared to Moneymaker-PtoR treated with PstDC3000. However, the resistance phenotypes were usually less variable than those seen in F2 mapping populations. Thus, binary phenotyping criteria was used for LA1329.
Figure 6 in the Representative Results section was updated from:
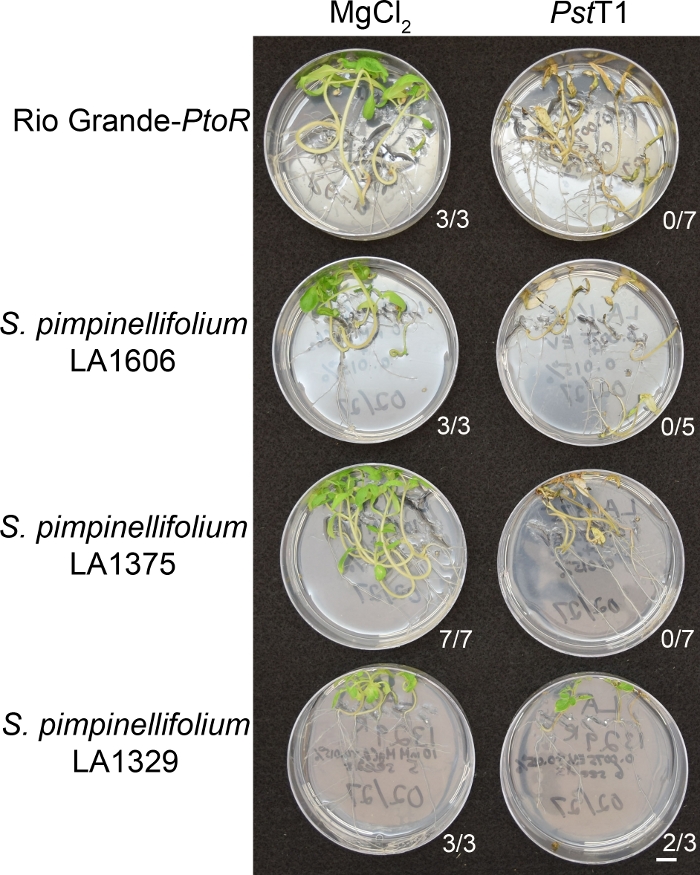
Figure 6: Phenotypic characterization of resistance or disease symptoms 10–14 days post-infection in wild accessions. Rio Grande-PtoR, S. pimpinellifolium LA1606, S. pimpinellifolium LA1375 and S. neorickii LA1329 tomato seedlings were grown on 0.5x MS plates for 10 days, and then flooded with PstT1 (OD600 = 0.0075) + 0.015% surfactant. The number of surviving seedlings for each wild accession out of the total number tested is shown. Scale bar = 1 cm. Please click here to view a larger version of this figure.
to:

Figure 6: Phenotypic characterization of resistance or disease symptoms 10–14 days post-infection in wild accessions. Rio Grande-PtoR, S. pimpinellifolium LA1606, S. pimpinellifolium LA1375 and S. neorickii LA1329 tomato seedlings were grown on 0.5x MS plates for 10 days, and then flooded with Pst19 (OD600 = 0.0075) + 0.015% surfactant. The number of surviving seedlings for each wild accession out of the total number tested is shown. Scale bar = 1 cm. Please click here to view a larger version of this figure.
The third paragraph of the Representative Results section was updated from:
Quantitative assessment of bacterial growth using the seedling flood assay
To confirm that the observed resistance in LA1329 to PstT1 resulted in lower bacterial growth, bacterial growth assays were carried out in tomato seedlings. The level of PstT1 growth in Moneymaker-PtoS and S. neorickii LA1329 was determined 4 days post-infection. Moneymaker-PtoS is a near-isogenic line with consistent susceptibility among individual seedlings. Wild accessions such as S. neorickii LA1329 are often more genetically complex. LA1329 displays approximately 60% resistance to PstT1 across the population22. Because seedlings may drop their cotyledons after infection, one seedling was grown on each plate to correlate bacterial growth in the harvested cotyledon with overall seedling survival or death as determined phenotypically at least 10 days after flooding. The bacterial counts on day 4 for each seedling were normalized to 0.01 g of tissue and converted to log growth (CFU/0.01 g(log10)). Log growth for phenotypically resistant LA1329 seedlings (LA1329RES) or phenotypically susceptible seedlings (LA1329SUS) were separately pooled and compared to each other and the susceptible cultivar Moneymaker-PtoS. For example, there was a 1.7 log difference in bacterial growth between LA1329RES (log 6.3) and LA1329SUS (log 8.0), and a 1.6 log difference between LA1329RES (log 6.3) and Moneymaker-PtoS (log 7.9) (Figure 7). Therefore, phenotypic resistance correlated with quantitative resistance in the seedling assays.
to:
Quantitative assessment of bacterial growth using the seedling flood assay
To confirm that the observed resistance in LA1329 to Pst19 resulted in lower bacterial growth, bacterial growth assays were carried out in tomato seedlings. The level of Pst19 growth in Moneymaker-PtoS and S. neorickii LA1329 was determined 4 days post-infection. Moneymaker-PtoS is a near-isogenic line with consistent susceptibility among individual seedlings. Wild accessions such as S. neorickii LA1329 are often more genetically complex. LA1329 displays approximately 60% resistance to Pst19 across the population22. Because seedlings may drop their cotyledons after infection, one seedling was grown on each plate to correlate bacterial growth in the harvested cotyledon with overall seedling survival or death as determined phenotypically at least 10 days after flooding. The bacterial counts on day 4 for each seedling were normalized to 0.01 g of tissue and converted to log growth (CFU/0.01 g(log10)). Log growth for phenotypically resistant LA1329 seedlings (LA1329RES) or phenotypically susceptible seedlings (LA1329SUS) were separately pooled and compared to each other and the susceptible cultivar Moneymaker-PtoS. For example, there was a 1.7 log difference in bacterial growth between LA1329RES (log 6.3) and LA1329SUS (log 8.0), and a 1.6 log difference between LA1329RES (log 6.3) and Moneymaker-PtoS (log 7.9) (Figure 7). Therefore, phenotypic resistance correlated with quantitative resistance in the seedling assays.
Figure 7 in the Representative Results section was updated from:
x
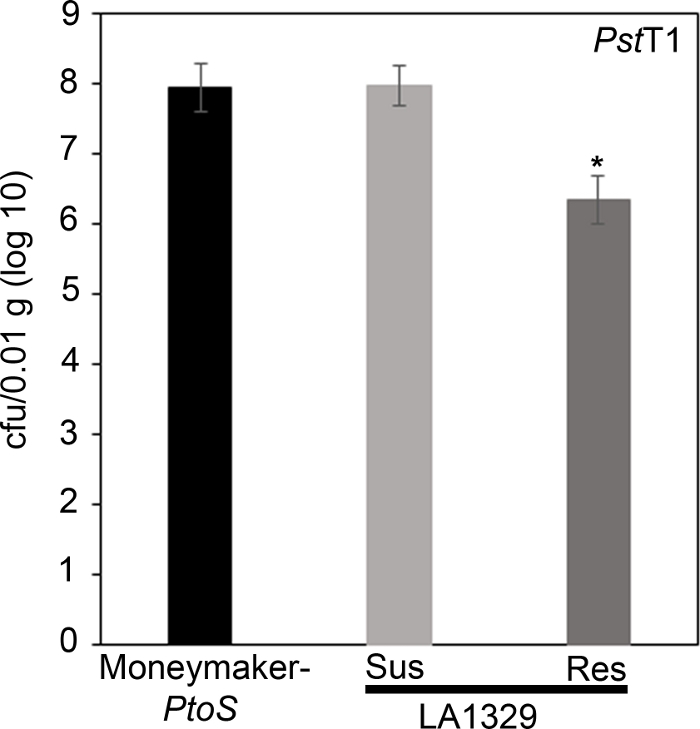
Figure 7: Resistant Solanum neorickii LA1329 seedlings support lower bacterial growth than Moneymaker-PtoS or susceptible S. neorickii LA1329. Bacterial counts were determined 4 days post-inoculation from S. neorickii LA1329 (n = 14) and Moneymaker-PtoS (n = 10) seedlings infected with PstT1 and normalization was performed to 0.01 g of tissue. For LA1329, the two phenotypic groups, susceptible (SUS) or resistant (RES), were observed and counted separately. Above the bar * = statistically significant difference determined by a one-factor analysis of variance. A general linear model procedure (p < 0.001) followed by a multiple comparison of means using Tukey's post hoc test was used. Error bars = standard error. The figure indicates one representative experiment. Please click here to view a larger version of this figure.
x
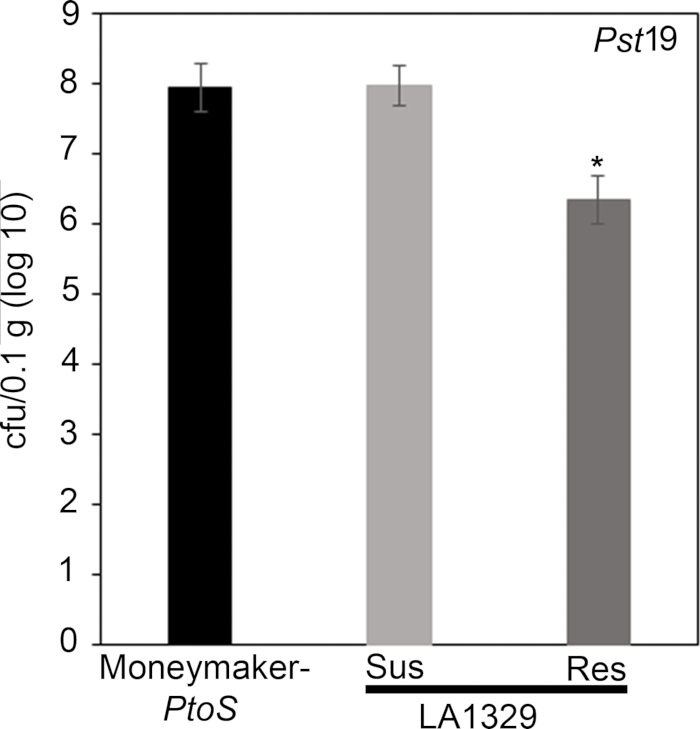
Figure 7: Resistant Solanum neorickii LA1329 seedlings support lower bacterial growth than Moneymaker-PtoS or susceptible S. neorickii LA1329. Bacterial counts were determined 4 days post-inoculation from S. neorickii LA1329 (n = 14) and Moneymaker-PtoS (n = 10) seedlings infected with Pst19 and normalization was performed to 0.1 g of tissue. For LA1329, the two phenotypic groups, susceptible (SUS) or resistant (RES), were observed and counted separately. Above the bar * = statistically significant difference determined by a one-factor analysis of variance. A general linear model procedure (p < 0.001) followed by a multiple comparison of means using Tukey's post hoc test was used. Error bars = standard error. The figure indicates one representative experiment. Please click here to view a larger version of this figure.
The first paragraph of the Discussion section was updated from:
A protocol for flood inoculation with PstDC3000 or PstT1 optimized to detect resistance to these bacterial strains in tomato seedlings is described. There are several critical parameters for optimal results in the seedling resistance assay, including bacterial concentration and surfactant concentration, which were empirically determined22. For PstDC3000, the optical density was optimized to achieve complete survival on a resistant cultivar containing the Pto/Prf cluster and complete death on a susceptible cultivar lacking the Pto/Prf cluster22. For a strain such as PstT1, where there are no known resistant varieties, the optical density was optimized to be the lowest possible for consistent and complete plant death22. Uppalapati et al.24 designed a tomato seedling assay to investigate the pathogenesis of PstDC3000 and the virulence function of coronatine. In this virulence assay, infections were performed using bacteria concentrated to an OD600 of 0.124, 20x higher than the optical density of strains used in our resistance assay. Recognition of PstDC3000 effectors AvrPto and AvrPtoB in tomato seedlings carrying the Pto/Prf gene cluster results in ETI and a macroscopic HR22. In the context of a strong immune response such as ETI, a lower bacterial titer was used for PstDC3000 to avoid overwhelming genetic resistance from the Pto/Prf gene cluster22. In addition, these results suggest that a high bacterial concentration could overwhelm weaker immune responses such as PTI or quantitative partial resistance, where multiple genes contribute to the overall phenotype. Surfactant is necessary for the bacteria to adhere to the leaf surface; however, high concentrations can cause chlorosis of the leaf22. We previously tested a range of surfactant concentrations to empirically determine the ideal concentration in 10-day-old tomato seedlings22. When testing new species that may differ in their sensitivity to surfactant, the surfactant concentration should be optimized to identify a concentration that does not cause damage or chlorosis in the absence of bacteria. Appropriate assay conditions will require optimization of a surfactant concentration that does not cause damage, and a bacterial concentration that causes disease in all susceptible controls.
to:
A protocol for flood inoculation with PstDC3000 or Pst19 optimized to detect resistance to these bacterial strains in tomato seedlings is described. There are several critical parameters for optimal results in the seedling resistance assay, including bacterial concentration and surfactant concentration, which were empirically determined22. For PstDC3000, the optical density was optimized to achieve complete survival on a resistant cultivar containing the Pto/Prf cluster and complete death on a susceptible cultivar lacking the Pto/Prf cluster22. For a strain such as Pst19, where there are no known resistant varieties, the optical density was optimized to be the lowest possible for consistent and complete plant death22. Uppalapati et al.24 designed a tomato seedling assay to investigate the pathogenesis of PstDC3000 and the virulence function of coronatine. In this virulence assay, infections were performed using bacteria concentrated to an OD600 of 0.124, 20x higher than the optical density of strains used in our resistance assay. Recognition of PstDC3000 effectors AvrPto and AvrPtoB in tomato seedlings carrying the Pto/Prf gene cluster results in ETI and a macroscopic HR22. In the context of a strong immune response such as ETI, a lower bacterial titer was used for PstDC3000 to avoid overwhelming genetic resistance from the Pto/Prf gene cluster22. In addition, these results suggest that a high bacterial concentration could overwhelm weaker immune responses such as PTI or quantitative partial resistance, where multiple genes contribute to the overall phenotype. Surfactant is necessary for the bacteria to adhere to the leaf surface; however, high concentrations can cause chlorosis of the leaf22. We previously tested a range of surfactant concentrations to empirically determine the ideal concentration in 10-day-old tomato seedlings22. When testing new species that may differ in their sensitivity to surfactant, the surfactant concentration should be optimized to identify a concentration that does not cause damage or chlorosis in the absence of bacteria. Appropriate assay conditions will require optimization of a surfactant concentration that does not cause damage, and a bacterial concentration that causes disease in all susceptible controls.
The third paragraph of the Discussion section was updated from:
Pst is a foliar pathogen that preferentially colonizes the aerial parts of tomato seedlings, including the cotyledons24 (Figure 3). Therefore, qualitative phenotyping in the seedling flood assay focuses on growth and disease symptoms in aerial portions of the seedling, and tissue for the bacterial growth assay is sampled from the cotyledons for quantitative analysis. After flood inoculation, seedlings may die within 7–10 days after inoculation with PstDC3000 or 10–14 days after inoculation with PstT1, as discussed in section 11. Seedling death is visualized by a brown apical meristem, arrested epicotyl elongation, and/or arrested vegetative growth. If different bacterial strains are used, the timing will have to be empirically determined. In addition, the progression of disease on control plants should be monitored daily after flooding until a consistent time frame from the onset of disease symptoms to seedling death can be identified. Depending on the genotypes and treatments used in the flood assay, seedling phenotypes can be recorded as binary phenotypes or on a disease spectrum (Figure 4). A broader spectrum of phenotypes may be observed when flood inoculating F2 mapping populations from wild tomato accessions crossed to susceptible cultivars (Figure 4C). It may be best to phenotype segregating populations on a disease spectrum depending on how quickly the seedling dies and the degree of new vegetative growth and branching (Figure 4C). The seedling flood assay can also be used in conjunction with the seedling bacterial growth assay to quantitatively assess levels of bacterial growth associated with qualitative phenotypes in individual seedlings (Figure 7). Very large reductions (i.e., ~log 3) in bacterial growth or strong resistance in resistant seedlings of a wild accession compared to a susceptible cultivar suggest that the underlying genetic basis of resistance may be due to ETI22. Smaller reductions in bacterial growth (i.e., ~log 1.7), as observed in LA1329 seedlings, may be due to the contribution of weaker resistance from quantitative trait loci and/or PTI. Thus, the seedling growth assay can be an important tool in further characterizing resistance in wild tomato lines.
to:
Pst is a foliar pathogen that preferentially colonizes the aerial parts of tomato seedlings, including the cotyledons24 (Figure 3). Therefore, qualitative phenotyping in the seedling flood assay focuses on growth and disease symptoms in aerial portions of the seedling, and tissue for the bacterial growth assay is sampled from the cotyledons for quantitative analysis. After flood inoculation, seedlings may die within 7–10 days after inoculation with PstDC3000 or 10–14 days after inoculation with Pst19, as discussed in section 11. Seedling death is visualized by a brown apical meristem, arrested epicotyl elongation, and/or arrested vegetative growth. If different bacterial strains are used, the timing will have to be empirically determined. In addition, the progression of disease on control plants should be monitored daily after flooding until a consistent time frame from the onset of disease symptoms to seedling death can be identified. Depending on the genotypes and treatments used in the flood assay, seedling phenotypes can be recorded as binary phenotypes or on a disease spectrum (Figure 4). A broader spectrum of phenotypes may be observed when flood inoculating F2 mapping populations from wild tomato accessions crossed to susceptible cultivars (Figure 4C). It may be best to phenotype segregating populations on a disease spectrum depending on how quickly the seedling dies and the degree of new vegetative growth and branching (Figure 4C). The seedling flood assay can also be used in conjunction with the seedling bacterial growth assay to quantitatively assess levels of bacterial growth associated with qualitative phenotypes in individual seedlings (Figure 7). Very large reductions (i.e., ~log 3) in bacterial growth or strong resistance in resistant seedlings of a wild accession compared to a susceptible cultivar suggest that the underlying genetic basis of resistance may be due to ETI22. Smaller reductions in bacterial growth (i.e., ~log 1.7), as observed in LA1329 seedlings, may be due to the contribution of weaker resistance from quantitative trait loci and/or PTI. Thus, the seedling growth assay can be an important tool in further characterizing resistance in wild tomato lines.
The fourth paragraph of the Discussion section was updated from:
Typically, genetic screens have been performed on four- to five-week-old adult tomato plants to identify the genetic basis of P. syringae resistance in wild accessions20,21. Adult tomato plants require much longer growth times, require more space in the growth chamber, and are much larger plants, which means that usually few individuals are screened for each line. The seedling flood assay provides a powerful, alternative approach in the identification of P. syringae resistance in wild tomato accessions. Screening at the seedling stage permits a large sample size to be tested which can be particularly advantageous in detecting resistance in genetically complex populations. Reduced growth chamber space requirements and growth time facilitate a high-throughput approach and rapid detection of natural resistance in wild accessions to emerging pathogens. Furthermore, P. syringae resistance that was identified at the seedling stage in this assay is not restricted to the developmental stage. S. neorickii LA1329 and S. habrochaites LA1253 were initially identified at the seedling stage and also display resistance to PstT1 in adult plants as previously described22.
to:
Typically, genetic screens have been performed on four- to five-week-old adult tomato plants to identify the genetic basis of P. syringae resistance in wild accessions20,21. Adult tomato plants require much longer growth times, require more space in the growth chamber, and are much larger plants, which means that usually few individuals are screened for each line. The seedling flood assay provides a powerful, alternative approach in the identification of P. syringae resistance in wild tomato accessions. Screening at the seedling stage permits a large sample size to be tested which can be particularly advantageous in detecting resistance in genetically complex populations. Reduced growth chamber space requirements and growth time facilitate a high-throughput approach and rapid detection of natural resistance in wild accessions to emerging pathogens. Furthermore, P. syringae resistance that was identified at the seedling stage in this assay is not restricted to the developmental stage. S. neorickii LA1329 and S. habrochaites LA1253 were initially identified at the seedling stage and also display resistance to Pst19 in adult plants as previously described22.
