


Overview
Source: Sina Shahbazmohamadi and Peiman Shahbeigi-Roodposhti-Roodposhti, School of Engineering, University of Connecticut, Storrs, CT
Bones are composites, made of a ceramic matrix and polymer fiber reinforcements. The ceramic contributes compressive strength, and the polymer provides tensile and flexural strength. By combining ceramic and polymer materials in different amounts, the body can create unique materials tailored for a specific application. As biomedical engineers, having the ability to replace and replicate bone due to disease or traumatic injury is a vital facet of medical science.
In this experiment we will create three different ceramic-matrix composites with plaster of Paris (which is a calcium sulfate compound), and allow them to undergo three-point bending test in order to determine which preparation is the strongest. The three composites are as follows: one comprised only of plaster of Paris, one with chopped glass shards mixed in a plaster matrix and lastly a plaster matrix with a fiberglass network embedded within it.
Principles
When a given material needs to be tested, one of the premier methods of testing the strength of less ductile materials is a three-point bending test. The three-point bending test is a method that allows a given sample to experiences a combination of forces (compressive and tensile) as well as a plane of shear stress in the middle of the material that is representative of most of the forces human bones are consistently subjected to. With the results of this experiment a better understanding of composite materials can be achieved, along with the scope and limitations to these biomaterials.
In the 3-point bend test, the bottom of the sample is in tension, the top is in compression, and there is a shear plane in the middle of the sample (Figure 1).

Figure 1: Schematic representation of the 3-point bend test.
Living bone can remodel and restructure itself to accommodate these forces. For example, in rib bones there is a high concentration of mineral phase on the inside of the curve (where there are compressive forces) and a high concentration of collagen fibers on the outside of the curve (where there are tensile forces).
The properties of a composite are based on the properties of its matrix and filler materials. Several formulas have been developed to calculate the overall strength and modulus of a composite as a function of the type and amount of fillers. The simplest of these is the "rule of mixtures", which gives the maximum theoretical value of the property in question. The rule of mixtures for flexural strength is given below:
σcomp = σmVm + σ1V1 + σ2V2 + ... (1)
Where:
σcomp = maximum of theoretical strength of the composite
σm = strength of the matrix
σ1, σ2 ... = strengths of the filler materials 1, 2, etc.
Vm, V1, V2,.. = volume fractions of the matrix and fillers.
Subscription Required. Please recommend JoVE to your librarian.
Procedure
1. Making one plain plaster sample
- Obtain a blue rubber mold from the instructor. Each mold can make 3 bar-shaped samples, the size of the each bar is roughly about 26 mm in the width, 43 mm in the length, and 10 mm in the thickness.
- Weigh 40 grams of dry plaster powder into a paper cup. Slowly add 20 ml of deionized water, and stir the slurry with a wooden stick, until a smooth consistency is achieved. Proceed immediately to step 3! The plaster starts to harden in ~5 minutes.
- Pour the resulting slurry into one of the compartments of the mold. Fill the mold completely, and smooth it over with the wooden stick. Throw away the cup and any excess plaster; keep the stick for future use.
2. Making two composite samples
- Prepare the sample made with chopped fiber reinforcement:
a.) Weigh 4 grams of chopped glass fibers into a paper cup.
b.) Weigh 40 grams of plaster powder into the same cup.
c.) Slowly add 20 ml of deionized water, and stir the slurry with the wooden stick, until the fibers are thoroughly mixed in, and a smooth consistency is achieved.
d.) Pour the slurry into one of the mold compartments. Fill the mold completely, and smooth it over with the wooden stick. - Prepare the sample made with fiberglass tape:
a.) Cut 2 strips of fiberglass tape, about 5 inches long. Weigh the strips.
b.) Weigh 40 grams of dry plaster powder into a paper cup. Slowly add 20 ml of deionized water, and stir the slurry until a smooth consistency is achieved.
c.) Pour about one third of the plaster into the mold. Place one strip of fiberglass tape on top of the plaster, and press it down with the wooden stick. Make sure that the plaster thoroughly wets the fiberglass tape.
d.) Pour about half of the remaining plaster on top of the fiberglass tape. Place the second strip of tape on top of the plaster, and press it down with the wooden stick.
e.) Pour the rest of the plaster on top of the second strip, and press it down with the wooden stick. Make sure that the plaster thoroughly wets the fiberglass tape, and squeeze out any air bubbles.
3. Performing experiments
- Measure the average length, thickness and width of each bar Measure L (span length in the figure below) on the 3-point test fixture, use calibrated calipers for the measurement.
- Use a displacement speed of 5 mm/min for all tests. (The UTM then should be zeroed and initiated at a displacement speed of 5mm/min). For the plain plaster and chopped fiber sample, run the test until the sample fails. For the fiberglass tape sample, run the test until the deflection is 6 mm.
- Use the LabVIEW program on the computer to collect the data from each test into a text file.
4. MATLAB Program
- Create a MATLAB program that will do the following:
- Read a single column text file and separate the readings into force and deflection data. Convert the raw data into force and deflection using the following conversion factors:
Force = (Load Cell Maximum Value / 30000) * Number generated by UTM (2)
Deflection = 0.001mm * Number generated by UTM (3) - Calculate the flexural strength and flexural strain of each sample:
Flexural strength σf = (3FL)/(2wt2) (4)
Flexural strain εf = (6Dt)/(L2) (5) - Plot a stress-strain curve for each sample. Let εf be the horizontal axis and σf be the vertical axis.
- Find the maximum σf and εf values for each sample. For the composite samples, select the εf value that corresponds to the maximum σf value.
- Find the flexural modulus Ef by calculating the slope of the curve in the elastic region.
- Find the area under each stress-strain curve.
5. Data Analysis
- Comparison of the flexural strength and modulus of the composite samples to that of the plain plaster sample
Since the UTM generates a single column text file, for both force and deflection, MATLAB interface has to sort the corresponding values into different arrays. Thus, to determine both the force and deflection needed for Equations 4 and 5, Equations 2 and 3 should be implemented into MATLAB.
Using a Load Cell Maximum of 1000, the determination of flexural strength and strain is the combination of all equations. Since MATLAB also generates the stress-strain curve of each sample, the flexural modulus was ascertained by calculating the slope of the elastic region. Using Equation 6, the flexural modulus will be calculated with respect to the two selected points on the stress-strain plot:
 (6)
(6)
Examining a sample data, we will see that as different forms of reinforcement are added, the strength of the samples will be increased, with fiberglass tape providing the greatest additional strength. In the terms of ductility, (which can be considered as the "most plastically deformable") the fiberglass tape reinforced specimen will be the greatest as well.
Also, fiber length and orientation drastically affect the properties of composite samples. For example, maximum reinforcement can only be achieved when the fiberglass tape is set parallel to the surfaces of the specimen. In doing so, this spatial orientation allows the fiberglass tape to withstand additional forces as the plaster matrix fails. In addition, it can also be concluded that longer strips of fiberglass tape would prove to provide more strength than shorter strips. Longer pieces would allow for maximum traction under the conditions of a 3-point bending test, as there is more plaster surrounding the fiberglass reinforcement. - Energy absorption during bond test
The area under the stress-strain curve represents the energy a material absorbs before failure. According to the results we will achieve, it will be shown that the fiberglass reinforced specimen absorbs the greatest amount of energy. In addition, since toughness corresponds to the ability of a material to absorb energy and plastically deform without fracturing and the fiberglass sample proved to be the most ductile by absorbing the greatest amount of energy; the fiberglass specimen is inherently the toughest amongst the three. Hence, toughness is the balance between strength and ductility, and the fiberglass sample had the largest area beneath its stress strain curve. - Calculation of the theoretical strength of the chopped fiber and fiberglass tape composites using the "rule of mixtures" formula (the relevant material properties are listed in Table 1).
The theoretical strength of the composite can be calculated through Equation 1, where:
VF = volume fraction of fiber = (volume of fiber)/(total volume of the sample)
Volume of fiber = (mass of fiber)/(density of fiber)
Volume fraction of plaster = VP = 1- VF .
 (6)
(6)| Density, g/ml | Flexural strength, MPa | |
| Chopped glass fibers | 2.5 | 35 |
| Fiberglass tape | 0.45 | 35 |
| Plaster | NA | NA |
Table 1. Material properties.
A composite is a material formed by combining a matrix and one or more reinforcement materials. The overall bending strength of a composite depends on the properties of the materials it is made up of. A ceramic is a hard material with strong compression properties, but this material is also very brittle. By mixing it glass or polymer fibers, it turns into a more ductile material.
For example, in artificial bone composites, the ceramic provides the required compressive strength while the polymer fibers add the tensile and flexural strength to it. By combining ceramic and polymer materials in different amounts, unique materials can be created tailored for a specific application.
This video will illustrate how to make three ceramic matrix composites with plaster of Paris and determine which preparation has the strongest bending properties. The flexural strength of these samples would measured using the three-point bending test.
Let us have a closer look at the three-point bending test. In this method a bar shaped sample is mounted lengthwise on two parallel pins. The mounting should be such that it allows the material to stretch as well as bend under an external force.
In this test, an external force is applied perpendicular to the sample in the middle. As a result, it undergoes compression force on the side where external load is applied and tensile force on the opposite side where it gets stretched. The combination of these two forces also creates an area of sheer stress along the midline.
These three forces together decide the bending or flexural strength of a given sample. With an increase in the external force, the amount of bending or deflection of a material also increases until the material fails. The flexural strain on a material can be calculated using the deflection, span length, and thickness of the sample. The flexural stress of the material can be calculated from the applied force, span length, width, and thickness of the sample.
The three-point bending test gives a flexural stress and strain curve of a material. The slope of a curve in the elastic region represents the flexural modulus of the sample and measures how much a given material can be flexed. The area under the stress-strain curve represents the amount of energy absorbed by a material before failure, hence, it is a measure of the toughness of the material.
Theoretically, the maximum flexural strength of a composite can be calculated with the rule of mixtures using the maximum flexural strength of its matrix and reinforcement materials under volume fractions.
Now that you understand how the three-point bending method works and how to measure the bending properties of the material, let's make three ceramic based composites and find out which one has the highest bending strength.
First let's make three samples of ceramic matrix composites. To begin, get a blue rubber mold which can make three bar-shaped samples. We will make your first sample from the plain plaster. To begin with, weigh 40 grams of dry plaster powder into a plastic cup then slowly add 20 milliliters of deionized water and stir it with a stick until a smooth consistency is achieved. Proceed immediately to the next step because the plaster starts to harden in approximately five minutes. Next, pour the resulting slurry in one of the compartments of the mold. Fill the mold completely and smooth it over with the stick. Finally, throw away the cup and any excess plaster. Please keep the stick for future use.
You will make your second composite sample using the plaster powder and chopped glass fibers. To do that, first weigh four grams of chopped glass fibers into a plastic cup. Next, weigh 40 grams of plaster powder into the same cup then slowly add 20 milliliters of deionized water. Keep stirring the slurry with the stick until the fibers are thoroughly mixed in and a smooth consistency is achieved. Pour the slurry into the second mold as described for sample one.
You will make the last composite sample using the plain plaster powder and the fiber glass tape. To do that, first cut two strips of fiber glass tape about five inches long and weigh them. Second, make a slurry with a plain plaster powder as you did for the first sample.
Next, pour about 1/3 of the plaster into the mold. Place one strip of fiber glass tape on top of the plaster and press down with a stick. Always make sure that the plaster thoroughly wets the fiber glass then pour about 1/2 of the remaining plaster on top of the fiber glass tape.
Next, place the second strip of tape on top of the plaster and press it down with a stick. Pour the rest of the plaster on top of the second strip and press it down with the stick.
Measure the average length, width, and height of each bar. Measure the span length of the sample on three-point test fixture using calibrated calibers. Set the UTM instrument to zero and initiate added displacement speed of five millimeters per minute.
For the plain plaster and chopped glass fiber samples, run the test until the samples fail. For the fiber glass tape composite, run the test until the deflection is six millimeters. Use the lab view program on your computer to collect the data from each test into a text file.
UTM generates a single column text file for both force and deflection. The lab view interface sorts the corresponding readings into two different arrays. Now, convert the raw data into force and deflection using the numbers generated by the UTM and load cell maximum value of 1,000.
Next, using the force and deflection values, calculate the flexural stress and strain. Plot the flexural strain-stress curve of the three samples: plaster, chopped glass composite, and fiber tape composite. Find the maximum flexural strength from the curve. Also find the flexural strain at the maximum strength. Next, calculate the flexural modulus and the total area under the curve for each sample.
Finally, compare the results of the three samples. This experiment demonstrates that the desired strength of a sample can be achieved by using different reinforcement materials. Examining the sample data, we see that fiber glass tape provides the greatest additional strength. It also covers the maximum area under the curve, hence is the toughest among the three. Fiber length and orientation drastically affect the properties of composite samples.
For example, the maximum reinforcement can only be achieved when the fiber glass tape is set parallel to the surfaces of the specimen. This spatial orientation allows the fiber glass tape to withstand additional forces as the plaster matrix fails. Longer pieces would allow for maximum traction under the test as there is more plaster surrounding the fiber glass reinforcement.
Ceramic matrix composites are used in a wide range of fields: space science, bioengineering, and automotive breaking systems. Ceramic matrix composites are also used in synthesizing our artificial bones. Our bones inherently have a strong composite structure thus having the ability to replace and replicate a bone due to disease or traumatic injury is important component of medical science.
Ceramic composites also provide exceptional automotive breaking systems because of their higher strength, higher thermal stability, and lower wear. For these reasons they are used in sports cars.
You've just watched Jove's Introduction to Ceramic Matrix Composite Materials and Their Bending Properties. You should now understand how to make a composite material, test its bending properties using the three-point bending test, and compare it with the other composites.
Thanks for watching.
Subscription Required. Please recommend JoVE to your librarian.
Results
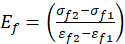
The overall objective of the series of aforementioned tests is to compare the different physical characteristics between various composite bone substitutes. Flexural strength and strain needs to be calculated using Equations 4 and 5, respectively. The stress and strain for each sample will be plotted in MATLAB. From this, the maximum flexural strength and the corresponding flexural strain can be found for each data set. The stress (σf1, σf2) and strain (εf1, εf2) for each data point will then be used in Equation 6 in order to determine the flexural modulus for each sample.
Subscription Required. Please recommend JoVE to your librarian.
Applications and Summary
This experiment was designed to study flexural strength on three different kind of composite material. We fabricated three specimens with different reinforcement materials. The matrix was plaster of Paris (a calcium sulfate compound), and we used chopped glass fibers and fiberglass tape as reinforcements. We performed 3-point bending test on the fabricated specimens, and analyzed the achieved data, comparing the properties of composites made with long, oriented fibers vs. short random fibers.
Bones inherently have a strong composite structure, an adaptation to the many different forces the body has to withstand on a consistent basis. The composite structure can be described as a ceramic matrix interspersed with polymer fibers. The ceramic aspect provides for high compressive strength, while the polymer fibers give rise to increased flexural strength. Evidently, as biomedical engineers, having the ability to replace and replicate bone due to disease or traumatic injury is a vital facet of medical science. Moreover, synthesizing suitable replacement tissues from various metals, polymers, or ceramics is a viable alternative. Bioengineered replacements must match the functionality of their biological counterparts, and the critical analysis and testing of different biomaterials becomes increasingly important.
Subscription Required. Please recommend JoVE to your librarian.