


Overview
Source: Laboratories of Margaret Workman and Kimberly Frye - Depaul University
Nitrogen and phosphorus are essential plant nutrients found in aquatic ecosystems and both are monitored as a part of water quality testing because in excess amounts they can cause significant water quality problems.
Nitrogen in water is measured as the common form nitrate (NO3-) that is dissolved in water and readily absorbed by photosynthesizers such as algae. The common form of phosphorus measured is phosphate (PO43-), which is strongly attracted to sediment particles as well as dissolved in water. In excess amounts, both nutrients can cause an increase in aquatic plant growth (algal bloom, Figure 1) that can disrupt the light, temperature, and oxygen levels in the water below and lead to eutrophication and hypoxia (low dissolved oxygen in water) forming a “dead zone” of no biological activity. Sources of nitrates and phosphorus include wastewater treatment plants, runoff from fertilized lawns and agricultural lands, faulty septic systems, animal manure runoff, and industrial waste discharge.
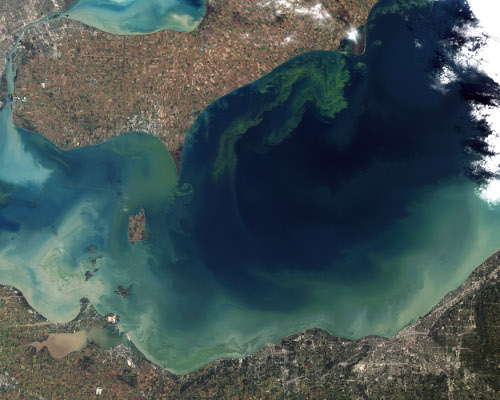
Figure 1. Algal bloom
Taken in 2011, the green scum shown in this image was the worst algae bloom Lake Erie has experienced in decades. Record torrential spring rains washed fertilizer into the lake, promoting the growth of microcystin producing cyanobacteria blooms. Vibrant green filaments extend out from the northern shore.
Principles
Nitrate and phosphate concentrations can be measured in water samples using known chemical reagents that cause the sample to change color when in the presence of a specific nutrient, with increasing color intensity indicating an increased concentration of the nutrient. To ensure release of any phosphate molecules that are bonded to sediments in the water, phosphorus samples are digested chemically and with heat to release phosphate bonds for a measure of total phosphate in the sample.
To quantify the color intensity produced by the reagent, a spectrophotometer is used to measure the specific wavelength of light that corresponds with each color caused by the nutrients and their reagents (nitrates amber; phosphates blue). The spectrophotometer then sends a beam of light through each sample to measure the amount of that light that is absorbed by the color (absorbance). The darker the color, the higher the absorbance. The spectrophotometer then converts the absorbance to a displayed nutrient concentration (mg/L) based on known concentration assays.
Subscription Required. Please recommend JoVE to your librarian.
Procedure
1. Measure Nitrogen in Sample
- On the spectrophotometer, find the program for nitrate (with user manual or instrument menu) and enter the program number.
- Pipette 10 mL of the water sample into one of the sample tubes. Pour this into one of the sample tubes.
- Repeat for a second sample tube.
- Add the contents of one nitrate reagent powder pillow to one sample tube.
- Cap both sample tubes.
- On the spectrophotometer, press timer and enter to start a reaction period for the reagent. Shake the sample vigorously until the reaction time is over and timer beeps. Sample will begin to turn amber.
- Press enter. A second 5-min reaction period will begin.
- After the timer beeps the second time, wipe off the outside of the two sample tubes with a lint-free paper towel.
- Place the sample tube without reagent (blank) tube into the spectrophotometer.
- Tightly cover the cell with the instrument cap to ensure ambient light is blocked.
- Zero the spectrophotometer for a reading of 0.0 mg/L NO3-N.
- Remove the blank cell and place the sample cell with reagent into the cell holder. Tightly cover the sample cell with the instrument cap.
- Press READ. The cursor will move to the right, then the results in mg/L NO3-N will be displayed.
2. Measure Phosphorus in Sample
- Measure out 5.0 mL of the water sample using a pipette.
- Pour measured water into a sample tube.
- Add the contents of one potassium persulfate powder pillow for phosphonate to the sample tube.
- Cap the tube tightly and shake to dissolve.
- Label the top of the tube cap and place the tube in a COD reactor (in a chemical hood) and heat for 30 min.
- Place it in a test tube rack and allow to cool to room temperature.
- Using a graduated cylinder, measure out 2 mL of 1.54 N sodium hydroxide.
- Pour this into the sample tube. Cap and mix.
- On the spectrophotometer, find the program number for phosphate (with user manual or instrument menu) and enter the program number.
- Clean the outside of the sample tube with a lint-free paper towel.
- Place the test tube so that it is facing the front of the instrument.
- Place the cover on the test tube.
- Take out test tube and add the contents of the purchased reagent powder pillow for the ascorbic acid method.
- Cap tightly and shake for 10-15 s.
- Press timer and then enter. A 2-min waiting period will begin.
- After the timer beeps, clean the outside of the test tube with a lint-free paper towel.
- Place the test tube into the instrument with the logo facing the front of the instrument.
- Place the cover over the test tube.
- Press read. The display will show the results in mg/L.
Nitrogen and phosphorus are essential plant nutrients found in aquatic ecosystems, however, in excess amounts, they can cause significant water quality problems. Nitrogen and phosphorous in water are typically found in the forms of nitrate and phosphate, respectively. Both nutrients are dissolved in water and are readily absorbed by photosynthesizers such as algae.
Nitrates and phosphates enter the water systems through freshwater runoff from wastewater treatment plants, fertilized lawns and agricultural lands, faulty septic systems, and industrial waste discharge. In excess amounts, both nutrients can cause an increase in aquatic plant growth and algae blooms, called eutrophication. These algae blooms live at the water surface, in order to easily access oxygen and sunlight.
As a result, eutrophication prevents lower water levels from access to sunlight and oxygen in the air. When the algae die, they sink into the lower water levels and decompose, consuming oxygen in the deeper water causing hypoxia, or low dissolved oxygen levels. Starved of oxygen, and cut off from resupply, the deep water becomes a dead zone. As a result, fish and other organisms die in massive numbers. Dead zones are widespread in the world's oceans and lakes, predominantly in highly populated urban areas.
This video will introduce the methodology for measuring nitrate and phosphate concentrations in surface water, and demonstrate the measurements in the laboratory.
Nitrogen in water is reported in terms of "nitrate-as-nitrogen." The phrase "nitrate-as-nitrogen" refers to the amount of nitrogen in nitrate form. Therefore, the nitrate-as-nitrogen concentration can be converted to nitrate concentration using the ratios of the molecular weights of nitrogen and nitrate.
The nitrate concentration is measured using the cadmium reduction method. The cadmium metal reduces the nitrates to nitrites, then the nitrite ions react with sulfanilic acid to form an intermediate diazonium salt. The diazonium salt then couples with gentisic acid, and forms an amber-colored compound. The darker the amber color, the higher the concentration of nitrate in the sample.
The concentration of phosphorus in water samples is reported similarly, in terms of the amount of phosphorus in phosphate form. The conversion between phosphate concentration and phosphate-as-phosphorus concentration can be easily completed using molecular weight. Phosphates are present in water in many different conformations. All phosphates must first be converted to orthophosphates through hydrolysis by heating samples with acid and potassium persulfate.
The ascorbic acid/molybdate method is used to calculate orthophosphate concentration. Orthophosphates react with sodium molybdate in acidic conditions to produce a phosphate/molybdate complex. Ascorbic acid is then used to reduce the complex, producing a blue colored product. To quantify the color intensity produced by the reagent in both experiments, a colorimeter is used to measure the amount of light absorbed by the colored species. The absorbance is then converted to concentration.
The following experiment will demonstrate the analysis of nitrate and phosphate concentrations in water samples using pre-mixed reagent packets to perform this colorimetric technique.
To begin the nitrogen measurement, find the program for nitrate on the colorimeter, and input the appropriate program number or set the colorimeter to measure at 420 nm. Measure 10 mL of the water sample, pipet into a sample tube, and label the tube. Prepare a second identical tube, and label it as the blank.
Add the contents of one premixed cadmium reduction method reagent packets to the sample tube. Cap both sample tubes. Begin timing the 1-min reaction period for the reagent. Shake the tube vigorously by hand until the reaction time is complete.
Set the tube down, and begin a second 5-min reaction period to allow for the cadmium to reduce nitrogen. When the reaction period is over, wipe both tubes clean with a lint-free paper towel.
Place the sample tube with no reagent, labeled the blank, in the colorimeter. Ensure that no labels interfere with the light path. Tightly cover the cell with the instrument cap to ensure that all ambient light is blocked from the sample chamber.
Calibrate the colorimeter with the blank for a reading of 0.0 mg/L nitrate as nitrogen. Remove the blank tube and place the sample tube in the sample holder, and replace the instrument cap. Measure the sample absorbance, and display the concentration of nitrate as nitrogen in the sample.
The measurement of phosphorus in a water sample is similar to the measurement of nitrogen. First, measure 5 mL of the water sample and pipet it into a sample tube. Add the contents of one pre-mixed potassium persulfate powder pillow for phosphonate to the sample tube.
Cap the tube tightly and shake to dissolve the powder. Label the top of the cap. Place the tube in the reactor in a hood, and heat for 30 min at 150 °C. After heating, remove the tube from the reactor, place it in a tube rack, and allow it to cool to room temperature.
Next, adjust the pH by adding 2 mL of 1.54 M sodium hydroxide to the sample tube. Cap the tube and mix. On the colorimeter, locate the program number for phosphate and enter the program number, or set the spectrophotometer to measure absorbance at 880 nm.
Clean the sample tube with a lint-free wipe, and load the test tube into the colorimeter. Make sure that no labels interfere with the light path in the instrument. Place the cover on the instrument, and calibrate using the unreacted sample as the blank.
Remove the tube from the instrument, and add the contents of a premixed ascorbic acid method reagent packet to the test tube. Cap the tube tightly, and shake the tube to mix. Place the tube in a rack, and initiate a 2-min reaction period using a timer.
After the reaction period is over the solution color should be blue. Clean the outside of the tube with a lint free paper towel. Place the test tube into the instrument with all labels out of the light path.
Close the sample chamber cover and push the READ button. The results will be shown in mg/L. If using a spectrophotometer, measure the sample absorbance at 880 nm.
The concentrations of nitrate and phosphate in a metropolitan river branch were compared at 5 different sample sites in this experiment.
Clean river water typically contains 0 to 1 mg/L of nitrate-nitrogen and 0 to 0.03 mg/L of phosphate-phosphorus. Concentrations between 3 to 5 mg/L of nitrate-nitrogen and 0.03 to 0.1 mg/L of phosphate-phosphorus is considered high, and above these ranges considered eutrophic.
The nitrate and phosphate levels were high in 3 of the 5 sampling locations. Similarly, average nitrate and phosphate concentrations were compared upstream and downstream of a water treatment plant. The upstream measurement represents untreated water, while the downstream measurement represents runoff from the treatment plant.
The downstream measurement was low in phosphates due to the removal of organic material during the treatment process. However, average nitrate concentrations were higher downstream, indicating possible nitrate inputs near the discharge area, possibly from lawn fertilizer.
Understanding the nutrient content of water runoff, and its resulting effect on marine plant life is extremely important to preserving our natural ecosystems.
In the following example, marine microorganisms were studied in remote environments such as reefs. These results can help elucidate changing microbial populations due to nitrate concentrations and the resulting algal blooms.
Water samples were collected in containers that are closed off to the external environment to prevent contamination. Microbes were collected on a 0.22-μm filter. The filtered water was analyzed to examine inorganic impurities. Metagenomic analysis found that the transfer of microbial genetic material was positively correlated with nitrate concentration.
In order to combat eutrophication, it is important to understand soil runoff and the fate and transport of contaminants in soil. In the following example, rainfall was simulated, and the fate of contaminants in soil studied. Soil boxes were packed with soil containing contaminants of interest, in this case urea, a common form of nitrogen fertilizer. Phosphorous-containing molecules can be studied with the same procedure. Rainfall was simulated under different conditions, and the runoff collected and analyzed.
Similar to the last example, runoff can also be studied outdoors in natural environments. Here, a runoff research facility was constructed in an urban area. A retaining wall was constructed to prevent runoff contamination to other areas, and to enable controlled water collection. Plot areas were separated as well, to prevent lateral water movement. Water runoff studies were conducted using irrigation systems. Water runoff was collected and a chemical analysis completed to determine contaminants in the water.
You've just watched JoVE's introduction to water nutrient analysis in surface water. You should now understand the challenges associated with water runoff and eutrophication, and how to measure nutrient content in water samples. Thanks for watching!
Subscription Required. Please recommend JoVE to your librarian.
Results

Figure 2. Graph comparing nitrates between different land use types (undeveloped, agricultural, and urban).
Average nitrate concentrations compared upstream and downstream from a water treatment plant (Figure 3). The downstream measurement represents the discharge from the treatment.

Figure 3. Average nitrate concentrations compared upstream and downstream from a water treatment plant. The downstream measurement represents the discharge from the treatment.

Figure 4. Graph of phosphorus for different locations along the Chicago River.
Average phosphate concentrations compared upstream and downstream from a water treatment plant (Figure 5). The downstream measurement represent the discharge from the treatment.

Figure 5. Average phosphate concentrations compared upstream and downstream from a water treatment plant. The downstream measurement represent the discharge from the treatment.
Subscription Required. Please recommend JoVE to your librarian.
Applications and Summary
High concentrations of nitrates and phosphorus can stimulate eutrophic conditions in water by causing algal bloom that negatively affects other water quality factors including dissolved oxygen, temperature, and other indicators. Excess nitrates can lead to hypoxic water (low levels of dissolved oxygen) no longer able to support aerobic life creating a “dead zone,” where non-mobile species mass die-offs and mobile species move away to other waters. Dead zones are occurring globally in coastal regions where large amounts of high-nutrient runoff and wastewater converge, and aquatic life is most highly concentrated (Figure 6). Two of the largest dead zones are in the Baltic Sea where on average 49,000 km2 of water contained less than 2 mg/L of dissolved oxygen, and the northern Gulf of Mexico with a dead zone measured at 17,353 km2.

Figure 6. Marine dead zones world-wide
Red circles show the location and size of many dead zones. Black dots show dead zones of unknown size. Darker blues in this image show higher concentrations of particulate organic matter, an indication of the overly fertile waters that can culminate in dead zones. The size and number of marine dead zones — areas where the deep water is so low in dissolved oxygen that sea creatures can’t survive — have grown explosively in the past half-century. It’s no coincidence that dead zones occur downriver of places where human population density is high (darkest brown).
Subscription Required. Please recommend JoVE to your librarian.