


Overview
Source: Tamara M. Powers, Department of Chemistry, Texas A&M University
This protocol serves as a guide in the synthesis of two metal complexes featuring the ligand 1,1'-bis(diphenylphosphino)ferrocene (dppf): M(dppf)Cl2, where M = Ni or Pd. While both of these transition metal complexes are 4-coordinate, they exhibit different geometries at the metal center. Using molecular orbital (MO) theory in conjunction with 1H NMR and Evans method, we will determine the geometry of these two compounds.
Principles
There are a variety of models that chemists use to describe bonding in molecules. It is important to remember that models are representations of systems and therefore have strengths but also important limitations. For example, Lewis dot structures, the simplest method for describing how atoms share electrons, do not take into account the geometry of the atoms in the molecule. Valence Shell Electron Pair Repulsion (VSEPR) theory does describe the geometry of atoms, but it does not provide an explanation for the observation that isoelectronic species with the same number of valence electrons can exhibit different geometries. Especially for transition metal complexes, both of these models fall short in describing the bonding of metals. Crystal field theory is a bonding model that is specific to transition metal complexes. This model looks at the effects of a ligand's electric field on the d or f atomic orbitals of a metal center. The interaction results in a break in degeneracy of those atomic orbitals.
In this video, we will focus on MO theory, which is a powerful model that can be used to describe bonding in not only main group molecules, but also is suitable for modeling the bonding in transition metal complexes. Here, we will demonstrate how to generate an MO diagram of metal-containing compounds.
MO Theory:
MO theory describes chemical bonding as the linear combination of the atomic orbitals (LCAO) of each atom in a given compound. The MOs that result from LCAOs describe both the geometry and energy of the electrons shared by a number of atoms in the molecule (i.e., the directionality and strength of the bonds formed by given atoms).
To review the basics of MO theory, first consider the diatomic molecule F2 (full MO diagram in Figure 1). A fluorine atom has 4 valence atomic orbitals: 2s, 2px, 2py, and 2pz. The 2s orbital is lower in energy than the 2p atomic orbitals, which all have the same energy. A linear combination of atomic orbitals will occur between atomic orbitals of similar energy and of matching symmetry. In this case, the 2s orbital on one F atom will interact with the 2s orbital on the other F atom. The addition of these two orbitals results in the formation of a σ bonding MO (Figure 1). Bonding is a stabilizing interaction and, therefore, the resulting σ MO is lower in energy relative to the energy of the 2s atomic orbitals. Subtracting the 2s orbitals results in an anti-bonding interaction (destabilizing), designated as σ*, which is higher in energy relative to the 2s atomic orbitals (Figure 1).

Figure 1. MO diagram of F2.
Likewise, the 2p atomic orbitals will combine to form bonding and anti-bonding interactions. Like the 2s atomic orbitals, the 2pz atomic orbitals (which lay along the F-F bond) form σ and σ* interactions. If we consider the 2px and 2py atomic orbitals, we see that they form different types of bonding and anti-bonding interactions, called π and π*, respectively (Figure 1). It is easy to differentiate between σ and π bonds because σ bonding orbitals are cylindrically symmetrical about the internuclear axis, while π orbitals have a nodal plane along the internuclear axis. The spatial overlap between atomic orbitals that form σ bonds is greater than the spatial overlap between atomic orbitals that form π bonds. Therefore, the resulting π and π* MOs are less stabilized and destabilized, respectively, compared to the σ and σ* MOs formed by the 2pz atomic orbitals. We can then fill the MOs with the valence electrons for the two F atoms.
Now consider a more complex molecule such as [Co(NH3)6]Cl3 (Figure 2). If we were to use the same process as above (considering the atomic orbital overlap between 2 atoms at a time), generating an MO diagram of this molecule would be extremely challenging. Instead, we can use group theory to first generate a symmetry adapted linear combination (SALC) of the ligands. We can then use symmetry to determine the bonding/anti-bonding interactions that form between the atomic orbitals on the metal and the resulting SALCs.

| Oh | E | 8C3 | 6C2 | 6C4 | 3C2’ | i | 6S4 | 8S6 | 3σh | 3σd | ||
| A1g | 1 | 1 | 1 | 1 | 1 | 1 | 1 | 1 | 1 | 1 | x2+y2+z2 | |
| A2g | 1 | 1 | -1 | -1 | 1 | 1 | -1 | 1 | 1 | -1 | ||
| Eg | 2 | -1 | 0 | 0 | 2 | 2 | 0 | -1 | 2 | 0 | (2z2-x2-y2, x2-y2) | |
| T1g | 3 | 0 | -1 | 1 | -1 | 3 | 1 | 0 | -1 | -1 | (Rx, Ry, Rz) | |
| T2g | 3 | 0 | 1 | -1 | -1 | 3 | -1 | 0 | -1 | 1 | (xz, yz, xy) | |
| A1u | 1 | 1 | 1 | 1 | 1 | -1 | -1 | -1 | -1 | -1 | ||
| A2u | 1 | 1 | -1 | -1 | 1 | -1 | 1 | -1 | -1 | 1 | ||
| Eu | 2 | -1 | 0 | 0 | 2 | -2 | 0 | 1 | -2 | 0 | ||
| T1u | 3 | 0 | -1 | 1 | -1 | -3 | -1 | 0 | 1 | 1 | (x, y, z) | |
| T2u | 3 | 0 | 1 | -1 | -1 | -3 | 1 | 0 | 1 | -1 | ||
| Γred | 6 | 0 | 0 | 2 | 2 | 0 | 0 | 0 | 4 | 4 |
Γred =A1g + Eg + T1u
Figure 2. Linear combination of ligand atomic orbitals of [Co(NH3)6]Cl3.
To generate the SALCs for [Co(NH3)6]3+, we follow a similar procedure outlined in the "Group Theory" video in the Inorganic Chemistry series:
1. Determine the point group of the molecule.
2. Generate a reducible representation of the ligand atomic orbitals.
3. Reduce the reducible representation to irreducible representations.
[Co(NH3)6]3+ is in the point group Oh. Since we are only concerned about the bonding at the metal center, we can simply consider the 2s atomic orbitals on each NH3 ligand. If we follow steps 1-3 for the N 2s, orbitals we find that the reducible representation is Γred = A1g + Eg + T1u (Figure 2). While the A1g set represents 1 SALC, the Eg and T1u sets actually represent 2 and 3 SALCs, respectively, giving a total of 6 SALCs (the same number of ligands in the cation [Co(NH3)6]3+). The 2 SALCs in the Eg set have the same symmetry and will result in degenerate MOs when they interact with the atomic orbitals of the Co (the same can be said about the 3 SALCs in the T1u set). Using the character table in Figure 2, we can determine how the atomic orbitals of Co transform in the Oh point group. For example, the dz2 and dx2–y2 orbitals form an Eg set. Since we have 2 ligand SALCs with Eg symmetry, those SALCs will form bonding/anti-bonding interactions with the dz2 and dx2–y2 Co atomic orbitals. Continuing in the same fashion for all of the valence atomic orbitals of Co, we generate an MO diagram for the transition metal complex, shown in Figure 3. Notice that the remaining d-orbitals (dxz, dyz, and dxy) transform as a set (T2g) but do not have an appropriate symmetry matched SALC. These atomic orbitals therefore become "non-bonding" MOs. In other words, they do not participate in bonding with the ligands in this transition metal complex.
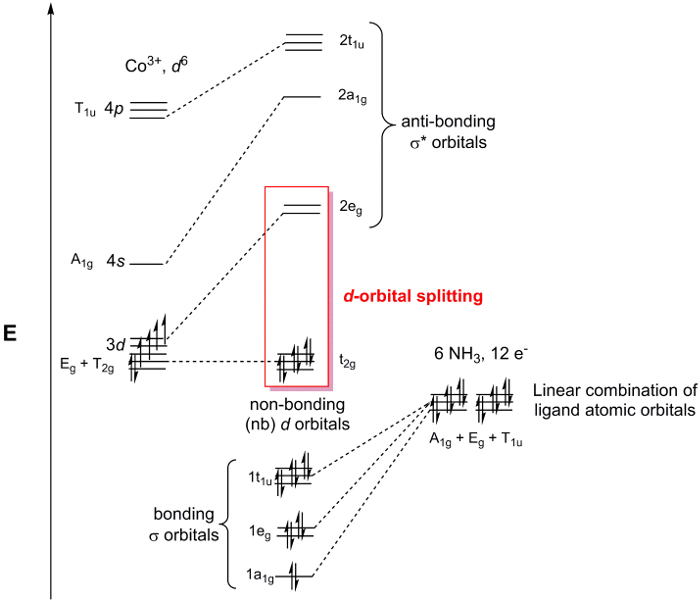
Figure 3. MO diagram for [Co(NH3)6]Cl3.
Highlighted in Figure 3 are the non-bonding d-orbitals and the σ* orbitals with d-orbital character. When this group of MOs is considered separately from the entire MO diagram it is referred to as the d-orbital splitting diagram of a transition metal complex. Since the d-orbital splitting diagram contains the HOMO and the LUMO, which are typically the most important orbitals to understand the chemistry and spectroscopy of coordination complexes, chemists will often refer to the d-orbital splitting diagram instead of the entire MO diagram. Conveniently, the d-orbital splitting diagram can be filled with the number of de- on the metal center, since the ligand-based electrons always fill the σ-based MOs in the MO diagram.
Considering the d-orbital Splitting Diagrams for M(dppf)Cl2:
Consider a simple 4-coordinate metal complex MX4. MX4 can exist in two geometries: tetrahedral or square planar. The d-orbital splitting diagrams for the point groups Td (tetrahedral) and D4h (square planar) is shown in Figure 4. While the general metal complexes M(dppf)Cl2 do not have 4 equivalent ligands, and therefore are not in the point groups Td or D4h, we can still use these d-orbital splitting diagrams as a model to describe the d-orbital MOs for the two possible geometries.

Figure 4. The d-orbital splitting diagrams for the point groups Td (tetrahedral) and D4h (square planar).
Now, consider the d-electron count for M(dppf)Cl2. Both Ni and Pd are in Group 10 of the periodic table. Therefore, they will both have the same oxidation state (2+) and d-electron count (d8). If we fill the two d-orbital splitting diagrams above with 8 electrons, we see that the square planar geometry results in a diamagnetic complex, while the tetrahedral MO diagram is consistent with a paramagnetic species. There are several factors that go into determining which geometry is energetically favored. In the square planar geometry, there are fewer electrons in anti-bonding orbitals, which would indicate that the square planar geometry is more electronically favored. However, we also need to consider the energy required to pair electrons. The electron pairing energy in square planar molecules is higher than that in tetrahedral molecules, which have fewer completely filled orbitals. Finally, we need to consider the amount the σ* d-orbitals are destabilized. Larger metal atoms have greater spatial overlap with ligands, resulting in higher energy σ* d-orbitals.
Finally, we also need to consider the energy contribution from steric repulsions. Tetrahedral geometry is more sterically favored (with angles of 109.5 °) compared to square planar geometry (90 °). Therefore, there are several opposing factors that affect which geometry is more favored, given the identity of M in M(dppf)Cl2.
We will be able to distinguish between these two geometries using NMR. If the molecule is square planar, we will observe a diagnostic 1H NMR of a diamagnetic species. If the molecule is tetrahedral, we will observe paramagnetic signals in the 1H NMR. Finally, we will use the Evans method (see the "Evans Method" video for more details) to determine the solution magnetic moment of the paramagnetic species.
Subscription Required. Please recommend JoVE to your librarian.
Procedure
NOTE: For safety precautions, the Schlenk line safety should be reviewed prior to conducting the experiments. Glassware should be inspected for star cracks before using. Care should be taken to ensure that O2 is not condensed in the Schlenk line trap if using liquid N2. At liquid N2 temperature, O2 condenses and is explosive in the presence of organic solvents. If it is suspected that O2 has been condensed or a blue liquid is observed in the cold trap, leave the trap cold under dynamic vacuum. Do NOT remove the liquid N2 trap or turn off the vacuum pump. Over time the liquid O2 will evaporate into the pump; it is only safe to remove the liquid N2 trap once all of the O2 has evaporated. For more information, see the "Synthesis of a Ti(III) Metallocene Using Schlenk line Technique" video.1
1. Setup of the Schlenk Line for the Synthesis of Ni(dppf)Cl2 and Pd(dppf)Cl2
NOTE: For a more detailed procedure, please review the "Schlenk Lines Transfer of Solvent" video in the Essentials of Organic Chemistry series).
- Close the pressure release valve.
- Turn on the N2 gas and the vacuum pump.
- As the Schlenk line vacuum reaches its minimum pressure, prepare the cold trap with either liquid N2 or dry ice/acetone.
- Assemble the cold trap.
2. Synthesis of Ni(dppf)Cl2 (Figure 5) under Anaerobic/Inert Conditions
Note While the synthesis of Ni(dppf)Cl2 can be conducted in aerobic conditions, higher yields are obtained when conducted in anaerobic conditions.
- Add 550 mg dppf (1 mmol) and 40 mL of isopropanol to a three-neck flask.
Note dppf can be purchased from Sigma Aldrich or synthesized using methods found in the literature.2 - Fit the center neck of the three-neck flask with a condenser and a vacuum adapter. Fit the two remaining necks with 1 glass stopper and 1 rubber septum.
- Degas the solution by bubbling N2 gas through the solvent for 15 min. Use the vacuum adapter at the top of the condenser as the "vent."
- Connect the vacuum adapter at the top of the condenser to N2 using the Schlenk line.
- Begin heating the three-neck flask in a water bath set to 90 °C.
- In a single neck round bottom flask, add 237 mg NiCl2·6H2O (1 mmol) to 4 mL of a 2:1 mixture of isopropanol (reagent grade) and methanol (reagent grade). Sonicate the resulting mixture until all of the Ni salt has dissolved (about 1 min).
NOTE: If a Sonicator is not available, gently heat the mixture in a water bath. - Degas the Ni solution by bubbling N2 gas through the mixture for 5 min.
- Add the NiCl2·6H2O solution to the three-neck round bottom flask via cannula transfer.
- Allow the reaction to reflux for 2 h at 90 °C.
- Allow the reaction to cool in an ice bath. Isolate the resulting green precipitate by vacuum filtration through a fritted funnel.
- Wash the product with 10 mL of cold isopropanol, followed by 10 mL of hexanes.
- Allow the product to air dry before preparing the NMR sample.
- Take a 1H NMR of the product in chloroform-d.
- If the 1H NMR is indicative of a paramagnetic species, prepare an NMR for the Evans method, following the instructions in step 4.

Figure 5. Synthesis of Ni(dppf)Cl2.
3. Synthesis of Pd(dppf)Cl2 (Figure 6)1
NOTE: Use standard Schlenk line techniques for the synthesis of Pd(dppf)Cl2 (see the "Synthesis of a Ti(III) Metallocene Using Schlenk line Technique" video).
Note While the synthesis of Pd(dppf)Cl2 can be conducted in aerobic conditions, higher yields are obtained when conducted in anaerobic conditions.
- Add 550 mg (1 mmol) dppf and 383 mg (1 mmol) bis(benzonitrile)palladium(II) chloride to a Schlenk flask and prepare the Schlenk flask for the cannula transfer of solvent.
- Add 20 mL of degassed toluene to the Schlenk flask via cannula transfer.
- Allow the reaction to stir for at least 12 h at room temperature.
- Isolate the resulting orange precipitate by vacuum filtration through a fritted funnel.
- Wash the product with toluene (10 mL), followed by hexanes (10 mL).
- Allow the product to air dry before preparing the NMR sample.
- Take a 1H NMR of the product in chloroform-d.
- If the 1H NMR is indicative of a paramagnetic species, prepare an NMR for the Evans method following the instructions outlined in step 4.

Figure 6. Synthesis of Pd(dppf)Cl2.
4. Preparation of the Evans Method Sample
NOTE: For a more detailed procedure, please refer to the "Evans method" video.
- In a scintillation vial, prepare a 50:1 (volume:volume) solution of chloroform-d:trifluorotoluene. Pipette 2 mL of deuterated solvent, and to this add 40 µL of trifluorotoluene. Cap the vial.
NOTE: In this example, we will be using 19F NMR to observe the shift of the F signal in trifluorotoluene in the presence of the paramagnetic species. - With this solution, prepare the capillary insert.
- Weigh 10-15 mg of the paramagnetic sample into a new scintillation vial and note the mass.
- Pipette ~ 600 µL of the prepared solvent mixture into the vial containing the paramagnetic species. Note the mass. Make sure that the solid completely dissolves.
- In a standard NMR tube, carefully drop the capillary insert at an angle, to ensure it does not break.
- Pipette the solution containing the paramagnetic species into the NMR tube.
- Acquire and save a standard 19F NMR spectrum.
- Note the temperature of the probe.
- Note the radiofrequency.
Molecular orbital theory is a flexible model for describing electron behavior in main group and transition metal complexes.
Chemical bonds and electronic behavior can be represented with several types of models. While simple models, such as Lewis dot structures and VSEPR theory, provide a good starting point for understanding molecular reactivity, they involve broad assumptions about electronic behavior that are not always applicable.
MO theory models the geometry and relative energies of orbitals around a given atom. Thus, this theory is compatible with both simple diatomic molecules and large transition metal complexes.
This video will discuss the underlying principles of MO theory, illustrate the procedure for synthesizing and determining the geometry of two transition metal complexes, and introduce a few applications of MO theory in chemistry.
In MO theory, two atomic orbitals with matching symmetry and similar energies can become a lower-energy bonding molecular orbital and a higher-energy antibonding molecular orbital. The number of molecular orbitals in a diagram must equal the number of atomic orbitals.
The difference in energy between atomic orbitals and the resulting bonding and antibonding orbitals is approximated from simple diagrams of orbital overlap. Head-on interactions are generally stronger than side-on overlap.
MO diagrams use group theory to model transition metal complexes. Ligand atomic orbitals are represented by symmetry-adapted linear combinations, or short SALC, that can interact with the metal atomic orbitals.
SALCs are generated by determining the point group of the molecule, creating a reducible representation of the ligand atomic orbitals, and finding the irreducible representations corresponding to the orbital symmetries.
MOs are formed between SALCs and atomic orbitals with matching symmetry. Atomic orbitals that do not match the SALC symmetries become nonbonding orbitals at the same energy as the starting atomic orbitals.
When the MO diagram is populated with electrons, the frontier orbitals are generally those with d orbital character. These orbitals can be considered separately as d orbital splitting diagrams, and they will always be populated with the number of d electrons on the metal center.
Now that you understand the principles of MO theory, let's go through a procedure for synthesizing two metal complexes and predicting their geometries using MO theory.
To begin the procedure, close the Schlenk line vent and open the system to N2 gas and vacuum. Once the dynamic vacuum is reached, cool the vacuum trap with a mixture of dry ice and acetone.
Next, place 550 mg of dppf and 40 mL of isopropanol in a 250 mL three-neck round-bottom flask with a stir bar. Securely clamp the flask in the fume hood with the Schlenk line over a hotplate. Fit the center neck of the flask with a reflux condenser and a vacuum adaptor. Fit the remaining necks with a glass stopper and a rubber septum.
Under stirring, degas the solution by bubbling N2 gas through the solution for 15 minutes. Leave the vacuum adapter open as a vent.
Once the solution has been degassed, open a new nitrogen line and connect it to the vacuum adapter. Lower the flask into the water bath. Connect a water hose to the condenser, turn on the stir motor, and start heating the bath to 90 °C while stirring the solution.
While the dppf solution heats, place 237 mg of NiCl2•6H2O and 4 mL of a 2:1 mixture of reagent-grade isopropanol and methanol in a 25 mL round-bottom flask.
Sonicate the mixture until the Ni salt has completely dissolved. Then, stopper the flask with a rubber septum and securely clamp the flask in the fume hood.
Degas the Ni solution by bubbling N2 gas through the solution for 5 minutes. Then, use cannula transfer to add the Ni precursor to the dppf solution.
Reflux the mixture for 2 hours at 90 °C under N2 gas. Then, cool the reaction mixture in an ice bath.
Collect the resulting green precipitate on a medium type frit by vacuum filtration. Wash the precipitate with 10 mL of cold isopropanol, followed by 10 mL of cold hexanes.
Allow the product to air-dry in a vial and acquire a 1H NMR spectrum in CDCl3.
To begin the procedure, prepare the Schlenk line and vacuum trap as previously described. Using a 125 mL round bottom flask, degas 20 mL of toluene by bubbling N2 gas through the solvent. Then, place 550 mg of dppf and 383 mg of Pd(PhCN)2Cl2 in a 200 mL Schlenk flask.
Equip the flask with a stir bar and a glass stopper. Evacuate and purge the system three times using N2. Keeping the N2 on, replace the glass stopper with a rubber septum.
Use cannula transfer to add the degassed toluene to the reactants. Stir the reaction mixture at room temperature for 12 hours.
Collect the resulting orange precipitate on a frit by vacuum filtration. Wash the precipitate with 10 mL of cold toluene, followed by 10 mL of cold hexanes.
Allow the product to air-dry in ambient conditions. Acquire a 1H NMR spectrum of the product in CDCl3.
The 1H NMR spectrum of the Ni complex shows a peak at 21 ppm, followed by two peaks below 0 ppm, suggesting that it is a paramagnetic species. The Pd complex does not show any such peaks. Given that the complexes are both d8, the different electronic states likely result from different geometries at the metal center.
Four-coordinate complexes are approximated with either tetrahedral or square planar d orbital splitting patterns. When eight electrons are placed in the four-coordinate diagrams, the tetrahedral configuration has two unpaired electrons, while the square planar configuration has no unpaired electrons. This indicates that the Pd complex is square planar.
To determine the number of unpaired electrons in the Ni complex, prepare an Evans' method sample with 10 to 15 mg of the product in a 50:1 by volume mixture of deuterated chloroform and trifluorotoluene.
Place a capillary of 50:1 deuterated chloroform and trifluorotoluene in the NMR tube. Acquire an 19F NMR spectrum and calculate the magnetic moment from the change in the chemical shift of trifluorotoluene.
The observed magnetic moment is close to the reported value of 3.39 μB. As some orbital contribution is predicted in d8 tetrahedral complexes, the observed magnetic moment is expected to be higher than the spin-only value. The observed value is thus consistent with two unpaired electrons in a tetrahedral complex.
MO theory is widely used in inorganic chemistry. Let's look at a few examples.
Computational chemistry applies statistical modeling to predict the properties and reactivity of molecules. Semi-empirical and ab initio computational methods both incorporate MO theory into their calculations to varying extents. The output is often in the form of orbital energies and 3D models of each molecular orbital.
Ligand field theory is a more detailed molecular model that combines crystal field theory and MO theory to refine the d orbital splitting diagram, along with other aspects of the models.
In crystal field theory, degeneracy at a metal center is affected to varying degrees by the ligands and the metal center properties. The stability of the complex is estimated with the crystal field stabilization energy, which compares the stabilizing and destabilizing effects of electrons populating lower- and higher-energy orbitals.
Ligand field theory can provide more insight into orbital splitting by examining the nature of the orbital overlap between metal centers and ligands. The orbital overlap symmetry is considered together with the stabilizing and destabilizing effects of the orbital populations. This is used to predict spin states, the strength of metal-ligand interactions, and other important molecular properties.
You've just watched JoVE's introduction to MO theory. You should now understand the underlying principles of MO theory, the procedure for determining the geometry of a complex from d-orbital splitting diagrams, and a few examples of how MO theory is applied in chemistry. Thanks for watching!
Subscription Required. Please recommend JoVE to your librarian.
Results
Pd(dppf)Cl2:
1H NMR (chloroform-d, 400 MHz, δ, ppm): 4.22 (alpha-H), 4.42 (beta-H), 7.89, 7.44, 7.54 (aromatic)3.
Ni(dppf)Cl2:
1H NMR (chloroform-d, 300 MHz, δ, ppm): 20.85, 10.04, 4.23, 3.98, 1.52, -3.31, -7.10.
Evans Method, looking at the 19F shift of trifluorotoluene:

Observed µeff = 3.15 µb
Mass of the sample: 9.5 mg
Mass of solution (chloroform-d + trifluorotoluene): 0.8365 g
Temperature of probe: 296.3 K
NMR Field (MHz): 470.06
Reported µeff = 3.39 µb.4
For S = 1 (predicted based on tetrahedral geometry, Figure 4), theoretical µeff = 2.83 µb.
For S = 3/2, theoretical µeff = 3.46 µb.
Based on the 1H NMR data, we see that Pd(dppf)Cl2 is diamagnetic and therefore exhibits square planar geometry. The 1H NMR of Ni(dppf)Cl2 is paramagnetic and therefore is tetrahedral at the Ni center. Evan’s method confirms that Ni(dppf)Cl2 is paramagnetic, exhibiting a solution magnetic moment of 3.15 µb, which is close to the literature reported value for this compound. Since Ni is small, the sterics outweighs any electronic stabilization associated with square planar geometry, making Ni(dppf)Cl2 tetrahedral. On the other hand, Pd is large and, therefore, has higher energy σ* d-orbitals. In this case, the electronic stabilization greatly outweighs the steric repulsions, resulting in a square planar geometry at Pd in Pd(dppf)Cl2.
Subscription Required. Please recommend JoVE to your librarian.
Applications and Summary
This video demonstrated how MO theory can be used as a model of bonding in transition metal complexes. We synthesized two complexes with the general formula M(dppf)Cl2. When M = Ni, the 4-coordinate complex exhibits a tetrahedral geometry. Replacing the Ni atom with a larger transition metal (Pd), the molecule takes on square planar geometry.
Previously, we learned about the important role ferrocene plays in the field of organometallic chemistry. Substituted ferrocenes, including dppf, are used as chelating ligands for 1st, 2nd, and 3rd row transition metals. The resulting complexes are used in homogeneous catalysis (i.e., [1,1'-bis(diphenylphosphino)ferrocene]palladium(II) dichloride, Pd(dppf)Cl2, is a catalyst for C-C and C-heteroatom bond-forming reactions).
Understanding the bonding in transition metal complexes is important for explaining their structure and reactivity. One of the strengths of MO theory is that it provides a good model that can be used to explain the reactivity of transition metal complexes. In many cases, the metal center is the location of any reactivity exhibited by the molecule. Therefore, it is valuable to have a picture of the electron density at the metal center, which is summarized in the d-orbital splitting diagram derived from MO theory (Figure 3). Notice that not only do the MOs in the d-orbital splitting diagram exhibit mostly d-orbital character (the σ* orbitals are closest in energy to the atomic d-orbitals of the metal and therefore most of the electron density in those MOs is centered on the metal atom), but also the splitting diagram contains the HOMO and LUMO of the molecule. Therefore, any chemistry that occurs will directly affect the d-orbital splitting diagram of the molecule.
Subscription Required. Please recommend JoVE to your librarian.
References
- Corain, B., Longato, B., Favero, G. Heteropolymetallic Complexes of 1,1’-Bis(diphenylphosphino)ferrocene (dppf). III*. Comparative Physicochemical Properties of (dppf)MCl2 (M = Co, Ni, Pd, Pt, Zn, Cd, Hg). Inorg Chim Acta. 157, 259-266 (1989).
- Cullen, W. R., Einstein, F. W. B., Jones, T., Kim, T.-J. Structures of three hydrogenation catalysts [(P-P)Rh(NBD)]ClO4 and some comparative rate studies where (P-P) = (η5-R1R2PC5H4)(η5-R3R4PC5H4)Fe (R1 = R2 = R3 = R4 = Ph, R1 = R2 = Ph, R3 = R4 = CMe3, R1 = R3 = Ph, R2 = R4 = CMe3). Organometallics. 4(2), 346-351 (1983).
- Colacot, T. J., C.-Olivares, R., H.-Ortega, S. Synthesis, X-ray, spectroscopic and a preliminary Suzuki coupling screening studies of a complete series of dppfMX2 (M = Pt, Pd, X = Cl, Br, I). J Organomet Chem. 637-639, 691-697 (2001).
- Rudie, A. W., Lichtenberg, D. W., Katcher, M. L., Davison, A. Comparative Study of 1,1’-bis(diphenylphosphino)cobaltocinium hexafluorophosphate and 1,1’-bis(dipenylphosphino)ferrocene as Bidentate Ligands. Inorg Chem. 17(10), 2859-2863, 1978.