This protocol describes the production of a mouse extrahepatic bile duct 3-dimensional organoid system. These biliary organoids can be maintained in culture to study cholangiocyte biology. Biliary organoids express markers of both progenitor and biliary cells and are composed of polarized epithelial cells.
Method Article
Generation of Organoids from Mouse Extrahepatic Bile Ducts
In This Article
Summary
Abstract
Cholangiopathies, which affect extrahepatic bile ducts (EHBDs), include biliary atresia, primary sclerosing cholangitis, and cholangiocarcinoma. They have no effective therapeutic options. Tools to study EHBD are very limited. Our purpose was to develop an organ-specific, versatile, adult stem cell-derived, preclinical cholangiocyte model that can be easily generated from wild type and genetically engineered mice. Thus, we report on the novel technique of developing an EHBD organoid (EHBDO) culture system from adult mouse EHBDs. The model is cost-efficient, able to be readily analyzed, and has multiple downstream applications. Specifically, we describe the methodology of mouse EHBD isolation and single cell dissociation, organoid culture initiation, propagation, and long-term maintenance and storage. This manuscript also describes EHBDO processing for immunohistochemistry, fluorescent microscopy, and mRNA abundance quantitation by real-time quantitative reverse transcription polymerase chain reaction (qRT-PCR). This protocol has significant advantages in addition to producing EHBD-specific organoids. The use of a conditioned medium from L-WRN cells significantly reduces the cost of this model. The use of mouse EHBDs provides almost unlimited tissue for culture generation, unlike human tissue. Generated mouse EHBDOs contain a pure population of epithelial cells with markers of endodermal progenitor and differentiated biliary cells. Cultured organoids maintain homogenous morphology through multiple passages and can be recovered after a long-term storage period in liquid nitrogen. The model allows for the study of biliary progenitor cell proliferation, can be manipulated pharmacologically, and may be generated from genetically engineered mice. Future studies are needed to optimize culture conditions in order to increase plating efficiency, evaluate functional cell maturity, and direct cell differentiation. Development of co-culture models and a more biologically neutral extracellular matrix are also desirable.
Introduction
Cholangiopathies are incurable chronic progressive disorders that affect biliary cells located in intra- and extrahepatic biliary ducts (EHBDs)1. Some cholangiopathies, like primary sclerosing cholangitis, cholangiocarcinoma, biliary atresia, and choledochal cysts, predominantly affect EHBDs. Development of therapies for cholangiopathies is restricted by the limited availability of preclinical models. In addition, previous studies focused on cholangiopathies grouped together: liver, intra-, and EHBDs. However, intra- and EHBDs have a distinct embryonic origin and, thus, should be considered as distinct molecular pathologies. Intrahepatic bile ducts develop from the intrahepatic ductal plates and the cranial part of hepatic diverticulum, whole EHBDs develop from the caudal part of the hepatic diverticulum2. They also rely on different progenitor cell compartments for adult homeostasis, including canals of Hering in intrahepatic bile ducts and peribiliary glands in EHBDs2,3. Use of animal models for preclinical studies is limited by expense and should be minimized for ethical reasons. Therefore, reductionist, reproducible, time and cost-efficient in vitro models are highly desirable.
Most prior studies of cholangiopathies utilized normal mouse or rat cancer models, or human cholangiocarcinoma cell lines derived from intra- and EHBDs4,5,6,7. However, these are models of transformed cells and do not recapitulate normal cholangiocyte biology at homeostasis or in a healthy state. Recent progress in the development of organotypic culture models has allowed the development of 3-dimensional structures from different tissue types, including hepatobiliary tissues, although not normal mouse EHBDs8,9,10. These "organ-like" structures aimed at mimicking primary tissue and are grown in an artificial niche supporting self-renewal of organ-specific stem/progenitor cells11.
"Organoid" is a broad term that most commonly describes 3-dimensional tissue models derived from stem cells. Organoids can be generated from reprogrammed pluripotent stem cells represented by embryonic stem cells and induced pluripotent stem cells. They also can be generated from organ-specific adult stem cells12. Some cholangiocyte organoid models have been proposed in previous research studies. Thus, organoids derived from human pluripotent stem cells have been reported7,9,13 and provide a valuable, time efficient tool that allows for the simultaneous generation of different cell types. However, these pluripotent stem cell-derived organoids do not fully reflect the structure and functionality of primary adult EHBD cholangiocytes.
Organoids derived from adult stem cells of the human9 and feline10 liver were also proposed. Feline models are not widely available and have limited tool armamentarium for study purposes. Moreover, these liver-derived adult stem cell-derived organoids do not model extrahepatic cholangiocytes but rather intrahepatic cholangiocytes.
EHBD organoid generation was reported from human normal EHBDs14 and mouse EHBD cholangiocarcinoma15. However, access to human EHBD tissue is extremely limited, and organoids derived from a genetic murine model of cholangiocarcinoma15 do not represent healthy cholangiocyte biology at homeostasis and are derived from genetically-modified cells.
To address the limitations of pluripotent stem cell- and liver-derived cholangiocyte organoid models and the limited access to human tissues needed in preclinical models, we developed a murine EHBD organoid model (Figure 1A). This manuscript describes the development of a technique for mouse EHBD-derived organoids from adult tissue. These EHBD organoids named EHBDOs will be an important in vitro tool for the study of mechanisms underlying EHBDs cholangiocyte homeostasis and disease processes, such as cholangiopathies.
Protocol
All methods described here have been approved by the Institutional Animal Care and Use Committee (IACUC) of The University of Michigan.
1. Preparation of Equipment and Materials for Mouse EHBD Isolation
- Prepare seeding medium and washing buffer (Table of Materials) in 50 mL conical tubes and keep them at 4 °C or on ice until use.
- Set up a surgical table (Figure 1B). Prepare sterilized surgical instruments (Figure 1C).
- Place a sterile 24-well plate in the 37 °C tissue culture incubator to pre-warm it.
- Place an aliquot of basement matrix on ice. Use basement matrix only when it is completely liquefied.
2. EHBD Isolation and Biliary Organoid Culture
- Isolation and preparation of a single cell suspension of mouse EHBD
- Euthanize an adult mouse (older than 2 months) according to the institutional guidelines. Place the mouse in a supine position. Open the abdominal cavity using a midline approach and retract the liver to rest on the diaphragm.
- Identify the common bile duct located immediately below the liver hilum by gently pulling the proximal duodenum with a hemostat. Separate EHBD from the surrounding tissues using a scalpel blade. Holding the proximal end of the common bile duct with forceps, dissect it distally just above its juncture with the duodenum, then dissect the proximal end of the duct from the liver (Figure 1D). Immediately place isolated EHBD (Figure 1E) into cold washing buffer.
- Remove the EHBD from the washing buffer and mince into 0.5 mm sections using a sterile scalpel blade. Place the tissue on a glass plate on ice during the procedure (Figure 1B).
- Place the EHBD sections into a tube containing 500 µL of the dissociation buffer. Incubate for 20 min at 37 °C. Neutralize the dissociation buffer by adding 500 µL of ice-cold cell culture medium.
- Triturate the cell suspension up and down progressing through 18 G and 20 G needles, 20 times each. Filter the cell suspension through a 70 µm cell strainer and collect the flow-through in a 50 mL tube.
NOTE: Pre-condition the strainer with 500 µL of sterile phosphate-buffered saline (PBS) prior to filtering to facilitate the passage of the cell suspension.
- Establishing EHBD organoids
- Centrifuge the flow-through from step 2.1.5 at 300 x g for 5 min at 4 °C.
- Carefully remove the supernatant. Resuspend the cells in 1 mL of ice-cold sterile PBS. Transfer the resuspension into a new 1.5 mL tube. Repeat step 2.2.1.
- After centrifugation, carefully remove the supernatant from washed cells collected at the tube bottom. Resuspend the cell pellet in 120 µL of liquefied ice-cold basement matrix by pipetting up and down using P200 tips.
NOTE: Cell pellet resuspension in basement matrix has to be performed on ice-bath. - Plate 40 µL of the cell resuspension in basement matrix into the center of a well in a pre-warmed 24-well plate.
NOTE: Avoid suctioning air while manipulating basement matrix to prevent bubble formation. - Return the plate with cells resuspended in basement matrix to the 37 °C tissue culture incubator for 15 min or until basement matrix is solidified. Add 600 µL of the seeding medium warmed up to 37 °C to each well (Table of Materials). Return the plate to the 37 °C tissue culture incubator.
- Replace the seeding medium with 600 µL of the fresh organoid culture medium in 3 days and every 3 days thereafter. Monitor organoid growth with an inverted microscope. Use organoids for a downstream application or split every 7 to 9 days before accumulation of intraluminal debris and organoid collapse are observed (Figure 2A).
3. EHBD Organoid Passage and Storage
- Passage of EHBD organoids 1:3 to 1:4 every 7 to 9 days
- Remove the medium from the well and add 400 µL of ice-cold PBS. Resuspend the organoids by gently pipetting the mixture up and down 10 times in the well. Transfer the mixture to a 1.5 mL tube.
- Passage the mixture through a 25 G needle 4 times to dissociate the organoids. Centrifuge the mixture at 400 x g for 4 min at 4 °C.
- Carefully remove the supernatant and resuspend the cells in basement matrix (1:3 to 1:4) for further culturing (step 2.2.4.) or wash the cells with ice cold PBS for further processing.
NOTE: Typically, 250-300 cells are plated into the 24-well plate for downstream applications. Plating efficiency can be evaluated by bright field microscopy using an inverted microscope on day 3-5 after passaging by counting the number of organoids and calculating their percent from initial cell number. mRNA can be isolated from EHBDOs washed in PBS using the standard protocol using guanidinium thiocyanate-phenol-chloroform extraction.
- Long-term storage of EHBD organoids
- Remove the medium from the well and wash the organoids with room temperature PBS. Remove PBS from the well without disturbing the basement matrix drop.
- Add 500 µL of ice-cold cell freezing medium to the well. Gently resuspend the organoids in liquefied basement matrix and cell freezing medium and transfer the mixture into cryogenic vials.
- Store the vials at -80 °C for 48 h. Transfer the vials to a nitrogen tank for long-term storage in a vapor phase.
4. EHBD Organoid Pprocessing for Paraffin Embedding
- Resuspend the EHBDOs in 500 µL of ice-cold PBS (4 °C) by pipetting up and down 5 to 10 times. Collect resuspended EHBDO in liquefied basement matrix in a 1.5 mL tube.
NOTE: To avoid breaking organoids, cut off the bottom 2-3 mm of a P1000 tip and remove the supernatant very carefully. - Centrifuge EHBD organoids at 350 x g for 5 min. Carefully remove the supernatant without disturbing the organoid pellet.
- Add 1 mL of ice-cold 4% paraformaldehyde (PFA) to the organoids and incubate the organoids in 4% PFA overnight at 4°C. Remove 4% PFA from the organoids using a P1000 tip after overnight incubation.
- Add 1000 µL of room temperature PBS to the tube with the organoids and incubate for 5 min at room temperature (RT). Centrifuge the tube with organoids in PBS at 350 x g for 5 min. Repeat this process two more times.
- Remove PBS and add 1 mL of 30% ethanol to the organoids. Incubate for 5 min at RT.
- Centrifuge the tube at 350 x g for 5 min at RT. Remove 30% ethanol. Add 1 mL of 70% ethanol and incubate for 5 min at RT.
- Centrifugate at 350 x g for 5 min. Remove 70% ethanol. Add 1 mL of 100% ethanol and incubate for 5 min at RT.
NOTE: Organoids can be kept in 100% ethanol at room temperature for up to 48 h before further processing. - Heat specimen processing gel in a microwave for 20 s or until liquefied. Add 50 µL of specimen processing gel into the tube with organoids. Place the tube on ice until the specimen processing gel is solidified.
- Remove the drop of specimen processing gel with organoids from the tube and place between the blue sponge pads in a cassette for further processing in the tissue processor. Use 15 min for each step in the paraffin embedder during further processing..
- Section paraffin-embedded organoids in specimen processing gel at 4 µm. Proceed with immunohistochemical staining as previously described16.
Results
Our protocol describes the generation of mouse EHBD organoids that are tissue-specific and adult stem cell-derived. After the organoids are cultured, a cystic structure formation can be observed as early as 1 day after the EHBD isolation. Contamination with fibroblasts is not typically observed during culture generation. EHBDO plating efficiency is approximately 2% when isolated from either neonatal or adult (older than 2 months) mice (Figure 2B). Plating efficiency of EHBD organoids derived from adult mice increases to 11% in passage 2 and remains stable (Figure 2B). The majority of organoids demonstrate cystic morphology through all passages, with rare "irregular" organoids (Figure 2C-E). Organoids reach a growth peak at 5-7 days after which they start accumulating intraluminal debris and deteriorate (Figure 2A). Therefore, for maintenance of organoid culture, they should be split every 7-10 days (Figure 2A). Once established and when appropriately handled, organoids can be maintained in culture almost indefinitely (cultures were observed up to 14 months). To avoid culture contamination with differentiated cells carried over from initial cell isolation, use organoids passaged at least twice prior to using them for a downstream application. For long-term storage, use earlier passage (up to passage 7) organoids, since they have higher plating efficiency after recovery from storage.
When analyzed with immunofluorescence, EHBDOs consist of a pure population of epithelial cells marked by E-cadherin (Figure 3A-C). Organoid cells demonstrate markers of biliary progenitor cells (Pancreatic and Duodenal Homeobox 1 (PDX1); Figure 3A) as well as markers of biliary differentiation (cytokeratin 19 (CK19) and Sex-Determining Region Y-Box 9 (SOX9); Figure 3B, C). Importantly, a high percentage of organoid cells possess a primary cilium marked by acetylated α-tubulin (a-AT; Figure 3D), which is a feature of normal cholangiocytes, and suggests appropriate organoid cell polarization. The expression of markers of progenitor (Pdx1) and biliary differentiated cells [Ck19, Sox9, Aquaporin 1 (Aqp1), Cystic Fibrosis Transmembrane Conductance Regulator(Cftr)] can be also confirmed by real-time quantitative reverse transcription polymerase chain reaction (qRT-PCR) (Table 1). Combination of these markers is characteristic for cholangiocytes in EHBDs14,17,18.
In summary, this protocol describes the generation of an organoid culture model of polarized biliary epithelial cells expressing progenitor and differentiated markers. This system can be maintained in culture for a prolonged time without changes in morphology, stored long-term, and analyzed with immunohistochemistry and qRT-PCR.
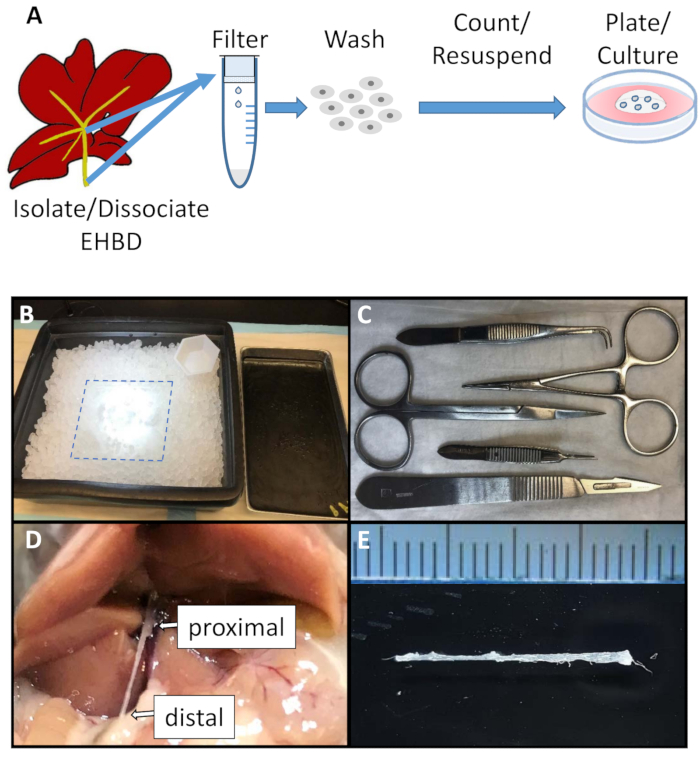
Figure 1: Schematic of the EHBD organoid culture generation and surgical set up. (A). Schematic of EHBD organoid generation. (B). Surgical area was set up for EHBD isolation and included a glass plate (dotted line) kept on an ice tray at all times. (C). Sterile surgical equipment included sharp scissors, straight and curved serrated tweezers, hemostat, and scalpel. (D and E) EHBD is isolated from surrounding connective and pancreatic tissue followed by careful dissection proximally from the intrahepatic bile ducts and liver (D, arrow), and distally from the duodenum (D, arrow). Ruler marks = 1 mm. Please click here to view a larger version of this figure.
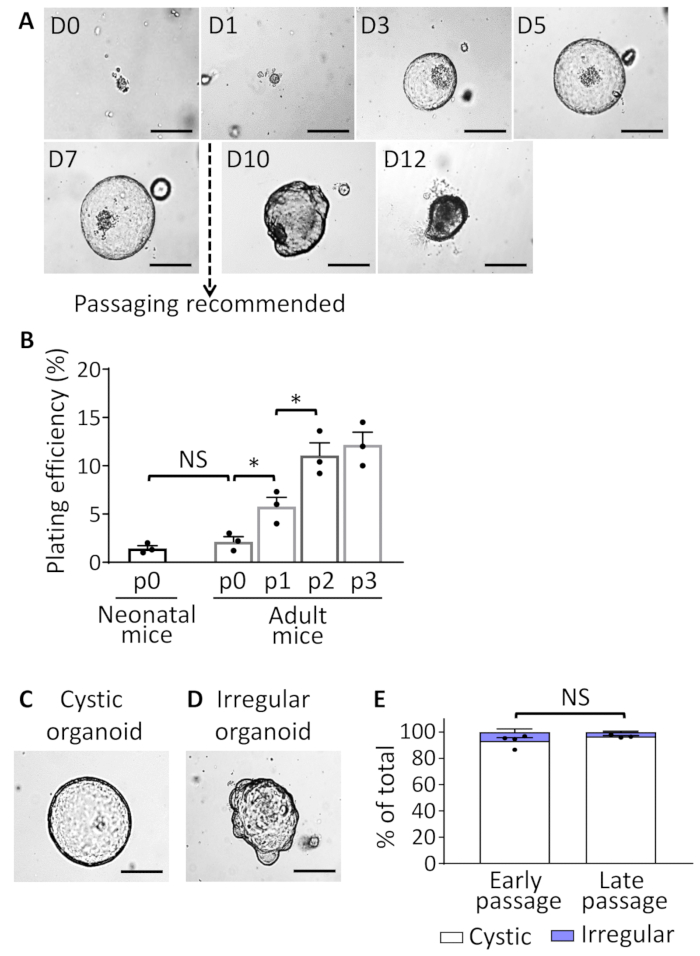
Figure 2: EHBDO culture. (A). Microscopic images of EHBDOs over a 12-day course. (B). Plating efficiency of organoids derived from the neonatal (2 mice per culture, n = 3 cultures) and adult (>2 months old, 1 mouse per culture, n = 3 cultures) mice after plating 300 cells per well in 24-well plate and enumerating established organoids on day 5 of culture. (C and D) EHBDO cystic versus irregular morphology was analyzed by microscopy. (E). The percent of cystic and irregular shaped organoids was analyzed in early (<10) and late (≥10) organoid passages. Scale bars = 500 µm. Quantitative data showed as mean +/- standard error of the mean (SEM), t-test. NS = not significant. Please click here to view a larger version of this figure.
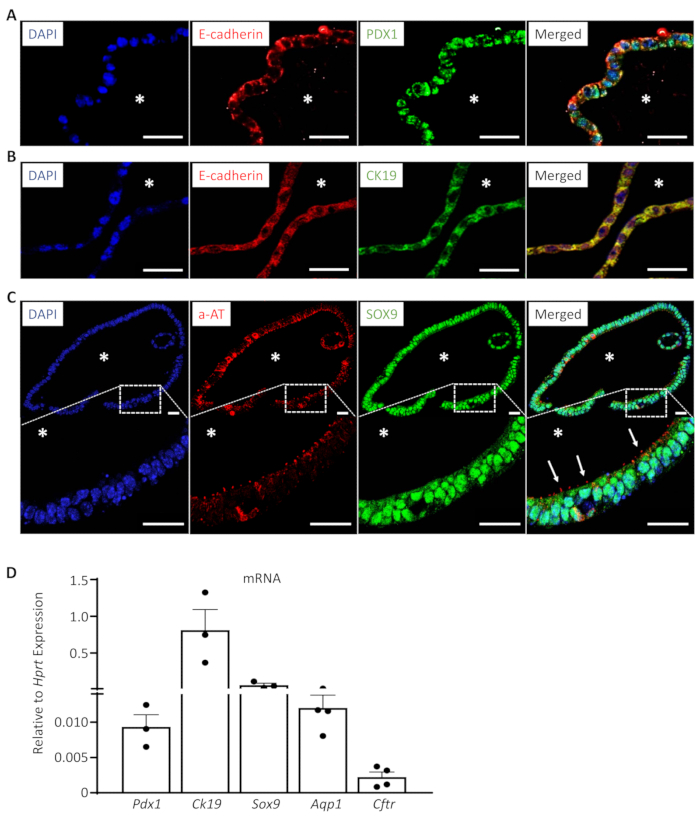
Figure 3: EHBDOs express markers of progenitor and mature biliary cells. (A-C). EHBDOs were analyzed by immunofluorescence staining for markers epithelial (A, B. E-cadherin, red), progenitor (A. PDX1, green), and differentiated (B. CK19, green; and C. a-AT, red) biliary cells. Scale bars = 25 µm. *, lumen. (D). EHBDOs were analyzed for abundance of Pdx1, Ck19, Sox9, Aqp1, and Cftr mRNA by qRT-PCR (mean +/- SEM relative to expression of Hprt). Please click here to view a larger version of this figure.
| Gene | Accession number | Primer sequence | Product size | ||
| Hprt | NM_013556 | Forward 5’-AACTTGCGCTCATCTTAGGCTTTG-3’ | 173 bp | ||
| Reverse 5’-AGGACCTCTCGAAGTGTTGGATAC-3’ | |||||
| Pdx1 | NM_008814 | Forward 5'-GAATTCCTTCTCCAGCTCCA-3' | 133 bp | ||
| Reverse 5'-GATGAAATCCACCAAAGCTCA-3' | |||||
| Sox9 | NM_011448 | Forward 5’-TCCACGAAGGGTCTCTTCTC-3’ | 107 bp | ||
| Reverse 5’-AGGAAGCTGGCAGACCAGTA-3’ | |||||
| Ck19 | NM_008471 | Forward 5’-TCTGAAGTCATCTGCAGCCA-3’ | 133 bp | ||
| Reverse 5’-ACCCTCCCGAGATTACAACC-3’ | |||||
| Aqp1 | NM_007472 | Forward 5’-CAGTACCAGCTGCAGAGTGC-3’ | 112 bp | ||
| Reverse 5’-CATCACCTCCTCCCTAGTCG-3’ | |||||
Table 1: Primers.
Discussion
This work describes the generation of an organotypic 3-dimensional model of mouse EHBD cholangiocytes. Important steps in EHBDO culture generation include meticulous EHBD dissection to avoid pancreas cell contamination, maintenance of sterile conditions to prevent bacterial and fungal contamination, and careful manipulation after centrifugation to avoid the loss of cellular material. A close adherence to described temperature conditions is required. There are some limitations to the technique. EHBDs of adult mice are small (about 1 mm in diameter; Figure 1E), which require finesse for isolation. A dissection microscope can be used to assist with dissection.
Basement matrix used in this protocol is a biological matrix that contains known and unknown growth factors19, the concentration of which can vary from lot to lot. We recommend that for technical replicates, the same lot and/or aliquot of basement matrix be used to avoid variability. We also recommend routinely checking L-WRN cell culture for mycoplasma contamination and conditioned medium for WNT activity11. The lab for this study used a Mycoplasma detection kit and WNT activity assay respectively. Notably, EHBDOs medium contains low amount of fetal bovine serum (0.5%; Table of Materials).
The presented protocol describes a 3-dimensional epithelial cell culture containing cells with progenitor and differentiated cell markers characteristic for cholangiocytes and formed in the presence of WNT3a, R-spondin1, and Noggin growth factors and defined supplements (Table of Materials). It is organ-specific, as it is derived from adult mouse EHBDs. It is likely derived from adult cells with stem cell properties evidenced by cell self-organization in the 3-dimensional structures and ability to be maintained and expanded long-term. The organoids are mainly cystic in structure with minimal "budding," which might indicate a more stem cell-like organoid phenotype. It is possible that additional stem cell niche factors could lead to a higher plating efficiency of organoids, as well as a higher degree of differentiation.
Our technique produces a 3-dimensional organoid culture that can be generated in a time- and cost-efficient manner, which minimizes animal use, is highly reproducible, and permits multiple downstream applications. This new tool is important for EHBD studies, since tools to study adult EHBDs are very limited. It would be of special benefits to laboratories that do not have access to human tissues or want to take advantage of genetically modified mouse models.
Mouse tissue, unlike human tissue, is highly accessible. There are multiple reagents, including immunohistochemistry antibodies to study mouse tissues. The cost of reagents to culture adult tissue organoids has significantly decreased since this technique was initially introduced. In addition, new materials have become available, including the L-WRN cell conditioned medium used in this protocol, which further reduces organoid culture cost. EHBDOs are easy to propagate, store, and process for analysis. The immunohistochemical, microscopic, and qRT-PCR analyses are presented as examples in this manuscript. Additionally, our group recently described generation and use of EHBDOs from genetically engineered mice and quantitation of EHBDO cell proliferation using 5-ethynyl-2´-deoxyuridine (EdU)16.
Potential downstream applications of EHBDOs include but are not limited to the culturing of an almost unlimited amount of cholangiocytes to study mechanisms of EHBD cholangiocyte homeostasis. In the future, this protocol can be applied to the study of disease states; to test cholangiocyte organoids, including analysis of regenerative medicine (intrabiliary implantation), genetic and pharmacologic manipulation, drug testing16; and to study the effects of infectious agents12,20. Cell-cell interaction can be studied using co-culture of EHBD organoids with other cell types21.
Mouse-derived organoids can be used for pilot studies prior to the generation of human EHBDOs, since human material is valuable and limited. Future studies focused on discovery of factors that promote higher plating efficiency and organoid cell differentiation are desired for study of human organoids. Ongoing studies that search for a more biologically neutral extracellular matrix for organoid culture are also pertinent to EHBDOs culture refinement.
Disclosures
The authors declare that they have no competing interests.
Acknowledgements
This work was supported by the American Association for the Study of Liver Diseases Pinnacle award (to N.R.) and the National Institutes of Health, National Institute of Diabetes and Digestive and Kidney Diseases (awards P30 DK34933 to N.R., P01 DK062041 to J.L.M.). We thank Dr. Ramon Ocadiz-Ruiz (University of Michigan) for his assistance with development of this methodology.
Materials
| Name | Company | Catalog Number | Comments |
|---|---|---|---|
| L-WRN cell culture medium | |||
| Advanced DMEM/F12 | Life Technologies | 12634-010 | |
| Fetal Bovine Serum (FBS) | 1% | Life Technologies | 10437-028 |
| Penicillin-Streptomycin | 100 U/mL | Life Technologies | 15140-122 |
| Washing buffer | |||
| Phosphate Buffered Saline (PBS) | 50 mL | Life Technologies | 10010-023 |
| Penicillin-Streptomycin | 125 U/mL | Life Technologies | 15140-122 |
| Amphotericin B | 6.25 µg/mL | Life Technologies | 15290-018 |
| Organoid culture medium | |||
| L-WRN Conditioned medium | 1:1 | ATCC | CRL-3276 |
| Advanced DMEM/F12 | 1:1 | Life Technologies | 12634-010 |
| Penicillin-Streptomycin | 100 U/mL | Life Technologies | 15140-122 |
| N-Glutamine | 10 µl/mL | Life Technologies | 35050-061 |
| N-2-hydroxyethylpiperazine-N-2-ethane sulfonic acid, HEPES | 10 mM | Life Technologies | 15630-080 |
| B27 | 10 µl/mL | Gibco | 17504-044 |
| N2 | 10 µl/mL | Gibco | 17502-048 |
| Organoid seeding medium | |||
| Organoid culture medium | |||
| Epidermal growth factor (EGF) | 50 ng/mL | Invitrogen | PMG8041 |
| Fibroblast growth factor-10 (FGF10) | 100 ng/mL | PeproTech | 100-26 |
| Primary antibodies | |||
| Anti-Cytokeratin 19 (CK19) antibody, Rabbit | 1:250 | Abcam | ab53119 |
| Sex-Determining Region Y-Box 9 (SOX9) antibody, Rabbit | 1:200 | Santa Cruz | sc-20095 |
| Pancreatic Duodenal Homeobox 1 (PDX1) antibody, Rabbit | 1:2000 | DSRB | F109-D12 |
| E-cadherin antibody, Goat | 1:500 | Santa Cruz | sc-31020 |
| Acetylated α-tubulin antibody, Mouse | 1:500 | Sigma-Aldrich | T6793 |
| Secondary antibodies | |||
| 488 labeled anti-rabbit, Donkey IgG | 1:1000 | Invitrogen | A-21206 |
| 594 labeled anti-goat, Donkey IgG | 1:1000 | Invitrogen | A-11058 |
| 568 labeled anti-mouse, Goat IgG2b | 1:500 | Invitrogen | A-21144 |
| TopFlash Wnt reporter assay | |||
| TopFlash HEK293 cell line | ATCC | CRL-1573 | |
| Luciferase Assay Kit | Biotium | 30003-2 | |
| 0.05% Trypsin-EDTA | Life Technologies | 25300054 | |
| 0.4% Trypan Blue Solution | Life Technologies | 15250061 | |
| Additional materials and reagents | |||
| Basement matrix, phenol free Matrigel | CORNING | 356237 | |
| Dissociation buffer, Accutase | Gibco | A1110501 | |
| Cell culture freezing medium, Recovery | Life Technologies | 12648010 | |
| Cell strainer (70 µm, steriled) | Fisherbrand | 22363548 | |
| Guanidinium thiocyanate-phenol RNA extraction, TRIzol | Invitrogen | 15596026 | |
| Specimen processing gel, HistoGel | Thermo Fisher Scientific | HG-4000-012 | |
| Universal mycoplasma detection kit | ATCC | 30-1012K | |
| 1.5 mL microcentrifuge tube | Fisherbrand | 05-408-129 | |
| 24 well plate | USA Scientific | CC7682-7524 | |
| 50 mL conical centrifuge tube | Fisher scientific | 14-432-22 | |
| Fluorescence microscope | Nikon | Eclipse E800 | |
| Inverted microscope | Biotium | 30003-2 | |
| Necropsy tray | Fisherbrand | 13-814-61 |
References
- Lazaridis, K. N., LaRusso, N. F. The Cholangiopathies. Mayo Clinic Proceedings. 90 (6), 791-800 (2015).
- Carpino, G., et al. Stem/Progenitor Cell Niches Involved in Hepatic and Biliary Regeneration. Stem Cells International. 2016, 3658013(2016).
- DiPaola, F., et al. Identification of intramural epithelial networks linked to peribiliary glands that express progenitor cell markers and proliferate after injury in mice. Hepatology. 58 (4), 1486-1496 (2013).
- Venter, J., et al. Development and functional characterization of extrahepatic cholangiocyte lines from normal rats. Digestive And Liver Disease. 47 (11), 964-972 (2015).
- Glaser, S. S., et al. Morphological and functional heterogeneity of the mouse intrahepatic biliary epithelium. Laboratry Investigation. 89 (4), 456-469 (2009).
- Cardinale, V., et al. Multipotent stem/progenitor cells in human biliary tree give rise to hepatocytes, cholangiocytes, and pancreatic islets. Hepatology. 54 (6), 2159-2172 (2011).
- De Assuncao, T. M., et al. Development and characterization of human-induced pluripotent stem cell-derived cholangiocytes. Laboratry Investigation. 95 (6), 684-696 (2015).
- Huch, M., et al. In vitro expansion of single Lgr5+ liver stem cells induced by Wnt-driven regeneration. Nature. 494 (7436), 247-250 (2013).
- Huch, M., et al. Long-term culture of genome-stable bipotent stem cells from adult human liver. Cell. 160 (1-2), 299-312 (2015).
- Kruitwagen, H. S., et al. Long-Term Adult Feline Liver Organoid Cultures for Disease Modeling of Hepatic Steatosis. Stem Cell Reports. 8 (4), 822-830 (2017).
- Spence, J. R. Taming the Wild West of Organoids, Enteroids, and Mini-Guts. Cellular And Molecular Gastroenterology And Hepatology. 5 (2), 159-160 (2018).
- Dutta, D., Heo, I., Clevers, H. Disease Modeling in Stem Cell-Derived 3D Organoid Systems. Trends In Molecular Medicine. 23 (5), 393-410 (2017).
- Sampaziotis, F. Building better bile ducts. Science. 359 (6380), 1113(2018).
- Sampaziotis, F., et al. Reconstruction of the mouse extrahepatic biliary tree using primary human extrahepatic cholangiocyte organoids. Nature Medicine. 23 (8), 954-963 (2017).
- Nakagawa, H., et al. Biliary epithelial injury-induced regenerative response by IL-33 promotes cholangiocarcinogenesis from peribiliary glands. Proceedings Of The Natural Academy Of Science Of The United States Of America. 114 (19), E3806-E3815 (2017).
- Razumilava, N. Hedgehog signaling modulates IL-33-dependent extrahepatic bile duct cell proliferation in mice. Hepatology Communications. , (2018).
- Boyer, J. L. Bile formation and secretion. Comprehensive Physiology. 3 (3), 1035-1078 (2013).
- Carpino, G., et al. Biliary tree stem/progenitor cells in glands of extrahepatic and intraheptic bile ducts: an anatomical in situ study yielding evidence of maturational lineages. Journal Of Anatomy. 220 (2), 186-199 (2012).
- Hughes, C. S., Postovit, L. M., Lajoie, G. A. Matrigel: a complex protein mixture required for optimal growth of cell culture. Proteomics. 10 (9), 1886-1890 (2010).
- Williamson, I. A., et al. A High-Throughput Organoid Microinjection Platform to Study Gastrointestinal Microbiota and Luminal Physiology. Cellular And Molecular Gastroenterology And Hepatology. 6 (3), 301-319 (2018).
- Wan, A. C. A. Recapitulating Cell-Cell Interactions for Organoid Construction - Are Biomaterials Dispensable? Trends In Biotechnology. 34 (9), 711-721 (2016).
Reprints and Permissions
