This protocol presents a comprehensive and efficient method for producing kidney organoids from induced pluripotent stem cells (iPSCs) using suspension culture conditions. The primary emphasis of this study lies in the determination of the initial cell density and the WNT agonist concentration, thereby benefiting investigators interested in kidney organoid research.
Method Article
Generating Kidney Organoids in Suspension from Induced Pluripotent Stem Cells
* These authors contributed equally
In This Article
Summary
Abstract
Kidney organoids can be generated from induced pluripotent stem cells (iPSCs) through various approaches. These organoids hold great promise for disease modeling, drug screening, and potential therapeutic applications. This article presents a step-by-step procedure to create kidney organoids from iPSCs, starting from the posterior primitive streak (PS) to the intermediate mesoderm (IM). The approach relies on the APEL 2 medium, which is a defined, animal component-free medium. It is supplemented with a high concentration of WNT agonist (CHIR99021) for a duration of 4 days, followed by fibroblast growth factor 9 (FGF9)/heparin and a low concentration of CHIR99021 for an additional 3 days. During this process, emphasis is given to selecting the optimal cell density and CHIR99021 concentration at the start of iPSCs, as these factors are critical for successful kidney organoid generation. An important aspect of this protocol is the suspension culture in a low adherent plate, allowing the IM to gradually develop into nephron structures, encompassing glomerular, proximal tubular, and distal tubular structures, all presented in a visually comprehensible format. Overall, this detailed protocol offers an efficient and specific technique to produce kidney organoids from diverse iPSCs, ensuring successful and consistent results.
Introduction
The kidney plays a critical role in maintaining physiological homeostasis, depending on its functional unit. Nephrons, which excrete waste products, can regulate the composition of body fluids. Chronic kidney disease (CKD), caused by hereditary mutations or other high-risk factors, will eventually progress to end-stage kidney disease (ESKD)1,2. ESKD is apparently due to the limited regeneration capacity of nephrons. Thus, renal replacement therapy is required. Directed differentiation of human iPSCs enables the in vitro generation of patient-specific 3D kidney organoids, which can be used to study kidney development, model patient-specific diseases, and perform nephrotoxic drug screening3,4.
During embryonic development, kidneys originate from the intermediate mesoderm (IM), which differentiates from the primitive streak (PS). The classical WNT signaling pathway may induce additional differentiation of IM with the coordinated participation of FGF (FGF9, FGF20) and BMP (Bmp7 signaling through JNK)5,6,7. They produce two important cell populations of nephric progenitor cells (NPC): the ureteral bud (UB), and the metanephric mesenchyme (MM), forming the collecting ducts and the nephron, respectively8,9. Each nephron consists of glomerular and tubular segments, such as the proximal and distal tubules, and the loop of Henle10,11. According to the theory mentioned above, currently published protocols mimic the signal cascades and growth factor stimulation to induce kidney organoids5,12.
Over the past several years, many protocols have been developed to differentiate human iPSCs into kidney organoids5,6,7,12. Takasato et al.7 optimized the duration of CHIR (WNT agonist) treatment before replacement by FGF9. According to their protocol, CHIR exposure for 4 days, followed by FGF9 for 3 days, is the most effective way to induce IM from iPSCs. Transwell filters were utilized as the culture format in their procedure; however, this method is difficult for beginners. Therefore, Kumar et al.13 tried to change the culture format and chose to suspend the culture. They dissociated the adherent cells on Day 7 for seeding in low adherent plates to help them assemble into embryoid bodies (EBs) that contain nephron-like structures. However, the batch effect of these methods was apparent, especially in different iPSCs. Additionally, different literature reported that the concentration of CHIR varied from 7 µM to 12 µM5,13,14.
We speculated that the concentration of cell density and the CHIR might affect the generation of organoids in different iPSCs, and this has been verified numerous times in our experiments. The present protocol has slightly modified the study method of Kumar et al.13 and provided users with a step-by-step procedure. The schedule and schematic of the approach are shown in Figure 1.
Protocol
The iPSCs used for the present study were obtained from a commercial source. The cells were maintained with mTeSR medium on commercially available basement membrane matrix-coated plates (see Table of Materials). Table 1 contains all the medium compositions utilized in the study.
1. Plating iPSCs for differentiation and inducing posterior primitive streak (PS)
- Wash iPSCs on the membrane matrix-coated 6-well plate with 2 mL DPBS. Aspirate the DPBS using a pipette.
- Add 1 mL of the commercially available cell detachment solution (see Table of Materials) to detach iPSCs and incubate at 37 °C for 5 min.
- Add 1 mL of mTeSR to iPSCs, and ensure cells have lifted off the plastic surface.
- Centrifuge the cells at 400 x g for 3 min at room temperature (RT). Resuspend the cell pellet and count the cell number using a hemocytometer.
- Seed a range of cell densities onto a 24-well- or 6-well plate coated with membrane matrix and culture with mTeSR supplemented with 10 µM Rho kinase inhibitor (Y-27632) (see Table of Materials). Culture them overnight in a 37 °C CO2 incubator.
NOTE: To induce PS, the optimal concentration of CHIR99021 and the suitable cell densities vary from different iPSC lines. Seed a range of densities (e.g., 0.6, 0.9, 1.2, 1.5, 1.8, 2.4 * 103 single cells per square centimeter) and a range of concentration of CHIR99021 from 7 µM-12 µM. Initiate the differentiation of each density and each CHIR on the same day. Find the optimal concentration of CHIR99021 and the suitable cell densities in a 24-well plate and then expand the culture in 6-well plates. Here we provide a protocol based on a 6-well plate. - Next day, aspirate the mTeSR and wash the cells with 2 mL of DPBS.
- Add 2 mL of stage I medium (stem-cell differentiation medium containing 8-12 µM CHIR99021) (Table 1), refer to as Day 0.
- Culture them in a 37 °C incubator for 4 days, refresh stage I medium every two days.
2. Inducing nephrogenic intermediate mesoderm (IM)
- On Day 4, remove the stage I medium and wash with 2 mL of DPBS.
- Add 2 mL of stage II medium to the cells (stem-cell differentiation medium containing 200 ng/mL FGF9, 1 µg/mL Heparin, and 1 µM CHIR99021) (Table 1).
- Culture them in a 37 °C incubator, and refresh the medium every 2 days until Day 7.
3. Generating kidney organoids in suspension culture
NOTE: During the observation period from Day 0 to Day 7, the state of the cells is critical. If the cells exhibit successful expansion and heap up without significant cell debris, it demonstrates the successful derivation of the intermediate mesoderm (IM), indicating the readiness to proceed to the next stage. However, if the cells show signs of initial apoptosis, followed by necrosis or breakage, it may be indicative of inappropriate concentrations of CHIR99021 or cell densities.
- On Day 7, remove the stage II medium and wash the cells with 2 mL of DPBS.
- Add 1 mL of the cell detachment solution to each well and incubate at 37 °C for 5 min until cells are refractive under phase contrast.
- Pipette 1 mL of stage II medium to cells, mix, and ensure the cells have lifted off from the surface.
- Collect the cell suspension in a 15 mL tube and centrifuge at 400 x g for 3 min at room temperature.
- Remove the supernatant and resuspend the cell pellet in 2 mL of stage III medium (stem-cell differentiation medium containing 200 ng/mL FGF9, 1 µg/mL Heparin, and 1 µM CHIR99021 in 0.1% Methylcellulose (MC), 0.1% Polyvinylalcohol (PVA)) supplemented with 10 µM Rho kinase inhibitor (Y-27632) (see Table of Materials). Mix it gently.
- Mix the cell suspension and seed into a 6-well low-adhesion plate in a ratio of 1:3. Put the plate on an orbital shaker (CO2 resistant, rotating at 60 rpm) in an incubator at 37 °C and 5% CO2.
- 24 h later, remove Rho kinase inhibitor (Y-27632) and add stage III media (stem-cell differentiation medium supplement with 200 ng/mL FGF9, 1 µg/mL Heparin, 1 µM CHIR99021, 0.1% MC, 0.1% PVA). Culture for 2 days. Change the medium in the suspension culture by following the steps below:
- Cut off the tip of the 1 mL pipette with aseptic scissors.
- Gently shake the 6-well plate to arrange the organoids in the middle of the plate.
- Aspirate the organoids with the prepared pipettes into a 15 mL tube and allow them to stand for 5 min.
- Aspirate the supernatant and leave the organoids at the bottom of the tube.
- Add the fresh medium to resuspend the organoids and replate back into a 6-well low-adhesion plate.
- Continue shaking the low-adhesion plate at 60 rpm in the incubator. Change the stage III medium every two days until Day 12.
- On Day 12, change the medium to stage IV medium (stem-cell differentiation medium containing 0.1% MC and 0.1% PVA).
- Change the medium every two days until Day 25. The organoids can gradually develop into mature nephron structures from Day 12-25.
4. Immunofluorescence staining of kidney organoids
- Collect kidney organoids into a 15 mL tube and wash with 2 mL PBS.
- After allowing it to set for 5-10 min, fix the kidney organoids in freshly prepared 2% PFA for 20 min at 4 °C.
- Remove the PFA and wash the organoids with 1 mL PBS containing 0.3% Triton X-100 (0.3% PBST), shake it evenly on a shaker (with a rotation speed not exceeding 60 rpm) for 8 min, allow it to stand for 5 min, and then remove the supernatant. Repeat three times.
NOTE: The organoids can be stored in 0.3% PBST at 4° C for 2-4 weeks. - Incubate the fixed organoids with 10% donkey serum in PBST (blocking buffer) (see Table of Materials) overnight at 4 °C.
- Dilute the primary antibodies (listed in the Table of Materials) in a blocking buffer with a ratio of 1:300.
- Incubate the organoids with primary antibodies overnight at 4 °C with agitation.
NOTE: Ensure that glomeruli and tubules can be stained simultaneously on one organoid. - Wash the organoids with 1 mL 0.3% PBST, shake it evenly on a shaker (with a rotation speed not exceeding 60 rpm) for 8 min, allow it to stand for 5 min, and then remove the supernatant. Repeat three times.
- Incubate the organoids with secondary antibodies (listed in the Table of Materials) and DAPI overnight at 4 °C with agitation. Then repeat step 4.7.
NOTE: Both secondary antibody and DAPI are diluted in blocking solution, secondary antibody (1:400) and DAPI (1:1000). - After the staining, dehydrate the organoids with methanol (25%, 50%, 75%, and 100% for 5 min each), then permeate with benzyl alcohol and benzyl benzoate (BABB, 1:2 ratio) (see Table of Materials) for 5 min.
- Moute the cleared organoids on a glass-bottom dish (see Table of Materials) and examine them by confocal microscopy.
NOTE: When imaging, choose the Petri dish at the bottom of the glass dish, and when permeating, put the BABB directly in the Petri dish to keep the bottom of the dish moist.
5. In vitro dextran uptake assay
- On Day 25, incubate the organoids with 100 µg/mL of fluorescence-labeled dextran (see Table of Materials) for 4 h in an incubator at 37 °C and 5% CO2.
- 4 hours later, switch to a fresh medium and capture live cell culture images using a wide-field fluorescence microscope.
Results
The production of IM is achieved by activating canonical WNT signaling using the GSK3 inhibitor CHIR99021, followed by FGF9/heparin. From Day 0 to Day 4, iPSCs rapidly expand and take on rhomboid or triangular shapes. The confluence reaches 90%-100% and accumulates evenly until Day 7. Upon suspension culture, the aggregates spontaneously form nephron structures after dissociating on Day 7. The kidney organoids created through suspension culture display tubular-like structures and are easily observed in bright field images after 18 days of aggregation (Figure 2 and Figure 3).
Typically, one assay starting from a well of a 24-well plate of iPSCs yields 200-300 organoids. Among these, 80%-90% contain nephron-like structures (Figure 2). For the hiPSC-B1 iPSC line, the best conditions for generating kidney organoids involve culturing 1.8-2.0 x 10⁴ cells of a well of a 24-well plate with 8 µM CHIR99021 (Figure 2, Figure 3, and Figure 4). These kidney organoids can be maintained for up to 1-2 weeks beyond Day 25 by changing the stage IV medium every 2-3 days.
Immunofluorescence analysis of the whole organoids reveals the presence of nephron segments, including NPHS1-, Synaptopodin (SYNAPO-) and WT1-labeled podocytes, MEIS1/2/3-labeled interstitial cells, Lotus Tetragonolobus Lectin (LTL-) labeled proximal tubules, E-Cadherin (ECAD-) labeled distal tubules, and GATA3-labeled collecting ducts. Furthermore, this protocol induces endothelial cells that show positive staining with CD31 (Figure 5).
Finally, in vitro dextran uptake assays indicate the physiologically relevant functions of kidney organoids. After incubating the kidney organoids (Day 7 + 18) with 100 µg/mL of fluorescence-labeled dextran for 4 h, the dextran is observed to be taken into the proximal tubules in bright field images (Figure 5L and Figure 6).
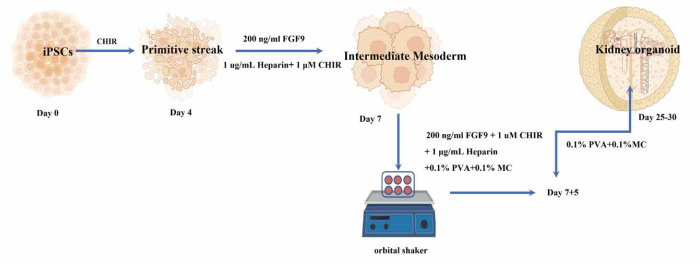
Figure 1: The experimental schedule and the overview of the protocol. Please click here to view a larger version of this figure.
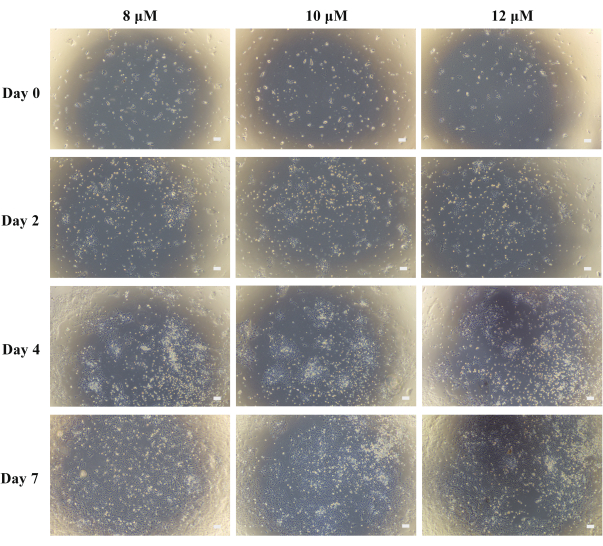
Figure 2: Generation of kidney organoids from Day 0 to Day 7 using different concentrations of CHIR99021. Scale bars: 100 µm. Please click here to view a larger version of this figure.
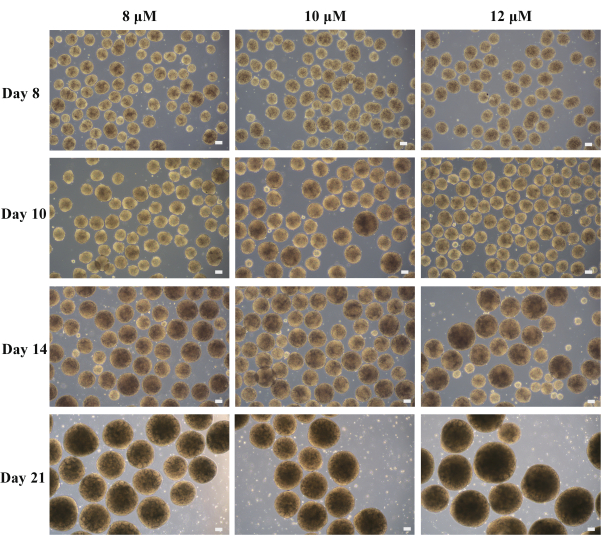
Figure 3: Generation of kidney organoids from Day 8 to Day 21 using different concentrations of CHIR99021. Scale bars: 100 µm. Please click here to view a larger version of this figure.
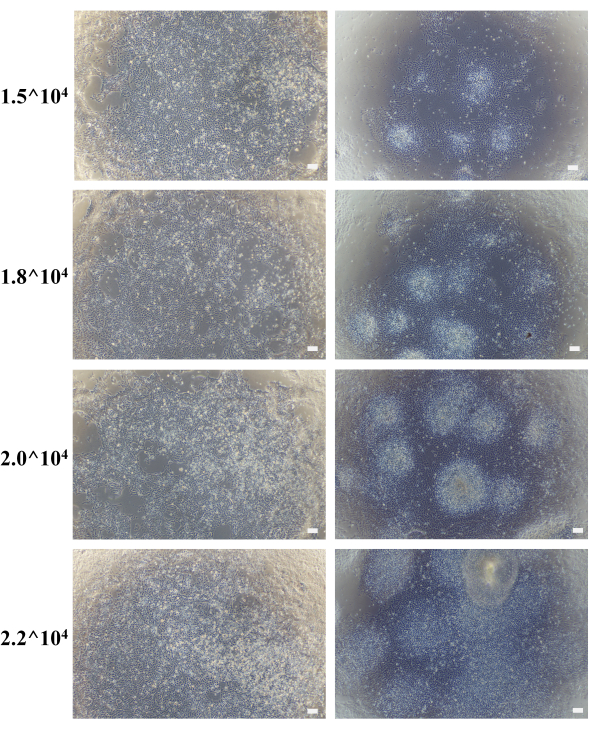
Figure 4: Images captured on Day 7 of the different cell densities from 1.5 x 10⁴ to 2.2 x 10⁴ cells/well. Scale bars: 100 µm. Please click here to view a larger version of this figure.
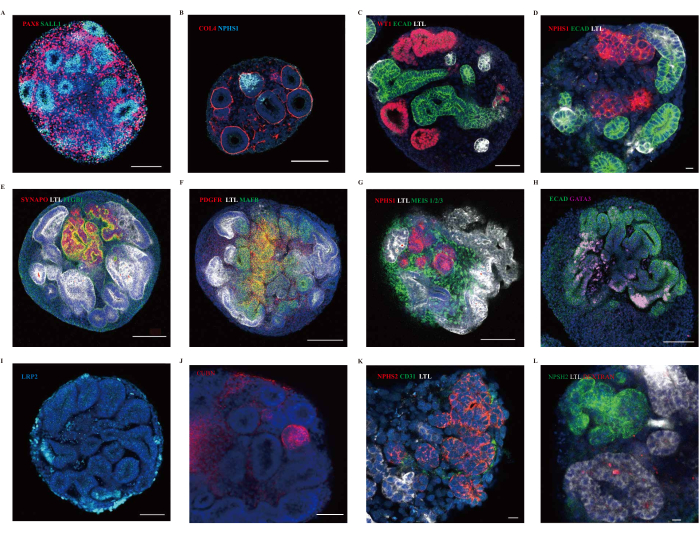
Figure 5: Representative confocal immunofluorescence images of kidney organoids. (A,B) Immunofluorescence analysis for markers of nephron progenitor (SALL1, blue), pre-tubular aggregate (PAX8, magenta), podocyte (NPHS1, blue) of D7+11 kidney organoids. (C-K) Immunofluorescence analysis of Segmented patterning in organoids shows the presence of podocytes (NPHS1, NPHS2, SYNAPO, and WT1, red; MAFB, green), proximal tubules (LTL, white; LRP2, blue; CUBN, red), distal tubules (ECAD, green), collect ducts (GATA3, pink), mesangial cells (PDGFR, red), interstitial cells (MEIS1/2/3, green), Integrin beta 1 (TIGB1, green) and endothelial cells (CD31, green). Scale bars: 100 µm (A,C,E-J), 50 µm (B), and 10 µm (D,K). (L) immunofluorescence analysis of kidney organoids following the dextran update assay. Scale bar: 10 µm. Please click here to view a larger version of this figure.
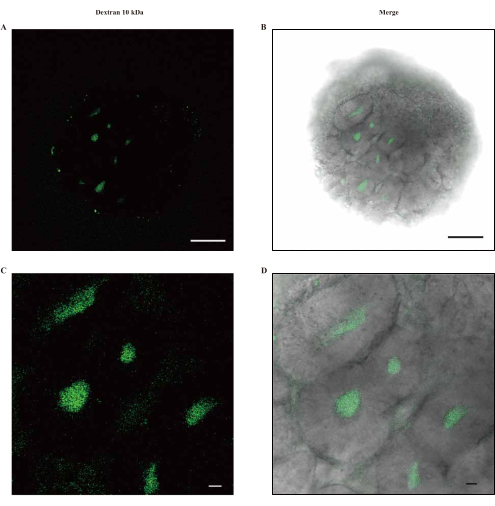
Figure 6: In vitro functional validation of Day 25 kidney organoids. (A-D) Live images of kidney organoids incubated with Fluorescence-labeled dextran of 10 kDa. Scale bars: 100 µm (A,B); 10 µm (C,D). Please click here to view a larger version of this figure.
| Reagent | Stock conc. | Working conc. |
Stage  medium | ||
| APEL | n/a | n/a |
| CHIR 99021 | 10 µM | 4-12 µM |
Stage  medium | ||
| APEL | n/a | n/a |
| FGF9 | 100 ng/µL | 200 ng/mL |
| rHSA | 0.2 g/mL | 1 µg/mL |
| Heparin | 2 mg/mL | 1 µg/mL |
| CHIR 99021 | 10 µM | 1 µM |
Stage  medium | ||
| APEL | n/a | n/a |
| FGF9 | 100 ng/µL | 200 ng/mL |
| rHSA | 0.2 g/mL | 1 µg/mL |
| Heparin | 2 mg/mL | 1 µg/mL |
| CHIR 99021 | 10 µM | 1 µM |
| PVA | 1% | 0.10% |
| MC | 1% | 0.10% |
Stage  medium | ||
| APEL | n/a | n/a |
| PVA | 1% | 0.10% |
| MC | 1% | 0.10% |
Table 1: The medium compositions utilized in the study.
Discussion
A detailed protocol has been described for generating kidney organoids from iPSCs, involving minor modifications to the basal medium, initial cell density, and concentration of CHIR99021. In various experiments, the critical factors for successful kidney organoid generation were found to be the initial differentiation of the intermediate mesoderm (IM) and the cell state on Day 7. Moreover, different iPSC lines exhibited variations in cell proliferation and differentiation potential, resulting in varying optimal cell densities and CHIR99021 concentrations5,13,14. Consequently, determining the ideal conditions for each iPSC line is essential to produce a substantial number of kidney organoids from patient-specific iPSCs.
To identify the optimal conditions, it is recommended to conduct preliminary experiments using 24-well plates before scaling up the culture to 6-well plates for larger-scale production. This step allows researchers to assess the success of induction based on cell morphology and quantity. Furthermore, the organoids can be preserved in their complete structure for 2-4 weeks following fixation, enhancing the feasibility and utility of this method.
The kidney organoids generated using this protocol typically measure approximately 50-300 µm and exhibit tubular-like structures when observed under bright field microscopy. Immunofluorescent analysis confirms the reliable formation of kidney nephrons, such as podocytes labeled with NPHS1 and WT1, proximal tubules labeled with LTL, LRP2, and CUBN, distal tubules labeled with ECAD, collecting ducts labeled with GATA3, and interstitial cells labeled with MEIS1/2/313. Additionally, this protocol induces the presence of endothelial cells stained with CD31, suggesting the potential for vascularization within the kidney organoids.
In vitro dextran uptake assays demonstrate physiologically relevant functions of the kidney organoids, such as preliminary filtration and reabsorption. This makes them highly suitable for disease modeling and studying the mechanisms of dysfunction. However, it's important to note that the maturity of these kidney organoids resembles first-trimester human kidneys, and they lack vasculature in the in vitro culture13. Further research is needed to elucidate the underlying mechanisms.
In conclusion, the described protocol offers a promising method for generating kidney organoids from iPSCs, providing an avenue for further research and study.
Disclosures
The authors reported no potential conflict of interest.
Acknowledgements
We are extremely grateful to all Mao and Hu Lab members, past and present, for the interesting discussions and great contributions to the project. We thank the National Clinical Research Center for Child Health for the great support. This study was financially supported by the National Natural Science Foundation of China (U20A20351 to Jianhua Mao, 82200784 to Lidan Hu), the Natural Science Foundation of Zhejiang Province of China (No. LQ22C070004 to Lidan Hu), and the Natural Science Foundation of Jiangsu Province (Grants No. BK20210150 to Gang Wang).
Materials
| Name | Company | Catalog Number | Comments |
|---|---|---|---|
| 96 Well Cell Culture Plate, Flat-Bottom | NEST | Cat #701003 | |
| Accutase | STEMCELL Technologies | Cat #07920 | |
| Antibodies | |||
| Benzyl alcohol | Sigma-Aldrich | Cat #100-51-6 | |
| Benzyl benzoate | Sigma-Aldrich | Cat #120-51-4 | |
| Biological Safety Cabinet | Haier | Cat #HR40  A2 | |
| Biotin anti-human LTL (1:300) | Vector Laboratories | Cat #B-1325 | |
| Blood mononuclear cells hiPS-B1 (iPSc, female) | N/A | N/A | |
| Carbon dioxide level shaker | HAMANY | Cat #C0-06UC6 | |
| Chemicals, peptides, and recombinant proteins | |||
| CHIR99021 (Wnt pathway activator) | STEMCELL Technologies | Cat #72054 | |
| Costar Multiple 6 Well Cell Culture Plate | Corning | Cat #3516 | |
| Costar Ultra-Low Attachment 6 Well Plate | Corning | Cat #3471 | |
| CryoStor CS10 | STEMCELL Technologies | Cat #07930 | |
| DAPI stain Solution | Coolaber | Cat #SL7102 | |
| Dextran, Alexa Fluor 647 | Thermo SCIENTIFIC | Cat #D22914 | |
| DMEM/F-12 HEPES-free | Servicebio | Cat #G4610 | |
| Donkey Anti-Sheep IgG H&L (Alexa Fluor 647) | Abcam | Cat #ab150179 | |
| Donkey serum stoste | Meilunbio | Cat #MB4516-1 | |
| D-PBS (without calcium, magnesium, phenol red) | Solarbio Life Science | Cat #D1040 | |
| Dry Bath Incubator | Shanghai Jingxin | Cat #JX-10 | |
| Dylight 488-Goat Anti-Mouse IgG (1:400) | Earthox | Cat #E032210 | |
| Dylight 488-Goat Anti-Rabbit IgG (1:400) | Earthox | Cat #E032220 | |
| Dylight 549-Goat Anti-Mouse IgG (1:400) | Earthox | Cat #E032310 | |
| Dylight 549-Goat Anti-Rabbit IgG (1:400) | Earthox | Cat #E032320 | |
| Dylight 649-Goat Anti-Rabbit IgG (1:400) | Earthox | Cat #E032620 | |
| Experimental models: Cell Lines | |||
| Forma Steri-Cycle CO2 Incubator | Thermo SCIENTIFIC | Cat #370 | |
| Geltre LDEV-Free | Gibco | Cat #A1413202 | |
| Glass Bottom Culture Dishes | NEST | Cat #801002 | |
| Goat anti-human CUBN (1:300) | Santa Cruz Biotechnology | Cat #sc-20607 | |
| Heparin Solution (Cell culture supplement) | STEMCELL Technologies | Cat #07980 | |
| Human Recombinant FGF-9 | STEMCELL Technologies | Cat #78161 | |
| Inverted Microscope | OLYMPUS | Cat #CKX53 | |
| Laser Scanning Confocal Microscope | OLYMPUS | Cat #FV3000 | |
| Methyl cellulose | Sigma-Aldrich | Cat #M7027 | |
| Micro Centrifuge | HENGNUO | Cat #2-4B | |
| Mouse anti-human CD31 (1:300) | BD Biosciences | Cat #555444 | |
| Mouse anti-human ECAD (1:300) | BD Biosciences | Cat #610182 | |
| Mouse anti-human Integrin beta 1 (1:300) | Abcam | Cat #ab30394 | |
| Mouse anti-human MEIS 1/2/3 (1:300) | Thermo SCIENTIFIC | Cat #39795 | |
| Mowiol 4-88 (Polyvinylalcohol 4-88) | Sigma-Aldrich | Cat #81381 | |
| mTeSR1 5X Supplement | STEMCELL Technologies | Cat #85852 | |
| mTeSR1 Basal Medium | STEMCELL Technologies | Cat #85851 | |
| Nunc CryoTube Vials | Thermo SCIENTIFIC | Cat #377267 | |
| Others | |||
| Rabbit anti-human GATA3 (1:300) | Cell Signaling Technology | Cat #5852S | |
| Rabbit anti-human LRP2 (1:300) | Sapphire Bioscience | Cat #NBP2-39033 | |
| Rabbit anti-human Synaptopodin (1:300) | Abcam | Cat #ab224491 | |
| Rabbit anti-human WT1 (1:300) | Abcam | Cat #ab89901 | |
| Rabbit anti-mouse PDGFR (1:300) | Abcam | Cat #ab32570 | |
| Recombinant Human Serum Albumin (rHSA) | YEASEN | Cat #20901ES03 | |
| Sheep anti-human NPHS1 (1:300) | R&D Systems | Cat #AF4269 | |
| STEMdiff APEL 2 Medium | STEMCELL Technologies | Cat #05275 | |
| Streptavidin Cy3 (1:400) | Gene Tex | Cat #GTX85902 | |
| Versene (1X) | Gibco | Cat #15040066 | |
| Y-27632 (Dihydrochloride) | STEMCELL Technologies | Cat #72304 |
References
- Tekguc, M., et al. Kidney organoids: a pioneering model for kidney diseases. Translational Research. 250, 1-17 (2022).
- Hill, N. R., et al. Global prevalence of chronic kidney disease - a systematic review and meta-analysis. PLOS ONE. 11 (7), 0158765(2016).
- Rossi, G., Manfrin, A., Lutolf, M. P. Progress and potential in organoid research. Nature Reviews Genetics. 19 (11), 671-687 (2018).
- Takasato, M., et al. Directing human embryonic stem cell differentiation towards a renal lineage generates a self-organizing kidney. Nature Cell Biology. 16 (1), 118-126 (2014).
- Morizane, R., Lam, A. Q., Freedman, B. S., Kishi, S., Valerius, M. T., Bonventre, J. V. Nephron organoids derived from human pluripotent stem cells model kidney development and injury. Nature Biotechnology. 33 (11), 1193-1200 (2015).
- Freedman, B. S., et al. Modelling kidney disease with CRISPR-mutant kidney organoids derived from human pluripotent epiblast spheroids. Nature Communications. 6 (1), 8715(2015).
- Takasato, M., et al. Kidney organoids from human iPS cells contain multiple lineages and model human nephrogenesis. Nature. 526 (7574), 564-568 (2015).
- Mugford, J. W., Sipilä, P., McMahon, J. A., McMahon, A. P. Osr1 expression demarcates a multi-potent population of intermediate mesoderm that undergoes progressive restriction to an Osr1-dependent nephron progenitor compartment within the mammalian kidney. Developmental biology. 324 (1), 88-98 (2008).
- SaxOn, L., Sariola, H. Early organogenesis of the kidney. Pediatric Nephrology. 1, 385-392 (1987).
- Kobayashi, A., et al. Six2 defines and regulates a multipotent self-renewing nephron progenitor population throughout mammalian kidney development. Cell Stem Cell. 3 (2), 169-181 (2008).
- Boyle, S., et al. Fate mapping using Cited1-CreERT2 mice demonstrates that the cap mesenchyme contains self-renewing progenitor cells and gives rise exclusively to nephronic epithelia. Developmental Biology. 313 (1), 234-245 (2008).
- Nishinakamura, R. Human kidney organoids: progress and remaining challenges. Nature Reviews Nephrology. 15 (10), 613-624 (2019).
- Kumar, S. V., et al. Kidney micro-organoids in suspension culture as a scalable source of human pluripotent stem cell-derived kidney cells. Development. 146 (5), 172361(2019).
- Takasato, M., Er, P. X., Chiu, H. S., Little, M. H. Generation of kidney organoids from human pluripotent stem cells. Nature Protocols. 11 (9), 1681-1692 (2016).
Reprints and Permissions
