


Overview
Source: Laboratory of Dr. B. Jill Venton - University of Virginia
Calibration curves are used to understand the instrumental response to an analyte and predict the concentration in an unknown sample. Generally, a set of standard samples are made at various concentrations with a range than includes the unknown of interest and the instrumental response at each concentration is recorded. For more accuracy and to understand the error, the response at each concentration can be repeated so an error bar is obtained. The data are then fit with a function so that unknown concentrations can be predicted. Typically the response is linear, however, a curve can be made with other functions as long as the function is known. The calibration curve can be used to calculate the limit of detection and limit of quantitation.
When making solutions for a calibration curve, each solution can be made separately. However, that can take a lot of starting material and be time consuming. Another method for making many different concentrations of a solution is to use serial dilutions. With serial dilutions, a concentrated sample is diluted down in a stepwise manner to make lower concentrations. The next sample is made from the previous dilution, and the dilution factor is often kept constant. The advantage is that only one initial solution is needed. The disadvantage is that any errors in solution making—pipetting, massing, etc.—get propagated as more solutions are made. Thus, care must be taken when making the initial solution.
Principles
Calibration curves can be used to predict the concentration of an unknown sample. To be completely accurate, the standard samples should be run in the same matrix as the unknown sample. A sample matrix is the components of the sample other than the analyte of interest, including the solvent and all salts, proteins, metal ions, etc. that might be present in the sample. In practice, running calibration samples in the same matrix as the unknown is sometimes difficult, as the unknown sample may be from a complex biological or environmental sample. Thus, many calibration curves are made in a sample matrix that closely approximates the real sample, such as artificial cerebral spinal fluid or artificial urine, but may not be exact. The range of concentrations of the calibration curve should bracket that in the expected unknown sample. Ideally a few concentrations above and below the expected concentration sample are measured.
Many calibration curves are linear and can be fit with the basic equation y=mx+b, where m is the slope and b is the y-intercept. However, not all curves are linear and sometimes to get a line, one or both set of axes will be on a logarithmic scale. Linear regression is typically performed using a computer program and the most common method is to use a least squares fitting. With a linear regression analysis, an R2 value, called the coefficient of determination, is given. For a simple single regression, R2 is the square of the correlation coefficient (r) and provides information about how far away the y values are from the predicted line. A perfect line would have an R2 value of 1, and most R2 values for calibration curves are over 0.95. When the calibration curve is linear, the slope is a measure of sensitivity: how much the signal changes for a change in concentration. A steeper line with a larger slope indicates a more sensitive measurement. A calibration curve can also help define the linear range, the range of concentrations that the instrument gives a linear response. Outside this range, the response may taper off due to instrumental considerations, and the equation from the calibration cannot be used. This is known as the limit of linearity.
Limit of detection is the lowest amount that can be statistically determined from the noise. Generally this is defined as a signal that is 3 times the noise. The limit of detection can be calculated from the slope of the calibration curve and is generally defined as LOD=3*S.D./m, where S.D. is the standard deviation of the noise. The noise is measured by taking the standard deviation of multiple measurements. Alternatively, in one trace, noise can be estimated as the standard deviation of the baseline. The limit of quantitation is the amount that can be differentiated between samples and is usually defined as 10 times the noise.
Subscription Required. Please recommend JoVE to your librarian.
Procedure
1. Making the Standards: Serial Dilutions
- Make a concentrated stock solution of the standard. Typically, the compound is accurately weighed out and then quantitatively transferred into a volumetric flask. Add some solvent, mix so the sample dissolves, then fill to the line with the proper solvent.
- Perform serial dilutions. Take another volumetric flask and pipette the amount of standard needed for the dilution, then fill to the line with solvent and mix. A ten-fold dilution is typically made, so for a 10-mL volumetric flask, add 1 mL of the previous dilution.
- Continue as needed for more dilutions, pipetting from the previous solution to dilute it to make the next sample. For a good calibration curve, at least 5 concentrations are needed.
2. Run the Samples for the Calibration Curve and the Unknown
- Run the samples with the UV-Vis spectrophotometer to determine the instrumental response needed for the calibration curve.
- Take the reading with the first sample. It is a good idea to run the samples in random order (i.e. not highest to lowest or lowest to highest) in case there are any systematic errors. In order to get an estimate of noise, repeat the reading on any given sample 3–5x.
- Run the additional standard samples, repeating the measurements for each sample to get an estimate of noise. Record the data to make a plot later.
- Run the unknown sample(s). Use as similar conditions to running the standards as possible. Thus, the sample matrix or buffer should be the same, the pH should be the same, and the concentration should be in the range of the standards run.
3. Making the Calibration Curve
- Record the data in a spreadsheet and use a computer program to plot the data vs concentration. If at least triplicate measurements were taken for each point, error bars can be plotted of the standard deviation of those measurements to estimate of the error of each point. For some curves, the data might need to be plotted with an axis as a log to get a line. The equation that governs the calibration curve is generally known ahead of time, so a log-plot is used when there is a log in the equation.
- Examine the calibration curve. Does it look linear? Does it have a portion that looks non-linear (i.e. reached the limit of the instrumental response)? To check, fit all the data to a linear regression using the software. If the coefficient of determination (R2) is not high, remove some of the points at the beginning or ending of the curve that do not appear to fit the line and perform the linear regression again. It is not acceptable to remove points in the middle just because they have a large error bar. From this analysis, decide what portion of the curve is linear.
- The output of the linear should be an equation of the format y=mx+b, where m is the slope and b is the y-intercept. The units for the slope are the y-axis unit/concentration, in this example (Figure 1) absorbance/μM. The units for the y-intercept are the y-axis units. A coefficient of determination (R2) is obtained. The higher the R2 the better the fit; a perfect fit gives an R2 of 1. The program may also be able to give an estimate of the error on the slope and the intercept.
4. Results: Calibration Curve of Absorbance of Blue Dye #1
- The calibration curve for absorbance of blue dye #1 (at 631 nm) is shown below (Figure 1). The response is linear from 0 to 10 µM. Above that concentration the signal begins to level off because the response is out of the linear range of the UV-Vis spectrophotometer.
- Calculate the LOD. From the slope of the calibration curve, the LOD is 3*S.D. (noise)/m. For this calibration curve, the noise was obtained by taking a standard deviation of repeated measurements and was 0.021. The LOD would be 3*0.021/.109=0.58 µM.
- Calculate the LOQ. The LOQ is 10*S.D.(noise)/m. For this calibration curve, LOQ is 10*0.021/.109 =1.93 µM.
- Calculate the concentration of the unknown. Use the line equation to calculate the concentration of the unknown sample. The calibration curve is only valid if the unknown falls into the linear range of the standard samples. If the readings are too high, dilution might be necessary. In this example, the unknown sports drink was diluted 1:1. The absorbance was 0.243 and this corresponded to a concentration of 2.02 µM. Thus the final concentration of blue dye #1 in the in the sports drink was 4.04 µM.

Figure 1. Calibration curves for UV-Vis absorbance of blue dye. Left: The absorbance was measured of different concentrations of blue dye #1. The responses level off after 10 µM, when the absorbance is over 1. The error bars are from repeated measurements of the same sample and are standard deviations. Right: The linear portion of the calibration curve is fit with a line, y=0.109*x + 0.0286. The unknown data is shown in black. Please click here to view a larger version of this figure.
Calibration curves are used to understand the instrumental response to an analyte, and to predict the concentration of analyte in a sample.
A calibration curve is created by first preparing a set of standard solutions with known concentrations of the analyte. The instrument response is measured for each, and plotted vs. concentration of the standard solution. The linear portion of this plot can then be used to predict the concentration of a sample of the analyte, by correlating its response to concentration.
This video will introduce calibration curves and their use, by demonstrating the preparation of a set of standards, followed by the analysis of a sample with unknown concentration.
A set of standard solutions is used to prepare the calibration curve. These solutions consist of a range of concentrations that encompass the approximate concentration of the analyte.
Standard solutions are often prepared with a serial dilution. A serial dilution is performed by first preparing a stock solution of the analyte. The stock solution is then diluted by a known amount, often one order of magnitude. The new solution is then diluted in the same manner, and so on. This results in a set of solutions with concentrations ranging over several orders of magnitude.
The calibration curve is a plot of instrumental signal vs. concentration. The plot of the standards should be linear, and can be fit with the equation y=mx+b. The non-linear portions of the plot should be discarded, as these concentration ranges are out of the limit of linearity.
The equation of the best-fit line can then be used to determine the concentration of the sample, by using the instrument signal to correlate to concentration. Samples with measurements that lie outside of the linear range of the plot must be diluted, in order to be in the linear range.
The limit of detection of the instrument, or the lowest measurement that can be statistically determined over the noise, can be calculated from the calibration curve as well. A blank sample is measured multiple times. The limit of detection is generally defined as the average blank signal plus 3 times its standard deviation.
Finally, the limit of quantification can also be calculated. The limit of quantification is the lowest amount of analyte that can be accurately quantified. This is calculated as 10 standard deviations above the blank signal.
Now that you've learned the basics of a calibration curve, let's see how to prepare and use one in the laboratory.
First, prepare a concentrated stock solution of the standard. Accurately weigh the standard, and transfer it into a volumetric flask. Add a small amount of solvent, and mix so that the sample dissolves. Then, fill to the line with solvent. It is important to use the same solvent as the sample.
To prepare the standards, pipette the required amount in the volumetric flask. Then fill the flask to the line with solvent, and mix.
Continue making the standards by pipetting from the stock solution and diluting. For a good calibration curve, at least 5 concentrations are needed.
Now, run samples with the analytical instrument, in this case a UV-Vis spectrophotometer, in order to determine the instrumental response needed for the calibration curve.
Take the measurement of the first standard. Run the standards in random order, in case there are any systematic errors. Measure each standard 3–5x to get an estimate of noise.
Measure the rest of the standards, repeating the measurements for each. Record all data.
Finally, run the sample. Use the same sample matrix and measurement conditions as were used for the standards. Make sure that the sample is within the range of the standards and the limit of the instrument.
To construct the calibration curve, use a computer program to plot the data as signal vs. concentration. Use the standard deviation of the repeated measurements for each data point to make error bars.
Remove portions of the curve that are non-linear, then perform a linear regression and determine the best-fit line. The output should be an equation in the form y = m x + b. An R2-value near 1 denotes a good fit.
This is the calibration curve for blue dye #1, measured at 631 nm. The response is linear between 0 and 15 mM.
Calculate the concentration of the sample using the equation of the best-fit line. The absorbance for the sample was 0.141, and corresponded to a concentration of 6.02 mM.
Now that you've seen how a calibration curve can be used with a UV-Vis spectrophotometer, let's take a look at some other useful applications.
Calibration curves are often used with electrochemistry applications, as the electrode signal must be calibrated to the concentration of ions in the solution. In this example, data were collected for an ion-selective electrode for fluoride.
The concentration data must be plotted on the log scale to obtain a line. This calibration curve can be used to measure the concentration of fluoride in a solution, such as toothpaste or drinking water.
High-performance liquid chromatography, or HPLC, is a separation and analysis technique that is used heavily in analytical chemistry. HPLC separates components of a mixture based on the time required for the molecules to travel the length of the chromatography column. This time varies depending on a range of chemical properties of the molecules.
The elution of the molecules is measured using a detector, resulting in a chromatogram. The peak area can be correlated to concentration using a simple calibration curve of a range of standard solutions, like in this example of popular soda ingredients.
In some cases, where the solution matrix interferes with the measurement of the solute, a classical calibration curve can be inaccurate. In those cases, a modified calibration curve is prepared. For this, a range of standard solution volumes is added to the sample. The signal to concentration plot is created, where the x intercept is equal to the original concentration of the sample solution. For more detail on this technique, please watch the JoVE science education video, "The method of standard addition".
You've just watched JoVE's introduction to the calibration curve. You should now understand where the calibration curve is used, how to create it, and how to use it to calculate concentrations of samples.
As always, thanks for watching!
Subscription Required. Please recommend JoVE to your librarian.
Applications and Summary
Calibration curves are used in many fields of analytical chemistry, biochemistry, and pharmaceutical chemistry. It is common to use them with spectroscopy, chromatography, and electrochemistry measurements. A calibration curve can be used to understand the concentration of an environmental pollutant in a soil sample. It could be used determine the concentration of a neurotransmitter in a sample of brain fluid, vitamin in pharmaceutical samples, or caffeine in food. Thus, calibration curves are useful in environmental, biological, pharmaceutical, and food science applications. The most important part of making a calibration curve is to make accurate standard samples that are in a matrix that closely approximates the sample mixture.
An example of an electrochemistry calibration curve is shown below (Figure 2). The data were collected with an ion-selective electrode for fluoride. Electrochemical data follow the Nernst equation E=E0 + 2.03*R*T/(nF) * log C. Thus, the concentration data (x-axis) must be plotted on a log scale to obtain a line. This calibration curve could be used to measure the concentration of fluoride in toothpaste or drinking water.
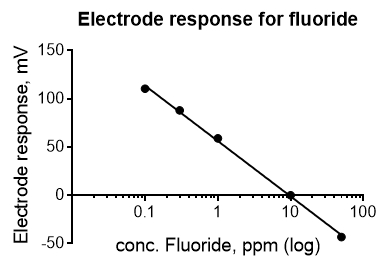
Figure 2. Calibration curve for an ion-selective electrode. The response of a fluoride selective electrode (in mV) to different concentrations of fluoride is plotted. The expected equation for the electrode response is y (in mV)=-59.2*log x+b at 25 °C. The actual equation is y=-57.4*log x +56.38. The R2 value is 0.998. Please click here to view a larger version of this figure.
Subscription Required. Please recommend JoVE to your librarian.