

Overview
This video demonstrates a dissipative microgravimetry technique to investigate the binding of proteins to lipid bilayers. Small unilamellar vesicles are added to coat the surface of the quartz sensor of a microbalance. Utilizing the calcium ion-dependent binding of the target phospholipid-binding protein to the bilayer, changes in the oscillation frequency of the sensor and the dissipation of the oscillation are monitored to determine the nature of the protein-lipid bilayer binding.
Protocol
NOTE: Buffers should be filtered using a 0.22-µm filter and degassed by a vacuum for 1 h.
1. Lipid Vesicle Preparation
- Use 2-mL glass tubes. Dissolve each lipid, 1,2-dioleoyl-sn-glycero-3-phosphocholine (DOPC), 1-palmitoyl-2-oleoyl-sn-glycero-3-phosphocholine (POPC), 1-palmitoyl-2-oleoyl-sn-glycero-3-phospho-L-serine (POPS), and cholesterol (Chol), in a mixture of chloroform/methanol (50:50 v/v) to prepare a clear 5 mM lipid solution. Dissolve 1,2-dioleoyl-sn-glycero-3-phospho-(1'-myo-inositol-4',5'-bisphosphate) (PI(4,5)P2) in a mixture of chloroform/methanol/water (20:9:1 v/v).
- Combine the dissolved lipids in the desired molar ratio of POPC/POPS (80/20), POPC/PI(4,5)P2 (95/5), POPC/POPS/Chol (60/20/20), POPC/POPS/PI(4,5)P2/Chol (60/17/3/20), and POPC/DOPC/POPS/PI(4,5)P2/Chol (37/20/20/3/20) (Table 1) in 10-mL glass tubes.
NOTE: The final amount of total lipid is 500 µg. - Evaporate the organic solvents using a dry stream of nitrogen. Leave the lipid mixture on a high vacuum (lyophilization) system for 3 h to remove any residual traces of the solvents.
NOTE: This results in a dry clear film. - Resuspend the lipid film in 1 mL of citrate buffer (10 mM trisodium-citrate, 150 mM NaCl, pH 4.6). Incubate the lipid suspension at 60 °C (this temperature is around 10 °C above the phase transition temperature of the highest melting lipid in the mixture) for 30 min in a water bath, and vortex it vigorously every 5 min.
NOTE: This results in the formation of large, multilamellar vesicles (MLVs). Keep the suspension above the transition temperature. - Preheat the extruder (at 60 °C in this case) equipped with a 50-nm diameter pore-size polycarbonate membrane above the transition temperature (which is 40 - 50 °C here) for 30 min.
- Load the MLV suspension into the preheated extruder and gently pass the mixture 31x through the polycarbonate membrane to form small unilamellar vesicles (SUVs). Keep the temperature above the transition temperature.
- Transfer the SUV suspension to a 2 mL plastic reaction vessel and add the citrate buffer (see step 1.4) to bring the final volume to 2 mL.
NOTE: This will yield a final lipid concentration of 250 µg/mL.
2. Handling the Quartz Sensors
NOTE: Always handle the quartz sensors with a tweezer.
- Incubate four sensors inserted in a polytetrafluoroethylene holder in a 2% SDS solution for ≥ 30 min. Wash them extensively with ultra-pure water to completely remove the SDS and let them dry using a stream of dry argon or nitrogen.
- Use a plasma-cleaning system to completely remove any contaminants. Insert the dry sensors in the plasma-cleaning chamber, evacuate the chamber, and flush it 3x with oxygen. Turn the plasma cleaner on. Use the following process parameters: 1 x 10⁻⁴ Torr pressure, high radio frequency (RF) power, and 10 min of process time. Turn off the machine and take out the sensors.
3. Microbalance Operation
NOTE: A microbalance system with four temperature-controlled flow chambers in a parallel configuration, connected to a peristaltic pump and set to a flow rate of 80 µL/min, was used. In the open flow mode, the buffer was pumped from the feeder reservoir into the receiving tank. In the loop mode, the receiving tank was connected to the feeder reservoir to generate a closed loop. The temperature was set to 20 °C.
- Carefully dock the plasma-cleaned sensors into the 4 flow chambers, using tweezers. Avoid any pressure on or torsion of the chambers and the tubes that might cause leaking.
- Flush the system with citrate buffer (10 mM trisodium-citrate, 150 mM NaCl, pH 4.6) in the open-flow mode for 10 min.
NOTE: This requires exactly 3.2 mL of buffer, but it is advisable to use an excess buffer (10 mL). - Launch the program. Start recording any changes in the frequency and dissipation of the first fundamental tone (n = 1st) and overtones (n = 3rd - 13th) using the software, until the frequency and dissipation baselines are stable (this will take around 40 - 60 min).
NOTE: Frequency noise levels (peak-to-peak) should be lower than 0.5 Hz and, for the dissipation, lower than 0.1·10-6, with a maximal drift (in aqueous solution) of 1 Hz/h in frequency and 0.3·10-6/h in dissipation. - When the baselines are stable, apply the SUV suspension in citrate buffer (2 mL in a small tube). Using a reaction vessel, remove 1.5 mL of the dead volume. Then close the system in the loop-flow mode. Record the frequency/dissipation shift for another 10 minutes.
NOTE: During this time, the vesicles will spread onto the SiO2 surface and fuse to form a continuous bilayer (step 2 in Figures 1, Figure 2, and Figure 3). The SUVs adsorption on the surface of the sensor is two-phasic and has a typical frequency minimum and maximum in the dissipation. A stable new frequency/dissipation baseline with a characteristic frequency shift (depending on the lipid composition) from 26 - 29 Hz (see Table 1) indicates a continuous bilayer on the surface. - When the SLB is stable (see step 3.4), equilibrate the system with the running buffer (10 mM HEPES, 150 mM NaCl, pH 7.4) at the required Ca2+ concentrations (ranging from 50 µM up to 1 mM CaCl2, depending on the experiment) in an open flow mode for 40 min.
- Add the protein (here, AnxA2) to the running buffer containing Ca2+ (see step 3.5). Perform the application of the protein in a loop-flow mode until an equilibrium steady state is reached (step 3 in Figure 1, Figure 2, and Figure 3).
NOTE: The protein concentration may range from 1 to 400 nM. Protein adsorption results in a concentration-dependent frequency shift reflecting the mass (protein) adsorption. - Dissociate the bound protein by chelating Ca2+ ions with 5 mM EGTA in the running buffer in open flow mode (step 4 in Figures 1 and Figure 2).
NOTE: A recovery of the frequency and dissipation to the SLB baseline indicates total reversibility of protein binding. Association-dissociation cycles can be repeated to compare different concentrations or proteins.
Subscription Required. Please recommend JoVE to your librarian.
Representative Results
Table 1: Lipid composition and formation data of the SLB
| Composition | ΔΔF/Hz after formation of SLBs | ΔΔD*10-6 after formation of SLB |
| POPC/POPS(80 : 20) | 26.3 ± 0.2 | 0.26 ± 0.03 |
| POPC/PI(4,5)P2(95 : 5) | 26.5 ± 0.5 | 0.31 ± 0.02 |
| POPC/POPS/Chol(60 : 20 : 20) | 29.2 ± 0.2 | 0.45 ± 0.09 |
| POPC/POPS/ PI(4,5)P2/Chol(60 : 17 : 3 : 20) | 29.6 ± 0.6 | 0.43 ± 0.10 |
| POPC/DOPC/POPS/ PI(4,5)P2/Chol(37 : 20 : 20 : 3 : 20) | 29.4 ± 0.4 | 0.39 ± 0.14 |
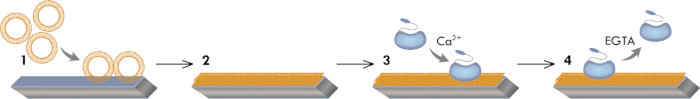
Figure 1: Graphical model of the experimental workflow. This workflow illustrates the vesicle absorption to the hydrophilic sensor surface (step 1), the vesicle fusion/rupture leading to the SLB formation (step 2), and the Ca2+-dependent adsorption (step 3) and EGTA-dependent desorption of AnxA2 (step 4).

Figure 2: Exemplary recording. These panels show (A) the time-dependent monitoring of the 7th overtone resonance frequency and (B) the dissipation shifts of the quartz sensors during measurement. The application of the liposomes causes a rapid drop in the frequency baseline, whereas the dissipation baseline increases (step 1). The stabilization of the baselines indicates the formation of the bilayer (step 2). The AnxA2 (200 nM) adsorption (in the presence of Ca2+) onto the POPS-containing lipid bilayer adds mass without significantly changing the dissipation, indicating that the lipid film is not perturbed (step 3). The recovery of the frequency baseline upon Ca2+ chelation with EGTA indicates the total desorption of the protein (step 4).

Figure 3: Negative control experiment, demonstrating that AnxA2 does not bind to SLBs in the absence of POPS. These panels show the addition of liposomes and the SLB formation (steps 1 and 2). No changes in (A) frequency or (B) dissipation are apparent after the addition of AnxA2 (step 3; 200 nM, in the presence of Ca2+) or EGTA (step 4).
Subscription Required. Please recommend JoVE to your librarian.
Materials
| Name | Company | Catalog Number | Comments |
| Chemicals | |||
| Calcium chloride | Merck | 017-013-00-2 | 99% |
| Chloroform | Roth | 4432.1 | 99% |
| DOPC | Avanti | 850375P | |
| EGTA | PanReac AppliChem | A0878 | 99% |
| HEPES | PanReac AppliChem | A1069 | |
| Methanol | PanReac AppliChem | A3493 | |
| PiP2 | Avanti | 850155P | |
| POPC | Avanti | 850457P | |
| POPS | Avanti | 840034P | |
| Sodium chloride | PanReac AppliChem | A1149 | |
| SDS | Roth | 183 | |
| Trisodium citrate | PanReac AppliChem | A3901 | |
| Equipment | |||
| Extruder Liposofast | Avestin | ||
| Qsense E4 Analyzer | Qsense | ||
| QSense Dfind | Qsense | ||
| Pump IPC 4 | Ismatec | ISM 930 | |
| QSX 303 SiO2 Silicon dioxide 50nm | Qsense | QSX 303 | |
| PC Membranes 0.05μm | Avanti polar lipids | 610003 | |
| OriginPro | OriginLab Corporation | Version 8 and 9 |
