

Summary
The indirect immunofluorescence protocol described in this article allows the detection and the localization of proteins in the mouse mammary gland. A complete method is given to prepare mammary gland samples, to perform immunohistochemistry, to image the tissue sections by fluorescence microscopy, and to reconstruct images.
Abstract
Indirect immunofluorescence is used to detect and locate proteins of interest in a tissue. The protocol presented here describes a complete and simple method for the immune detection of proteins, the mouse lactating mammary gland being taken as an example. A protocol for the preparation of the tissue samples, especially concerning the dissection of mouse mammary gland, tissue fixation and frozen tissue sectioning, are detailed. A standard protocol to perform indirect immunofluorescence, including an optional antigen retrieval step, is also presented. The observation of the labeled tissue sections as well as image acquisition and post-treatments are also stated. This procedure gives a full overview, from the collection of animal tissue to the cellular localization of a protein. Although this general method can be applied to other tissue samples, it should be adapted to each tissue/primary antibody couple studied.
Introduction
The mammary gland is an atypical mammalian exocrine organ whose main function is to produce milk to feed newborns. The development of the mammary tissue occurs mainly after birth and is characterized by a unique process in which the epithelium invades the surrounding stroma. This tissue undergoes many changes (growth, differentiation and regression), especially during the adult life, concomitantly with variations in reproductive status (Figure 1). In addition to the overall morphology of the tissue, the proportions of different cell types as well as their arrangement within the mammary gland dramatically change during development1-5.
During embryonic life, the mammary epithelium derives from mammary milk lines, which is defined by a slight thickening and stratification of the ectoderm, between the fore and hind limbs on each side of the midline around embryonic day 10.5 (E10.5) (Figure 1A). On E11.5, the milk line breaks up into individual placodes, which are symmetrically positioned along the mammary milk line at reproducible locations, and the surrounding mesenchyme starts to condense. The placodes begin to sink deeper into the dermis and the mammary mesenchyme organizes in concentric layers around the mammary bud (E12.5-E14.5). As of E15.5, the mammary epithelium, starts to proliferate and elongate to form the primary sprout that pushes through the mammary mesenchyme towards the fat pad. The primary sprout develops a hollow lumen with an opening to the skin, marked by the formation of the nipple sheath. On E18.5, the elongating duct has grown into the fat pad and has branched into a small arborized ductal system encompassed in the fat pad. Development is essentially arrested and the rudimentary mammary gland remains morphogenetically quiescent until puberty. In the male embryo, the activation of androgen receptors leads to the degeneration of the buds, which disappear by E15.5. As of E18, mammary development ceases until puberty6-9.
At birth, the mammary gland harbors a rudimentary ductal system that elongates and branches slowly (isometric growth). At the onset of puberty, spherical structures located at the tips of the ducts called the terminal end buds (TEBs), are formed of an outer layer of cap cells and a multilayered inner core of cells (body cells). These structures are highly proliferative and infiltrate the surrounding stromal tissue in response to hormonal cues. Proliferation within the TEBs results in ductal elongation, coupled with branching morphogenesis. This process leads to the establishment of a basic epithelial arborized network emanating from the nipple (Figure 1B, puberty). At ~10-12 weeks after birth, when the epithelium has invaded the whole fat pad, its expansion stops and the TEBs disappear. Ductal development then undergoes dynamic changes, i.e., successive proliferation and regression of epithelial cells according to estrous cycles10 (Figure 1B, adult).
From the onset of gestation, the mammary tissue undergoes important growth and morphological changes to prepare for lactation. The mammary epithelium extensively proliferate and differentiate, leading to a highly branched tubulo-alveolar network. Concomitantly, mammary epithelial cells (MECs) become polarized and able to synthesize and secrete milk products. MECs organize into numerous alveolar structures (acini) that are surrounded by contractile myoepithelial cells and incorporated in a stroma composed of connective and adipose tissues, blood vessels and nerve terminals (Figure 1B, pregnancy). Furthermore, the basal side of MECs is in close contact with the basement membrane (extracellular matrix), and interactions between these two entities tightly regulate both morphogenesis and secretory function of the mammary epithelium11-13.
All these processes rely on the action of various environmental cues, of which the most important are hormones14, paracrine factors and the extracellular matrix. For example, progesterone induces extensive side-branching15 and alveologenesis that, in combination with prolactin (PRL)16,17, promotes and maintains the differentiation of the alveoli. In addition to steroids and PRL18, cytokines and signaling pathways associated with development (Wnt and Notch signaling pathways) are also involved in mammary lineage commitment and development19-21. At the end of pregnancy, the luminal MECs begin to produce a protein-rich milk known as colostrum in the lumen of the alveoli. In addition, progesterone acts on the epithelial permeability and since the tight junctions are still open, colostrum is also found in the maternal blood stream.
After parturition, the mammary epithelium takes up almost all of the mammary gland volume and is highly organized (Figure 2, mammary epithelium). Milk-producing units, namely alveoli (Figure 2, alveolus), are formed by a monolayer of polarized mammary epithelial secretory cells (MESCs), with their apical plasma membrane delimiting the lumen. Alveoli arrange themselves into lobules that are grouped into lobes connected to ducts that drain milk to the outside milieu (Figure 2, lobe). Lactation occurs, i.e., MESCs start to secrete abundant amounts of milk, primarily triggered by the drop in placental hormones (mainly progesterone) (Figure 1B, lactation). Milk protein genes are activated in a defined temporal time course ranging from pregnancy to lactation9,22,23, chiefly in response to pituitary PRL released at the time of suckling. Concomitantly, contacts between MESCs and the extracellular matrix both stimulate milk protein synthesis through signals that are mediated via the interactions between cellular integrins and laminin24,25, and suppress apoptosis in MESCs26,27. These signaling pathways result in the activation of milk protein gene promoters28 through the activation of specific transcription factors29. Cell-cell contacts are also important for some aspects of differentiation including the establishment of apical polarity and the vectorial secretion of milk products. Tight junctions rapidly close after the beginning of lactation and MESCs finely orchestrate the uptake of molecules from the blood as well as the synthesis, transport and secretion of milk components, in response to the nutritional requirements of neonates. At the time of suckling, the contraction of the myoepithelial cells surrounding the alveoli occurs in response to oxytocin and leads to milk ejection through the ducts and into the nipple. Milk is a complex fluid that contains proteins (mostly caseins), sugars (mainly lactose), lipids and minerals, as well as bioactive molecules such as immunoglobulins A (IgA), growth factors and hormones. Caseins are synthesized, assembled in supramolecular structures, namely casein micelles, transported along the secretory pathway, and then released by exocytosis, i.e., the fusion of casein-containing secretory vesicles (SVs) with the apical plasma membrane of MESC (Figure 2).
Intracellular traffic relies on material exchanges between membranous compartments and involves Soluble N-ethylmaleimide-Sensitive Fusion (NSF) Attachment Protein (SNAP) Receptor (SNARE)30,31. The SNARE proteins family is subdivided in vesicular SNAREs (v-SNAREs), present in the vesicle membrane, and target SNAREs (t-SNAREs), localized on the target membranes. By zipping through their coiled-coil domains, v- and t-SNAREs assemble to form a highly stable four-helix bundle complex, referred to as the SNARE complex. This complex promotes the fusion of two opposing lipid bilayers by gradually bringing them into close proximity30,32. Afterwards, SNARE complexes are dissociated by the NSF adenosine triphosphatase and its adaptor protein SNAP and SNARE proteins are recycled back to their compartment of origin33. Interestingly, each SNARE protein predominantly resides in distinct cellular compartments and SNARE pairing may contribute to the specificity of intracellular fusion events34. Previous studies suggest that at least Synaptosomal-Associated Protein 23 (SNAP23) and Vesicle-Associated Membrane Protein 8 (VAMP8), and syntaxins (Stx) -7 and -12 play a role in casein exocytosis 35,36. These proteins have also been found in association with the lipid fraction of milk, i.e., milk fat globules (MFGs)37. The current prevailing model postulates that cytoplasmic lipid droplets (CLDs) are formed by the accumulation of neutral lipids (mainly triacylglycerols and sterol esters) and cholesterol derived from the maternal diet between the two leaflets of the endoplasmic reticulum (ER) membrane38-41. Large CLDs are formed, at least in part, by the fusion of smaller CLDs while being transported to the apical side of MESCs where they are released as MFGs (1-10 µm in diameter) by budding, being enwrapped by the MESC apical plasma membrane40-42. Lactation ceases after pups are weaned and the MESCs progressively die by apoptosis, leading to the regression of the mammary tissue back to a pubertal state (Figure 1B, involution).
Immunofluorescence (IF) is a common analytical laboratory method used in almost all aspects of biology, both in research and in clinical diagnostics. IF techniques can be performed on tissue sections (immunohistochemistry, IHC) or cell (immunocytochemistry, ICC) samples. This powerful approach relies on the use of fluorescent-labeled antibodies that specifically bind (directly or indirectly) to the antigen of interest, thus allowing the visualization of its tissue distribution through fluorescence microscopy. Fluorescence signals mostly depend on the quality and concentration of the antibodies and proper handling of the specimen. A simple indirect immunofluorescence (IIF) protocol is presented to detect milk products (caseins and MFGs) and proteins involved in milk product secretion (butyrophilin (BTN1), SNARE proteins) on frozen sections of mouse mammary tissue (Figure 3). While this protocol provides a complete IHC overview, ranging from tissue collection to image post-treatment, critical and optional steps as well as some technical recommendations are also presented and discussed.
Subscription Required. Please recommend JoVE to your librarian.
Protocol
CD1 mice were bred at INRA (UE0907 IERP, Jouy-en-Josas, France). All ethical aspects of animal care complied with the relevant guidelines and licensing requirements laid down by the French Ministry of Agriculture. The procedures used were approved by the local ethics committee (agreement 12/097 from the Comethea Jouy-en-Josas/AgroParisTech).
1. Mammary Gland Sample Preparation
- Mouse mammary gland dissection
- Euthanize mice at day 10 of lactation by cervical dislocation and pin the animal down with its abdomen facing up.
- Wet the ventral area with ethanol and dry it with a paper towel.
- Using forceps, pull up the abdominal skin between the two hind legs and make an incision (through the skin only) of about 1 cm with sharp scissors. Starting from this first incision, then use scissors to cut the skin up to the neck on the mouse. Pull the skin away from the peritoneum and pin down one side of the skin at a time, stretching it taught.
- Collect the abdominal and the inguinal mammary glands by pushing them away from the skin with a swab and finally pulling or cutting them away from the peritoneum.
Note: At this step Carmine staining can be performed in order to visualize the mammary epithelium within the entire gland43. This approach can be useful to analyze the global morphology of the mammary gland under various conditions (physiological developmental stages, diseases, in vivo treatments). - Remove the lymph node located at the junction of the abdominal and the inguinal glands44.
- Mammary tissue fixation
- Cut the mammary tissue into 3 mm3 fragments with a scalpel and immediately rinse these fragments in a phosphate buffered saline (PBS) solution, pH 7.4, in order to remove as much milk as possible.
- Quickly dry the fragments on a paper towel and put them in a cold PBS solution containing 4% paraformaldehyde (PFA, HCHO, 32% formaldehyde solution, CAUTION) for 10 to 15 min on ice.
Note: This is enough time to allow subsequent analysis on mammary tissue slices by IIF36 and/or in situ hybridization45. However, as aldehyde fixatives penetrate rather slowly in tissue pieces (~1-3 mm per hour), this time may be extended to ensure an optimal fixation of the tissue sample. Alternatively, fix tissues in vivo by perfusing an anesthetized animal with a fixative solution (not detailed in the present study).
- Sucrose infusion
- Quickly rinse the mammary fragments in cold PBS and immerse them in a cold PBS solution containing 40% sucrose (D-saccharose, C12H22O11, Mr 342.3 g/mol) for 16 to 48 hr at 4 °C under gentle shaking.
- Tissue embedding
Note: At this step, mammary fragments can be re-cut in order to make smaller fragments (2-3 mm3) or to adjust their shape.- Properly label the plastic molds and fill a third of the volume of the mold with OCT compound, maintained at RT. Place one fragment (2-3 mm3) of mammary tissue per mold and cover it with OCT compound.
- Place the molds at the surface of the liquid nitrogen (on a sheet of aluminum or using a metallic sieve) and allow the product to freeze.
Note: It must become solid and white before immersing the mold in liquid nitrogen.
- Store the frozen samples at -80 °C until tissue sections are performed.
2. Frozen tissue Sectioning
Note: A cryostat, which is essentially a microtome inside a freezer, is required to make frozen tissue sections. A lower temperature is often required for fat or lipid-rich tissues such as virgin mammary gland.
- Adjust the temperature of the cryostat to -26 °C and wait until it has stabilized. Maintain the frozen tissue block at -26 °C throughout the entire sectioning procedure. Absolutely avoid thawing the tissue at any time during the procedure.
- Cool the razor blade, the cutting support, the anti-roll device and the brush to -26 °C by placing them in the cryostat for at least 10 min. Also place a slide box inside the cryostat in order to be able to store glass slides as the sections are made.
- Properly label the glass slides that will be used to collect the tissue sections and maintain them at RT; otherwise tissue sections will not adhere to them. Remove the sample from the mold inside the cryostat.
Note: Using positively charged glass slides will greatly favor the adhesion of fresh frozen tissue sections due to higher electrostatic attraction. - Cover the surface of a metal tissue disc with OCT compound (maintained at RT) and push the frozen sample onto it. Place the wet mount inside the cryostat and let it cool for at least 15 min.
- Place the wet mount in the disc holder of the cryostat. Adjust the cut thickness to 5-6 µm and, if possible, use a new sharp blade or at least change the area on the blade used to cut each sample since some tissues will quickly dull it.
- Adjust the position of the anti-roll device over the razor blade by making cuts of the mounting medium until the slices are formed evenly and correctly. Ideally, the anti-roll device will step over the razor blade by about 1 mm.
- Once the settings are correct, perform tissue sections by turning the wheel in a continuous uniform motion. Unless the temperature is ideal, a tissue section will, by nature, try to curl up.
- Use a brush to grab and maneuver the section across the stage in order to place it as desired on the glass slide. Use the brush to clean up the remains possibly present on the frozen tissue block and/or the razor blade.
- Pull the tissue section toward the user and avoid pressing it onto the cryostat stage. Avoid pressing the tissue section onto the cryostat stage as it may lead to the adhesion of the tissue slice on the stage and thus the inability to recover it with the glass slide.
- Retrieve tissue sections one by one by picking them up at the surface of a glass slide, by holding it above the section and angling it down to touch the tissue section.
Note: Tissue sections quickly adhere to the warm glass due to static attraction. If several tissue sections are placed on the same slide, be careful not to overlap them and to space them enough to be able to individually enclose them in a hydrophobic circle (see section 3.1.1.).
3. Indirect Immunofluorescence
- Locating sections
- Use a hydrophobic barrier pen to draw a hydrophobic circle around slide-mounted tissue. Let the circle dry for approximately 1 min at RT. Draw a line around the tissue sections with a fine black permanent marker as well, but on the side of the glass slide opposite to the one where the tissue sections are.
Note: This circle is water-repellent and acetone- and alcohol-insoluble. It therefore provides a barrier to aqueous solutions used during the IHC procedure and reduces the volume of required reagents. - Rehydrate tissue sections by covering them with a drop of ~250 µl of PBS for a few minutes at RT. Fix tissue sections by covering them with ~250 µl of a freshly prepared 3% PFA solution in PBS for 10 to 15 min.
Note: Optionally in this case, use an aldehyde quenching solution (50 mM ammonium chloride (NH4Cl, Mr 53.5 g/mol) in PBS or 0.1M glycine (C2H5NO2, Mr 75.07 g/mol) in PBS) to stop the fixation reaction. Simple and abundant PBS washing is generally sufficient to remove unreacted aldehyde.
- Use a hydrophobic barrier pen to draw a hydrophobic circle around slide-mounted tissue. Let the circle dry for approximately 1 min at RT. Draw a line around the tissue sections with a fine black permanent marker as well, but on the side of the glass slide opposite to the one where the tissue sections are.
- Antigen retrieval (optional)
Note: While most antigens can be detected without antigen retrieval (AR), others will be observed only if this step is performed. In some cases, AR also allows the enhancement of the observed signal.- Place the AR solution (100 mM Tris (C4H11NO3, Mr 121.14) 5% urea (NH2CONH2, Mr 60.06) pH 9.6) in a beaker. The volume of AR solution must be sufficient to completely cover the glass slides placed in a glass holder.
- Preheat the AR solution to 95 °C by monitoring the temperature with a thermometer and then place the glass slides on a suitable rack, immerge the rack in the hot buffer, cover to limit evaporation and incubate for 10 min at 95 °C.
- Remove the beaker from the water bath and leave the glass slides for another 10 min in the buffer.
- Immunodetection
- Rinse tissue sections with PBS (~250 µl/section) and saturate them with a solution of 3% bovine serum albumin (BSA, ~250 µl/section) in PBS for at least 30 min at RT.
- Put 30-50 µl of the primary antibody diluted in PBS containing 2% BSA on each tissue section.
Note: This volume is enough to form a drop that completely covers the tissue section. - Place the same volume of the diluent (2% BSA in PBS) alone on a tissue section to perform a negative control without primary antibody.
- Systematically include this negative control in each IHC experiment and perform for each secondary antibody used to estimate the background of the experiment (non-specific labeling due to the secondary antibody and/or the tissue auto-fluorescence). Other types of positive or negative controls can also be performed to ensure the specificity of the labeling (see discussion).
- Place the glass slides in a humidified box O/N at 4 °C.
Note: Primary antibodies used were mouse monoclonal anti-cytokeratin 8 (CK8, 1:50 dilution), mouse monoclonal anti-cytokeratin 14 (CK14, 1:50 dilution), rabbit polyclonal anti-mouse casein (#7781, 1:50 dilution, generously provided by M.C. Neville, University of Colorado Health Sciences Center, CO, USA), rabbit polyclonal anti-BTN1 (1:300 dilution, generously provided by I.H. Mather, Department of Animal and Avian Sciences, University of Maryland, College Park, MD, USA), rabbit polyclonal anti-Stx6 (1:50 dilution, generously provided by S. Tooze, Cancer Research UK, London Research Institute, London, UK) and rabbit polyclonal anti-VAMP4 (1:50 dilution). - Thoroughly wash tissue sections with PBS at least four times for 10 min at RT.
- Dilute the appropriate secondary antibody (rhodamine-conjugated goat anti-rabbit IgG (H + L), 1:300 dilution) in PBS containing 2% BSA, place 30-50 µl of this solution on all tissue sections, and incubate for 1.5 hr at RT.
- Since fluorochromes are light-sensitive molecules, do not expose tissue sections to light until their analysis. For IIF on tissue sections, favor secondary antibodies coupled to a red fluorophore since cell membranes tend to generate a green auto-fluorescence that can interfere with low labeling. Moreover, choosing a red fluorophore-coupled secondary antibody allows the concomitant labeling of neutral lipids (see below).
- Thoroughly wash the tissue sections with PBS at least four times for 10 min at RT.
- Post-fixation (optional)
- For some experiments, perform post-fixation by incubating the samples with 2% PFA diluted in PBS for 10 min at RT in order to stabilize the antigen/antibody scaffolds. However, this step can be dispensed with in most cases.
- Neutral lipids and DNA counterstaining
- To visualize CLDs and MFGs, color neutral lipids by incubating tissue sections in 30-50 µl of a PBS solution containing 3 µg/ml of bodipy 493/503 for 10 min at RT. Rapidly rinse tissue sections twice with PBS.
- Counterstain nuclear DNA with 30-50 µl of a PBS solution containing 3 µM of DAPI (4-6-diamidino-2-phenylindole, 5 mg/ml stock solution) for 10 min at RT. Wash the tissue sections twice with PBS before mounting the slides for observation.
- Section mounting
- Remove PBS and place a drop of mounting medium on each tissue section.
- Place one side of the cover slip at an angle against the slide, making contact with the outer edge of the liquid drop and then lower the cover slowly, avoid air bubbles. Allow the liquid to spread between the glass slide and the cover slip for a few minutes and then remove the excess of mounting medium with a paper towel.
- Seal the cover slip to the glass slide with nail polish and store tissue sections at 4 °C to prevent their exposure to light until observation.
4. Fluorescence Observation and Image Acquisition
Note: A fluorescence microscope equipped with a camera controlled by image acquisition software is required to observe the IHC results.
- Before acquiring images, check the intensity of the labeling and evaluate the background of the experiment by looking at the negative controls. Acquire pictures of each fluorescent label (color channel) individually.
- Acquire all pictures, including those of the corresponding controls, in the same conditions (exposure and general settings) for each color channel.
- Conventional microscopy
- Perform epifluorescence microscopy with a microscope equipped with standard filters for fluorescein isothiocyanate (FITC, green), rhodamine (red) and DAPI (blue) emissions, ×20 to ×63 (oil-immersion, NA 1.3) objectives and a DP50 imaging camera.
- Confocal microscopy
- Perform confocal microscopy with a microscope equipped with the ZEN software, using ×20 to ×63 (oil-immersion, NA 1.4) objectives and the 488- and 568-nm excitation wavelengths of the laser.
5. Image Treatment
Note: All image post-treatments are performed using the ImageJ free software (http://imagej.nih.gov/ij/).
- Superimpose image (merge)
- Open the images acquired in each channel that will be combined (File/Open). If working with 8-bit grayscale images, attribute artificial color to each channel using the lookup table (Image/Lookup Tables).
- Generate the composite picture from grayscale or colored images by using the command “Merge channels” (Image/Color/Merge Channels) and then attributing a color to each channel.
- Perform image stacks superimposition in the same way by opening stacks acquired in each channel that will be combined (File/Open) and using the command “Merge channels” (Image/Color/Merge Channels) to attribute a color to each channel. Save the composite stack as an image sequence or as a movie (see section 5.4).
- Image stack Z projection
- Use the Z projection function (Image/Stack/Zproject, Max Intensity) to provide a two-dimensional view of all the pictures of an image stack by projecting them along the axis perpendicular to the image plane (z-axis). The “Maximum Intensity” option creates an image in which each pixel contains the maximum value over all images in the stack. This generates a single image allowing the visualization of all the staining observed through the whole image stack for a particular channel or after the superimposition of several channels.
- Image stack 3D projection
- Use the 3D projection command (Image/Stack/3D project, Brightest Point, y-axis) to generate a sequence of projections of a rotating volume onto a plane. The visual rendering of surfaces and internal structures depends on both the projection method (nearest-point, brightest point (used here), or mean-value) and the visualization parameters selected. Each frame of the animated sequence is the result of projecting from a different viewing angle.
- Rotate the created 3D image around each of the three orthogonal axes (the y-axis was selected here). Save the sequence produced as a single image or a movie.
- Image stack to movie conversion
- Open an image stack (File/Open) and save it as a movie in .AVI format by using the command “AVI” (File/Save As/AVI).
Subscription Required. Please recommend JoVE to your librarian.
Representative Results
The mammary gland is a subcutaneous gland located along the ventral structure of both the thorax and the abdomen in rodents. The location of the five pairs of glands of the mouse during gestation is shown in Figure 4. The morphology of the mammary gland dramatically changes during its development, reflecting functional modifications required to prepare for full lactation (Figure 1B). In virgin or nulliparous animals, the mammary gland consists of a sparsely branched ductal epithelium embedded within a thin fatty stroma that may be difficult to see. From the onset of pregnancy, the mammary epithelium proliferates and expands, resulting in larger mammary glands that become easier to see and remove (Figure 4). During lactation, the mammary tissue is thicker and appears whiter due to the presence of milk. Only abdominal and inguinal mammary glands are collected because cervical and thoracic mammary glands are less easily removed due to their close association with muscles. For some experiments, pups can be separated from the lactating female 4-6 hr before sacrifice in order to limit milk secretion by MESCs46,47.
Identification of mammary myoepithelial and epithelial cells
Contractile myoepithelial cells surrounding the alveoli can be distinguished from luminal MESCs through the use of antibodies directed against markers specifically expressed by each of these cell types. In the mammary gland, the current markers used are cytokeratins (CKs). CKs are a large family of cytoplasmic proteins that polymerize to form cytoskeletal intermediate filaments (10 nanometers in diameter on average) found in epithelial tissues. The intermediate filaments are extremely stable and provide a mechanical support for cell architecture, and organize tissues by contributing to cell-cell adhesion and basal cell-connective tissue interactions. The subsets of CKs expressed by epithelial cells mainly depend on the type of epithelium, its stage of development and its differentiation status. Furthermore, this also applies to the malignant counterparts of the epithelia. Thus, these markers are simple and valuable tools to characterize cell populations in a tissue under physiological conditions and are used for tumor diagnosis and characterization in surgical pathology48.
In the normal mammary gland, myoepithelial and luminal MESCs cells can be distinguished based on their differential expression of CK14 and CK8, respectively (Figure 5). These cytoplasmic markers are detected in the mammary sections of lactating mice after PFA fixation and AR. Images were acquired with a conventional epifluorescence microscope. CK8 appears to be distributed throughout the cytoplasm of the luminal MESCs (Figure 5, CK8). Note that the red background observed for the negative control without primary antibody (Figure 5, -Ig1) is mostly due to the tissue section folding, as suggested by the blue DNA labeling, which displays several layers of nuclei (Figure 5, -Ig1, nuclei). CK14 is specifically observed in flat and elongated myoepithelial cells located at the base of the alveoli (Figure 5, CK14). Another common way to identify myoepithelial cells is to detect alpha-smooth muscle actin (a-SMA) present in these contractile cells (see Figure 4 in49).
Detection of mouse milk products
After parturition, the fully differentiated MESCs begin to produce abundant amounts of milk. Milk components are secreted by distinct pathways40,50. Casein micelles are secreted by exocytosis of Golgi-derived SVs, whereas lipids are released as MFGs by the budding of the apical plasma membrane of MESCs (Figure 2, mammary epithelial secretory cell). For some experiments, the pups are separated from the female 4-6 hr before collecting the mammary glands, in order to slow down milk secretion46,47. Under these conditions, the apical plasma membrane of MESCs and the content of the lumen can be easily observed, which is not the case during suckling since alveoli are contracted and the lumen are closed. Moreover, slowing down the secretion is also essential when studying proteins involved in membrane trafficking such as SNAREs. Indeed, SNAREs cycle between donor and acceptor compartments and their subcellular localization is difficult to determine since labeling is often diffused when membrane turnover is high, i.e., during suckling. Therefore, slowing down the milk secretion by removing the pups provides proper conditions to study the intracellular localization of SNAREs when the t- and v-SNAREs preferentially reside in the donor and acceptor compartment, respectively (see below).
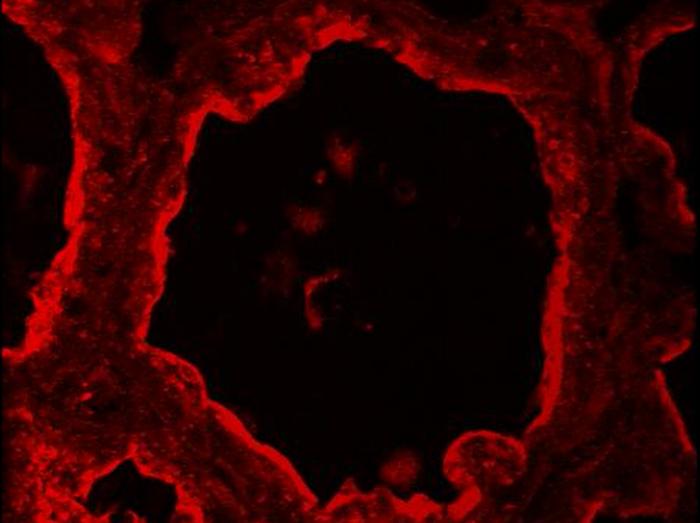
Figure 6 shows the localization of caseins in the lactating mouse mammary gland at day 10 of lactation, in the presence (Figure 6, +p) or in the absence (Figure 6, -p) of pups. Tissue sections were observed both by conventional epifluorescence microscopy (the three columns on the right) and confocal microscopy (Figure 6, left column). During suckling, caseins appear to be mostly accumulated in the apical region (Figure 6, +p, arrowheads). Confocal microscopy reveals that caseins are also present, although to a lesser extent, at the basal side of MESCs in the presence of pups (Figure 6, +p, arrows), which cannot be clearly observed in conventional microscopy (Figure 6, caseins, compare left and right panels). Indeed, in wide-field epifluorescence, the fluorescence emitted by the sample (background fluorescence) passes through the excited volume and alters the resolution of the objects observed in the objective focal plane (out-of-focus fluorescence). This is especially true for thick specimens (thicker than 2 µm). Confocal microscopy allows to obtain high-quality images from specimens prepared for epifluorescence, as the depth of the field can be controlled and background fluorescence excluded from the focal plane. Furthermore, in the presence of pups (Figure 6, +p), the lumen of the alveoli are quite closed and the apical side of MESCs is better observed in the absence of pups (Figure 6, -p), when the lumen of the alveoli is dilated due to the accumulation of milk products. When milk secretion is slowed down, caseins also appear accumulated beneath the apical plasma membrane (Figure 6, -p, arrowheads), and are clearly observed at the basal side of MESCs (Figure 6, -p, arrows). Negative controls without primary antibody did not show any labeling (Figure 6, -Ig1).
Milk products can be easily co-detected by combining IHC for caseins and neutral lipid counterstaining of CLDs and MFGs (Figure 7). Tissue sections were imaged as Z-stacks by confocal microscopy, which were post-treated with ImageJ to produce Z projections or 3D projections for each (Figure 7, caseins, lipids) or all color channels (Figure 7, merge). The image sequences produced have been saved as single images (Figures 7 and 8) or movies (see Supplementary Movies).
Although some labeling was observed on their basal side, caseins were mostly accumulated on the apical side of MESCs (Figure 7, +p), as already described when females were not previously separated from pups (Figure 6, +p). CLDs are also mainly localized in the apical region of MESCs, whereas larger secreted MFGs are present in the lumen of the alveoli. Note that caseins and MFGs are easily visualized in the lumen of alveoli in the absence of pups (Figure 7, compare +p and –p). Caseins do not co-localize with CLDs or MFGs in any of these conditions since the superimposition of the two color channels does not produce yellow labeling (Figure 7, merge pictures). However, image stack post-treatments show that caseins surround the secreted MFGs in the lumen of the alveoli, suggesting that these proteins may interact with the MFG (Figure 7, merge pictures). Note the difference of the images produced by each post-treatment used (Figure 7, compare Zproj and 3D proj for each color channel).
Detection of butyrophilin, a protein marker of MFGs.
BTN1 is one of the major proteins associated with MFGs in milk51. This transmembrane protein is mainly localized at the apical plasma membrane of the MESCs and is consequently found at the surface of the MFG after its release by budding52. Figure 8 shows that at day 10 of lactation, BTN1 is mainly localized at the apical plasma membrane and, to a lesser extent, in the apical region of MESCs. BTN1 also surrounds the MFGs present in the lumen of alveoli as well as some of the apical CLDs (Figure 8, 3D proj merge, arrowheads). Results are shown as a single image extracted from the acquired image Z-stack (Figure 8, image) or as a 3D view generated with the 3D projection command of ImageJ, as described above (Figure 8, 3D proj). Note that a single image can be sufficient to observe the apical distribution of the protein, but the spatial association of BTN1 with secreted MFGs or apical CLDs is only observed after 3D reconstruction of the Z-stack (Figure 8 compare BTN1 image and 3D proj merge pictures). The Z-stack can also be reconstructed as a movie to give a better spatial view of the distribution of the protein. The image Z-stack acquired for BTN1 alone (Supplementary movies 1 and 3) or superimposed with the two other color channels (merge, Supplementary movies 2 and 4) are shown as examples. The Z-stack can be read image-by-image from the top to the bottom (Supplementary movies 1 and 2) or as a rotating view (y-axis) of the 3D projection of the whole image stack (Supplementary movies 3 and 4).
Detection of two SNARE proteins: Stx6 and VAMP4
As previously mentioned, SNAREs are membrane-bound proteins that cycle between donor and acceptor membranes. It is therefore better to slow down membrane turnover associated with the high secretory activity of MESCs by separating the females from pups before collecting the mammary gland when studying these proteins. Stx6 and VAMP4 have both been described as being associated with the trans-Golgi network53,54. However, these SNARE proteins may also play an important role at the level of other cellular compartments such as the secretory granules (Stx6)55,56 and the Golgi apparatus (VAMP4)57. Previous studies suggest that SNARE proteins play a role in casein secretion35,36 . During lactation, Stx6 and VAMP4 are located in the sub-apical region of MESCs. Stx6 is observed between the nucleus and the apical membrane of MECs, corresponding to the Golgi and the trans-Golgi network (Figure 9, Stx6), and is also present, although to a lesser extent, on casein-containing SVs36. VAMP4 is also localized in the sub-apical region of MESCs, but the labeling appears to be more punctate and is accumulated beneath the apical plasma membrane (Figure 9, VAMP4) due to its association with both CLDs and casein-containing SVs36. Negative control without primary antibody did not give rise to any labeling.

Figure 1. Mouse mammary gland development during embryonic and adult life. (A) The mouse mammary glands start to develop around embryonic day 10 (E10) from the ectodermal (light blue) milk lines (pink). At E11.5, placodes form symmetrically along the mammary milk line and the surrounding mesenchyme (dark blue) starts to condense. The placodes invaginate to form buds (E12.5-E14.5) and, on E15.5, the mammary epithelium (pink), proliferate and elongate to form the primary sprout that pushes through the mammary mesenchyme towards the fat pad (light green). A hollow lumen forms and opens to give rise to the nipple (purple). On E18.5, the mammary epithelium forms a rudimentary branched structure connected to the outside. Adapted from 6 by permission from Macmillan Publishers Ltd: Nature Reviews Genetics, copyright 2007. (B) During puberty, the mammary epithelium (purple) enters a significant growth phase (extensive elongation, bifurcation and lateral branching). At the onset of gestation, extensive and rapid proliferation as well as side branching occur, leading to the considerable expansion of the mammary epithelium, which fully invades the whole mammary fat pad. The mammary epithelium reaches a highly differentiated functional state during lactation when luminal MESCs secrete large amounts of milk. When lactation ceases after weaning, the mammary gland involutes. MESCs are removed by apoptosis and phagocytosis, leading to the disappearance of the lobulo-alveolar structures that are replaced by adipose tissue. Adapted from scheme 1 of http://brisken-lab.epfl.ch/research and chapter 2.2. http://tvmouse.ucdavis.edu/bcancercd/22/index.html. Please click here to view a larger version of this figure.
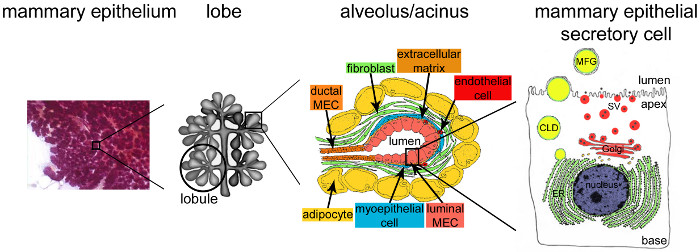
Figure 2. Architecture of the mammary gland during lactation. During lactation, the fully developed and highly branched epithelium (purple) accounts for the vast majority of the mammary tissue. The epithelial tissue is formed by tubulo-alveolar structures embedded in a stroma that contains various cell types (fibroblasts, adipocytes, smooth muscle cells, blood and lymphatic vessels and nerve endings). MESCs are organized into acinar structures or alveoli, assembled in lobules that form lobes. Each alveolus is a functional milk-producing unit that is connected to a highly branched network of lobular and interlobular channels, thus allowing the milk to be drained to the outside. Each alveolus is delimited by a monolayer of polarized MESCs, the apical side of which borders a central lumen. The basal side of the MESCs is in close contact with an extracellular matrix and contractile myoepithelial cells. Milk products are released at the apical side of MESCs. Major milk (caseins) are secreted as casein micelles (black points) by exocytosis of Golgi-derived secretory vesicles (SVs), while lipids are released as milk fat globules (MFGs) by budding of the apical plasma membrane of MESCs. CLD: cytoplasmic lipid droplet; ER: endoplasmic reticulum; MEC: mammary epithelial cell. Adapted from chapter 2.2. http://tvmouse.ucdavis.edu/bcancercd/22/index.html., Fig. 02 www.cellbiol.net/ste/alpHERCEPTIN1.php, Fig. 26-02 in 58, and from 50. Please click here to view a larger version of this figure.


Figure 3. Experimental procedure to perform indirect immunofluorescence on frozen sections of mouse mammary gland. The mammary gland is collected from a CD1 female mouse at day 10 of lactation. The mammary tissue is cut into small fragments that are fixed with paraformaldehyde and infused in sucrose before being embedded in OCT compound and snap-frozen. The mammary gland samples are then cut into thin frozen sections and processed for IIF by successive incubation with primary and fluorochrome-conjugated secondary antibodies, respectively. After mounting, samples are analyzed with a fluorescence microscope, allowing the acquisition of images that can subsequently be post-treated. Please click here to view a larger version of this figure.

Figure 4. Anatomical location of the mouse mammary glands. Left: ventral view of the mouse mammary system at the late gestation stage. Right: localization and aspect of the mammary gland at the late gestation stage in the mouse. Note that during lactation, the mammary glands are thicker and appear whiter due to the presence of milk in the alveoli. Adapted from http://ctrgenpath.net/static/atlas/mousehistology/Windows/femaleu/mousemammgldiagram.html and http://www.pathbase.net/Necropsy_of_the_Mouse/index.php?file=Chapter_3.html. Please click here to view a larger version of this figure.

Figure 5. Identification of luminal epithelial cells and basal myoepithelial cells in the mouse mammary gland. Luminal MESCs and myoepithelial cells are identified by IIF in the mouse mammary gland at day 10 of lactation, based on their expression of CK-8 and CK-14, respectively. Nuclear DNA was stained with DAPI (blue). Images were acquired with a conventional epifluorescence microscope. The composite picture (merge) shows the superimposition of the labeling corresponding to caseins (red) and nuclei (blue), respectively. -Ig1, negative control without primary antibody. Asterisks indicate lumens. Scale bar = 100 µm. Please click here to view a larger version of this figure.

Figure 6. Cellular localization of caseins in the mouse mammary gland. Caseins are detected by IIF in the mouse mammary gland at day 10 of lactation. The mammary gland was collected from females in the presence (+p) or in the absence (-p) of pups. Images were acquired with a conventional (right panel, caseins, nuclei and merge) or a confocal (caseins (red), left panel) fluorescence microscope. In both conditions, caseins (red) are detected in the apical region (arrowheads) and more or less at the basal of MESCs (arrows). Negative controls without primary antibodies do not show any labeling (-Ig1). Nuclear DNA is stained with DAPI (blue). The composite picture (merge) shows the superimposition of the labeling corresponding to caseins (red) and nuclei (blue), respectively. Asterisks indicate lumens. Scale bar = 100 µm for epifluorescence images (right panel, caseins, nuclei, merge) and = 10 µm for confocal images (left column). Please click here to view a larger version of this figure.
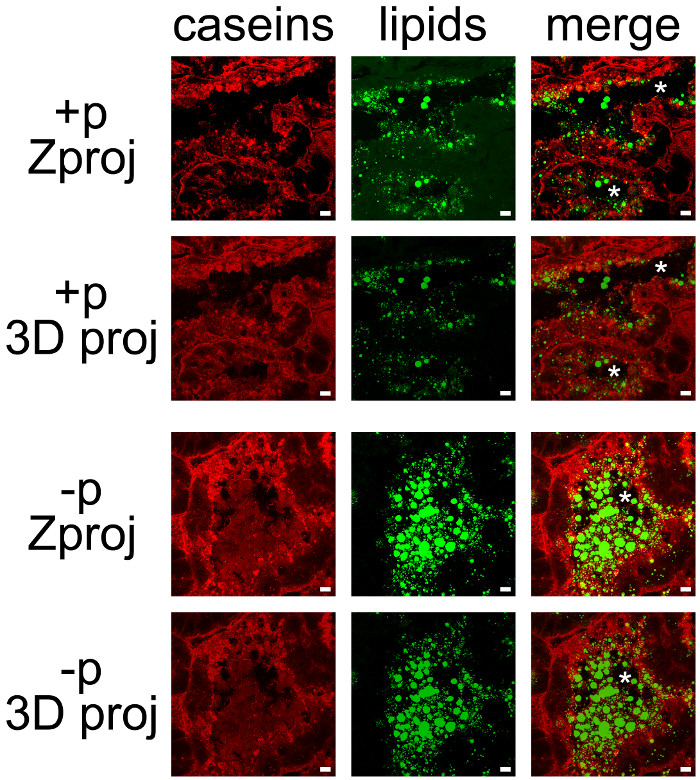
Figure 7. Cellular localization of milk products in the mouse mammary gland. Caseins (red) are detected by IIF in the mouse mammary gland at day 10 of lactation in the presence (+p) or in the absence (-p) of pups. Neutral lipids (CLDs and MFGs) are counterstained with bodipy 493/503 (green). The composite pictures (merge) show the superimposition of the two labelings. Images were acquired as Z-stacks with a confocal microscope. Z-stacks were post-treated with ImageJ to generate Z projections (Zproj) or 3D projections (y-axis) (3D proj) of the whole stacks in each channel for both (merge). Asterisks indicate lumens. Scale bar = 10 µm. Please click here to view a larger version of this figure.

Figure 8. Cellular localization of butyrophilin and lipids in the mouse mammary gland. BTN1 (red) is detected by IIF in mouse mammary gland at day 10 of lactation in the absence of the pups. Neutral lipids (CLDs and MFGs) and nuclear DNA are counterstained with bodipy 493/503 (green) and DAPI (blue), respectively. Images were acquired with a confocal microscope as image Z-stacks. Results are shown as a single image extracted from the image stack (image, BTN1, lipids, nuclei and merge) or after post-treatment with ImageJ to generate a 3D view (y-axis) of the whole image stack (3D proj, BTN1, lipids, nuclei, merge). The composite pictures (merge) show the superimposition of the three color channels. -Ig1, negative control without primary antibody. Asterisks indicate lumens. Scale bar = 10 µm. Please click here to view a larger version of this figure.

Figure 9. Cellular localization of two SNARE proteins in the mouse mammary gland. Syntaxin 6 (Stx6) and VAMP4 (V4) are detected by IIF in the mouse mammary gland at day 10 of lactation. Images were acquired with a conventional (conv) epifluorescence or a confocal (LSM) microscope. The composite pictures (merge) show the superimposition of the labeling observed for each SNARE protein (red) and for nuclear DNA counterstained with DAPI (false green color), respectively. -Ig1, negative control without primary antibody. Asterisks indicate lumens. Scale bar = 10 µm for confocal pictures and = 100 µm for epifluorescence pictures. Please click here to view a larger version of this figure.


Table 1. Immunohistochemistry troubleshooting guide.

Supplementary movie 1. Localization of butyrophilin in the mouse mammary gland. BTN1 (red) is detected by IIF in the mouse mammary gland at day 10 of lactation. Images were acquired with a confocal microscope as a Z-stack and post-treated with ImageJ to generate a movie. The Z-stack is read from the top to the bottom. Please click here to view this video.

Supplementary movie 2. Localization of butyrophilin and neutral lipids in the mouse mammary gland. BTN1 (red) is detected by IIF in mouse mammary gland at day 10 of lactation. Neutral lipids (CLDs and MFGs) and nuclear DNA are counterstained with bodipy 493/503 (green) and DAPI (blue), respectively. Images were acquired with a confocal microscope as a Z-stack for each color channel and were post-treated with ImageJ to generate a composite Z-stack that superimposes the three color channels. The resulting composite Z-stack is read from the top to the bottom. Please click here to view this video.
Supplementary movie 3. Localization of butyrophilin in the mouse mammary gland. BTN1 (red) is detected by IIF in the mouse mammary gland at day 10 of lactation. Images were acquired with a confocal microscope as a Z-stack and post-treated with ImageJ (3D projection) to generate a rotating (y-axis) spatial view of the BTN1 labeling. Please click here to view this video.

Supplementary movie 4. Localization of butyrophilin and neutral lipids in the mouse mammary gland. BTN1 (red) is detected by IIF in the mouse mammary gland at day 10 of lactation. Neutral lipids (CLDs and MFGs) and nuclear DNA are counterstained with bodipy 493/503 (green) and DAPI (blue), respectively. Images were acquired with a confocal microscope as a Z-stack for each color channel and were post-treated with ImageJ to generate a composite Z-stack that superimposes the three color channels. ImageJ (3D projection) was further used to generate a rotating (y-axis) spatial view of the composite Z-stack. Please click here to view this video.
Subscription Required. Please recommend JoVE to your librarian.
Discussion
IHC is a relatively simple and straightforward experimental method to localize antigen in tissue sections, which depends primarily on specific epitope-antibody interactions. Although a large number of protocols are used to localize a protein by IIF, the core of these procedures is almost always the same. However, there are some critical aspects that can strongly influence the result and must therefore be optimized for each individual IHC study. The most challenging aspect of this approach is to determine the best experimental conditions, i.e., those generating a strong and specific signal for the antigen of interest. The variables that must be considered for experimental design and optimization are: (1) the type of antigen (species, expression levels, subcellular location); (2) the epitope type (sequence, conformation, putative post-translational modifications); (3) sample preparation (embedding in paraffin or for frozen sections); (4) the fixation method (perfusion or immersion); (5) the fixative used (formaldehyde, alcohol or acetone); (6) the blocking reagent used (normal serum, BSA or non-fat milk); (7) the AR step; (8) the detection method (direct or indirect); (8) the type of primary antibody (monoclonal or polyclonal); (9) the secondary antibody (species and label); (10) counterstains (nuclear and/or other cellular compartment labeling); and (11) the mounting medium (see Table 1 for details). The fixation and the blocking steps, at least, require the optimization of additional factors such as concentration, pH, temperature, incubation time and diluent.
The first crucial aspect concerns the preparation of tissue samples, which is closely linked to the fixation method, which in turn influences the quality of the results. For example, tissue pieces can be fixed or not prior to embedding. This step may also depend on the embedding method chosen, i.e., OCT compound vs. paraffin embedding, which itself sometimes depends on the primary antibody used. Tissue fixation can be performed in vivo by perfusing an anesthetized animal with a fixative solution. This method is useful to preserve antigens when studying intact tissues but may not be sufficient to fix the tissue of interest. In this case, small tissue pieces (no thicker than 10 mm) can be immersed in the fixative solution. Frozen tissue can be prepared by immersing the tissue in liquid nitrogen or isopentane, and snap-freezing is highly recommended for the subsequent detection of post-translational modifications such as phosphorylation. However, unlike paraffin-embedded tissue, freezing is not adequate for long-term preservation of the tissues due to the formation of ice crystals within the cells that may alter subcellular morphology. Once cut, frozen tissue sections can be stored at -80 °C for up to 1 year. In any case, the preparation of the tissue samples is a compromise between preserving the tissue/cellular architecture and preserving the epitope integrity.
Since it alters the chemical composition of tissues, it is critical to optimize the fixation conditions to avoid both incomplete (underfixation) and excessive (overfixation) fixation.
Indeed, underfixation may reduce the specific signal by promoting the proteolytic degradation of certain antigens. On the other hand, overfixation can alter the specific labeling by masking the epitope or generating a strong non-specific background. Thus, in addition to the choice of the fixative solution, other parameters such as the incubation time, the temperature and the pH will affect tissue fixation. Although PFA is the most common fixative used for IHC, it cannot be considered as a “universal” fixative. PFA induces protein-protein and protein-nucleic acid cross-links and can thus artefactually modify the epitope (overfixation) and then prevent its recognition by the primary antibody. However, the epitope can be further unmasked by AR techniques (see below). PFA may also be unsuitable for the detection of certain antigens, as it has been shown to induce the translocation of some phosphorylated proteins from the membrane to the cytoplasm. In such cases, PFA must be replaced by appropriate alternative fixatives such as alcohol. Unlike PFA, alcohols such as methanol or ethanol do not mask epitopes since they allow tissue fixation by replacing water molecules in tissues. This can lead to the precipitation of the proteins and then prevent antibody/epitope interaction due to conformational changes. It is widely thought that alcohols do not penetrate and thus do not preserve tissue morphology as well as PFA. Acetone is another alternative fixative, which is commonly used when working with unfixed, snap-frozen tissue sections. However, acetone is a strong dehydrating agent and can lead to irreversible precipitation of tissue proteins.
For some antigens, an additional step of AR may be required to obtain a good signal, mainly if the fixative induces the conformational change or alters the electrostatic charge of the epitope (masking of the epitope). AR methods aim to reverse these processes to restore the immunoreactivity of the epitope and its subsequent interaction with the primary antibody. AR methods mainly rely on two approaches: (1) protease-induced epitope retrieval, i.e., with enzymes such as proteinase K, trypsin or pepsin, which cleave peptides that mask the epitope; and (2) heat-induced epitope retrieval, i.e., using a microwave oven, pressure cookers, vegetable steamers, autoclaves or water baths. This latter approach is especially time-, temperature-, buffer-, and pH-sensitive, and the optimal conditions must be empirically determined (an example is provided in the Protocol section). Alternatively, the affinity of an antibody for its antigen can be enhanced by changing the pH or the cation concentration of the antibody diluent.
A permeabilization step is sometimes required to obtain a good signal for an intracellular epitope in thick tissue sections, particularly for nuclear antigen staining. This can be achieved in various ways by using: (1) alcohols or acetone as fixatives; or (2) detergents such as Triton, NP-40 (0.1-0.2% in PBS, 10 min), digitonin, saponin or Tween 20 (0.2-0.5% for 10 to 30 min) after PFA fixation. However, the choice of the detergent depends on the cellular location of the epitope detected. Indeed, harsh detergents such as Triton-X100, which solubilize cellular membranes, are suitable for nuclear epitope detection but can lead to signal alteration upon the extraction of some membranous proteins. The use of milder detergents (saponin and Tween 20) are more suitable for the detection of cytoplasmic epitopes.
The second critical step is the blocking of non-specific staining. The binding of an antibody to its target epitope is governed by intermolecular forces (e.g., hydrophobic and ionic interactions, hydrogen bonding). Thus, interactions of primary and/or secondary antibodies with other proteins than their target antigens may result in non-specific staining. This generates high fluorescence background, which prevents the visualization of the protein of interest (low signal/noise ratio). Blocking reagents reduces non-specific interactions without impairing specific antibody/epitope interaction. A common procedure consists of incubating tissue sections with heat-inactivated normal serum or BSA. When using a normal serum, it must be from the same species as that of the host animal of the secondary antibody or from an unrelated species. In all cases, the selected blocking reagent must also be added to the diluents for the primary and secondary antibodies. Furthermore, the use of non-ionic detergents such as Triton X-100, Tween 20 or saponin helps to reduce non-specific interactions.
The third and probably most important parameter is the primary antibody selection and optimization. Obviously, the best choice is a high-quality antibody with minimal cross-reactivity. As monoclonal antibodies usually exhibit high affinity and specificity for a single epitope, they are the best tools to discriminate a particular member of a protein family with high sequence identity. However, the antibody/epitope interaction can be compromised if the target epitope has lost its native conformational state or when the access to the epitope is prevented by interactions with other proteins, post-translational modifications, temperature, pH, fixation and salt concentration. In such cases, polyclonal antibodies are more suitable as they recognize multiple epitopes of the same protein. Moreover, they are often more stable than monoclonal antibodies over a wide range of pH and salt concentration. Preliminary studies have to define the appropriate incubation conditions, i.e., working dilution (monoclonal antibody: 5-25 mg/ml, polyclonal antibody: 1.7-15 mg/ml), incubation time, diluent and temperature, which have to be empirically determined for each primary antibody. These parameters have to be optimized to determine the conditions that produce the optimal signal with low background noise. The specificity of the labeling is favored by longer incubation times at lower temperatures (i.e., 4 °C vs. RT).
The choice to perform direct or indirect detection often depends on the level of antigen expression. For example, a highly expressed epitope can simply be detected with a fluorochrome-conjugated primary antibody, thus allowing a fast and simple multicolor staining while avoiding possible non-specific background due to the use of a secondary antibody. However, direct IF may generates a low signal at a higher cost, and can sometimes be difficult, when labeled antibody are not commercially available. Conversely, IIF is more sensitive to detect lower expressed epitopes as the generated signal is more intense due to the interaction of at least two labeled secondary antibodies (raised against the primary antibody host species) with the primary antibody (amplification). Furthermore, a wide range of secondary antibodies conjugated to various fluorophores are commercially available, relatively inexpensive, and quality controlled. However, this approach can induce cross-reactivity and thus requires to carefully choose primary antibodies that are not produced in the same species or of different isotypes when performing multiple-labeling experiments. IIF also sometimes requires extra blocking steps and must include systematic negative controls (see below). Amplification can be further achieved by using a biotin-conjugated secondary antibody and fluorescently labeled avidin or streptavidin (four biotins bound per molecule). Nevertheless, this amplification method requires additional steps to prevent non-specific binding and may not be adapted for the staining of some tissues (liver, kidney, heart, brain, lung and lactating mammary gland) due to the presence of high levels of endogenous biotin. However, endogenous biotin can be blocked by pre-incubating the sample with avidin and subsequently with biotin before incubation with the primary antibody. The choice of the conjugated fluorochromes, which are small chemical molecules with the property to emit light when excited by light of a shorter wavelength, primarily depends on the type of microscope equipment available.
When properly designed to limit both cross-reactivity between the antibodies and crossover between the spectral properties of the fluorochromes used, immunofluorescence-based IHC allows the simultaneous visualization of multiple cellular targets.
The last critical point regarding IHC experiments concerns the positive and negative controls that must be performed to support the validity of staining, to identify experimental artifacts and for the accurate interpretation of the results. Some tissues exhibit high fluorescent background (referred to as autofluorescence) that could lead to a misinterpretation of the results. Thus, tissue sections have to be observed under both fluorescence and bright-field illumination before starting the IHC experiment. A negative control that omits the primary antibody must systematically be included in each IHC experiment in order to ensure that a potential non-specific binding of the secondary antibody is negligible and does not obscure or resemble the specific staining pattern. An isotype control can be performed when working with a monoclonal primary antibody by replacing it with a non-immune antibody of the same isotype (e.g., IgG1, IgG2A, IgG2B, IgM) at the same concentration. This control helps to estimate the non-specific staining, which may be due to the interactions of antibodies with the sample. To demonstrate the specific binding of an antibody to its antigen, an absorption control can be achieved in two ways by pre-incubating the primary antibody: (1) with its soluble immunogen (10:1 molar ratio) O/N at 4 °C; and (2) with cells or tissue sections that express the epitope of interest but that differ from the studied tissue (for example, see Figure 4B in59). In both cases, the consequent depletion of the primary antibody should lead to little or no staining. Another type of control can be done using an irrelevant primary antibody, i.e., directed against an epitope that exhibits a cellular localization that is different from the epitope of interest (nuclear vs. cytoplasmic). The irrelevant antibody must be of the same isotype and species as the primary antibody of interest. Additional controls for IHC experiments can include the use of samples from tissues known to express (transgenic animals) or not (knock-out animals) the epitope of interest. This can provide a useful reference and help to optimize the IHC procedure.
A main limitation of IF techniques is that they can only be applied to fixed (dead) and/or permeabilized cells, both procedure potentially inducing artifacts. Other limitations of this approach are due to the use of a microscope for the observation of the samples. First, as the optical resolution of epifluorescence and confocal microscopes is limited, location or co-location of the detected proteins should not be over-interpreted. Secondly, photobleaching, i.e. fading of the fluorescence intensity over time when exposed to light, is essentially due to generation of reactive oxygen species in the sample upon fluorescence excitation which, in turn, leads to the photochemical destruction of the fluorophore. Photobleaching can be reduced by: a) keeping the samples protected from light during the IF experiment and storage until their observation; b) using an antifade agent (reactive oxygen species scavengers) in the mounting medium; c) reducing the intensity and/or duration of the excitation light; d) increasing the concentration of fluorophores or using a low concentration of a fluorochrome with high-quantum efficiency; and e) using robust fluorophores that are less prone to photobleaching (i.e. Alexa Fluors, Seta Fluors, or DyLightFluors). Thirdly, autofluorescence is often due to the presence of flavin coenzymes (FAD and FMN: absorption, 450 nm; emission, 515 nm) and reduced pyridine nucleotides (NADH: absorption, 340 nm; emission, 460 nm) in mammalian cells. Furthermore, the use of aldehydes, particularly glutaraldehyde, to fix the samples, can result in high levels of autofluorescence. This can be minimized by washing the samples with 0.1% sodium borohydride in PBS prior to antibody incubation and/or by selecting probes and optical filters that maximize the fluorescence signal relative to the autofluorescence. Fourthly, fluorescence overlap (also termed bleed-through, crossover or crosstalk) is mainly due to the emission spectral properties of the fluorophores as they often exhibit very broad bandwidths, different, asymmetrical spectral profiles, as well as various peak emission wavelengths and number of maxima. Fluorescence overlap occurs when working with several fluorophores (multicolor labeling) and is characterized by the emission of one fluorophore in the channel (filter) of another fluorophore. Bleed-through artifacts must be minimized as they often complicate the interpretation of IF results, particularly in the case of co-localization or quantitative studies. As balancing of the fluorophores emission can only be slightly improved by the IF procedure, bleed-through can mainly be reduced at time of image acquisition by using an optimized fluorescence filter sets and/or photomultiplier detector in order to properly separate the spectral profiles of the fluorophores. In this regard, confocal microscopy is well-suited to multicolor imaging as it allows the differentiation fluorescence emission spectra of individual fluorophores by directing each signal to a particular detection channel. Moreover, confocal microscopy allows to adjust the gain, photomultiplier voltage, or laser power for the individual detection channels for the sequential acquisition (only one fluorophore at a time) of the labeling. Ideally, single-label controls must be performed to quantify the bleed-through and eventually remove it computationally. A control without secondary antibodies (background control) can be prepared to set the limits of signal gain and offset of each channel for optimal image acquisition. It can also be used for post-acquisition processing to correct image background (autofluorescence).
In conclusion, the method described provides a simple standard protocol for easy realization of immunostaining on mammary gland sections. Nevertheless, the principal steps of an IHC experiment must be optimized for each antigen/antibody couple in order to visualize specific staining and to minimize non-specific background signals. The described method also includes several basic methods for the post-treatment of most of the images obtained. Fluorescence-based immunodetection is a powerful method with a wide range of applications from the cellular localization of an antigen to diagnosis. New advances in these approaches will be achieved with the future development of new fluorophores, acquisition devices and microscopy techniques, to image previously unobserved details of biological structures and processes.
Subscription Required. Please recommend JoVE to your librarian.
Disclosures
The authors declare that they have no competing financial interests.
Acknowledgments
The authors are grateful to the INRA MIMA2 imaging core facility (INRA, UMR1198, Jouy-en-Josas) and to the staff of the IERP unit (UE 0907, INRA, Jouy-en-Josas) for animal care and facilities. We would also like to thank I.H. Mather, M.C. Neville and S. Tooze for providing us with very useful antibodie.
Materials
| Name | Company | Catalog Number | Comments |
| Dissection | |||
| Pins | |||
| Ethanol | |||
| Scissors | |||
| Scalpel and adapted blades | |||
| Ice | |||
| Towel paper | |||
| Tissue sample preparation | Company | Catalog Number | Comments/Description |
| Phosphate Buffered Saline (pH7.4) | Sigma | P-3813 | |
| Paraformaldehyde (PFA, 32% EM grade, 100 ml) | Electron Microscopy Sciences | 15714-S | personnal protection equipment required WARNING: this product will expose you to Formaldehyde Gas, a chemical known to cause cancer |
| OCT compound/Tissue Tek | Sakura | 4583 | |
| Sucrose (D-saccharose) | VWR | 27480.294 | |
| Plastic molds | Dominique Dutscher | 39910 | |
| Liquid nitrogen | |||
| Cryostat/sample support | Leica | CM3050S | |
| Razor blades (SEC35) | Thermo Scientific | 152200 | |
| Slide box | |||
| Glass slides Superfrost/Superfrost Ultra Plus | Thermo Scientific | 10143560W90/1014356190 | |
| Brushes | |||
| IHC | Company | Catalog Number | Comments/Description |
| Super Pap Pen | Sigma | Z377821-1EA | |
| Permanent marker (black) | |||
| 50 mM NH4Cl in PBS | Sigma | A-0171 | |
| 0.1 M glycine in PBS | VWR | 24403.367 | |
| Antigen Retrieval solution: Tris 100 mM 5% urea pH9.6 | |||
| Heater (up to 100°C) | |||
| Bovine Serum Albumin (BSA) | Sigma | A7906-100G | |
| Vectashield (anti-fading mounting medium) without DAPI/with DAPI | Vector Laboratories | H-1000/H-1200 | |
| Glass coverslips 22x50mm (microscopy grade) | VWR | CORN2980-225 | |
| Nail polish | |||
| Primary antibodies | Company | Catalog Number | Comments/Description |
| Rabbit anti-mouse caseins (#7781; 1:50 dilution) | generously gifted by M.C. Neville (University of Colorado Health Sciences Center, USA) |
||
| Mouse anti-cytokeratin 8 (CK8, clone 1E8, 1:50 dilution) | Biolegend (Covance) | MMS-162P | |
| Mouse anti-cytokeratin 14 (CK14, cloneLL002, 1:50 dilution) | Thermo Scientific | MS-115-P0/P1 | |
| Rabbit anti-butyrophilin (1:300 dilution) | generously gifted by I.H. Mather (Department of Animal and Avian Sciences University of Maryland College Park, USA) | ||
| Rabbit anti-Stx6 (1:50 dilution) | generously gifted S. Tooze (Cancer Research UK, London Research Institute, London, UK) |
||
| Rabbit anti-VAMP4 (1:50 dilution) | Abcam | ab3348 | |
| Secondary antibodies | Company | Catalog Number | Comments/Description |
| Rhodamine-conjugated goat anti-rabbit IgG (H + L) (1:300 dilution) | Jackson ImmunoResearch Laboratories | 111-025-003 | |
| Counterstains | Company | Catalog Number | Comments/Description |
| Bodipy 493/503 | Life Technologies (Molecular Probes) | D-3922 | |
| DAPI (4-6-diamidino-2-phenylindole) | Life Technologies (Molecular Probes) | D-1306 | |
| Observation/Image capture | Company | Catalog Number | Comments/Description |
| conventional fluorescence microscope | Leica Leitz DMRB microscope |
Standard filters for FITC, Rhodamine and DAPI emissions, ×63 oil-immersion objective (NA 1.3), DP50 imaging camera (Olympus), CellˆF software (Olympus) |
|
| Laser Scanning Microscope (confocal microscopy) | Zeiss LSM 510 microscope |
Plan-Apochromat ×63 oil-immersion objective (NA 1.4), CLSM 510 software, Confocal facilities, MIMA2 Platform, INRA Jouy-en-Josas, France, http://mima2.jouy.inra.fr/mima2) | |
| Image treatment | Company | Catalog Number | Comments/Description |
| ImageJ 1.49k software | Free software |
References
- Watson, C. J., Khaled, W. T. Mammary development in the embryo and adult: a journey of morphogenesis and commitment. Development. , 135-995 (2008).
- Smith, G. H. Experimental mammary epithelial morphogenesis in an in vivo model: evidence for distinct cellular progenitors of the ductal and lobular phenotype. Breast Cancer Res Treat. 39, 21-31 (1996).
- Van Keymeulen, A., et al. Distinct stem cells contribute to mammary gland development and maintenance. Nature. 479, 189-193 (2011).
- Oakes, S. R., Gallego-Ortega, D., Ormandy, C. J. The mammary cellular hierarchy and breast cancer. Cell Mol Life Sci. 71, 4301-4324 (2014).
- Visvader, J. E., Stingl, J. Mammary stem cells and the differentiation hierarchy: current status and perspectives. Genes & development. 28, 1143-1158 (2014).
- Robinson, G. W. Cooperation of signalling pathways in embryonic mammary gland development. Nat Rev Genet. 8, 963-972 (2007).
- Cowin, P., Wysolmerski, J. Molecular mechanisms guiding embryonic mammary gland development. Cold Spring Harb Perspect Biol. 2, a003251 (2010).
- Brisken, C., O'Malley, B.
- Gjorevski, N., Nelson, C. M. Integrated morphodynamic signalling of the mammary gland. Nat Rev Mol Cell Biol. 12, 581-593 (2011).
- Daniel, C. W., Smith, G. H. The mammary gland: a model for development. J Mammary Gland Biol Neoplasia. 4, 3-8 (1999).
- Howlett, A. R., Bissell, M. J. The influence of tissue microenvironment (stroma and extracellular matrix) on the development and function of mammary epithelium. Epithelial Cell Biol. 2, 79-89 (1993).
- Edwards, G., Streuli, C. Signalling in extracellular-matrix-mediated control of epithelial cell phenotype. Biochem Soc Trans. 23, 464-468 (1995).
- Hennighausen, L., Robinson, G. W. Think globally, act locally: the making of a mouse mammary gland. Genes & development. 12, 449-455 (1998).
- Topper, Y. J., Freeman, C. S. Multiple hormone interactions in the developmental biology of the mammary gland. Physiol Rev. 60, 1049-1106 (1980).
- Brisken, C., et al. A paracrine role for the epithelial progesterone receptor in mammary gland development. Proc Natl Acad Sci U S A. 95, 5076-5081 (1998).
- Ormandy, C. J., Binart, N., Kelly, P. A. Mammary gland development in prolactin receptor knockout mice. J Mammary Gland Biol Neoplasia. 2, 355-364 (1997).
- Oakes, S. R., Rogers, R. L., Naylor, M. J., Ormandy, C. J.
- Hennighausen, L., Robinson, G. W.
- Kouros-Mehr, H., Werb, Z. Candidate regulators of mammary branching morphogenesis identified by genome-wide transcript analysis. Dev Dyn. 235, 3404-3412 (2006).
- Khaled, W. T., et al. The IL-4/IL-13/Stat6 signalling pathway promotes luminal mammary epithelial cell development. Development. 134, 2739-2750 (2007).
- Asselin-Labat, M. L., et al. Gata-3 is an essential regulator of mammary-gland morphogenesis and luminal-cell differentiation. Nat Cell Biol. 9, 201-209 (2007).
- Barcellos-Hoff, M. H., Aggeler, J., Ram, T. G., Bissell, M. J. Functional differentiation and alveolar morphogenesis of primary mammary cultures on reconstituted basement membrane. Development. 105, 223-235 (1989).
- Robinson, G. W., McKnight, R. A., Smith, G. H., Hennighausen, L. Mammary epithelial cells undergo secretory differentiation in cycling virgins but require pregnancy for the establishment of terminal differentiation. Development. 121, 2079-2090 (1995).
- Streuli, C. H., Bissell, M. J. Mammary epithelial cells, extracellular matrix, and gene expression. Cancer Treat Res. 53, 365-381 (1991).
- Streuli, C. H., et al. Laminin mediates tissue-specific gene expression in mammary epithelia. J Cell Biol. 129, 591-603 (1995).
- Boudreau, N., Sympson, C. J., Werb, Z., Bissell, M. J. Suppression of ICE and apoptosis in mammary epithelial cells by extracellular matrix. Science. 267, 891-893 (1995).
- Pullan, S., et al. Requirement of basement membrane for the suppression of programmed cell death in mammary epithelium. J Cell Sci. 109 (Pt 3), 631-642 (1996).
- Schmidhauser, C., Bissell, M. J., Myers, C. A., Casperson, G. F. Extracellular matrix and hormones transcriptionally regulate bovine beta-casein 5' sequences in stably transfected mouse mammary cells. Proc Natl Acad Sci U S A. 87, 9118-9122 (1990).
- Streuli, C. H., et al. Stat5 as a target for regulation by extracellular matrix. J Biol Chem. 270, 21639-21644 (1995).
- Sollner, T., et al. SNAP receptors implicated in vesicle targeting and fusion. Nature. 362, 318-324 (1993).
- Jahn, R., Scheller, R. H.
- Weber, T., et al. SNAREpins: minimal machinery for membrane fusion. Cell. 92, 759-772 (1998).
- Sollner, T., Bennett, M. K., Whiteheart, S. W., Scheller, R. H., Rothman, J. E. A protein assembly-disassembly pathway in vitro that may correspond to sequential steps of synaptic vesicle docking, activation, and fusion. Cell. 75, 409-418 (1993).
- McNew, J. A. Regulation of SNARE-mediated membrane fusion during exocytosis. Chem Rev. 108, 1669-1686 (2008).
- Wang, C. C., et al. VAMP8/endobrevin as a general vesicular SNARE for regulated exocytosis of the exocrine system. Mol Biol Cell. 18, 1056-1063 (2007).
- Chat, S., et al. Characterisation of the potential SNARE proteins relevant to milk product release by mouse mammary epithelial cells. Eur J Cell Biol. 90, 401-413 (2011).
- Reinhardt, T. A., Lippolis, J. D. Bovine milk fat globule membrane proteome. J Dairy Res. 73, 406-416 (2006).
- Robenek, H., et al. Butyrophilin controls milk fat globule secretion. Proc Natl Acad Sci U S A. 103, 10385-10390 (2006).
- Fujimoto, T., Ohsaki, Y., Cheng, J., Suzuki, M., Shinohara, Y. Lipid droplets: a classic organelle with new outfits. Histochem Cell Biol. 130, 263-279 (2008).
- Mather, I. H., Keenan, T. W.
- Heid, H. W., Keenan, T. W. Intracellular origin and secretion of milk fat globules. Eur J Cell Biol. 84, 245-258 (2005).
- McManaman, J. L., Russell, T. D., Schaack, J., Orlicky, D. J., Robenek, H. Molecular determinants of milk lipid secretion. J Mammary Gland Biol Neoplasia. 12, 259-268 (2007).
- de Assis, S., Warri, A., Cruz, M. I., Hilakivi-Clarke, L. Changes in mammary gland morphology and breast cancer risk in rats. Journal of visualized experiments : JoVE. , (2010).
- Plante, I., Stewart, M. K., Laird, D. W. Evaluation of mammary gland development and function in mouse models. Journal of visualized experiments : JoVE. , (2011).
- Galio, L., et al. MicroRNA in the ovine mammary gland during early pregnancy: spatial and temporal expression of miR-21, miR-205, and miR-200. Physiol Genomics. 45, 151-161 (2013).
- Linzell, J. L., Peaker, M. The effects of oxytocin and milk removal on milk secretion in the goat. J Physiol. 216, 717-734 (1971).
- Knight, C. H., Peaker, M., Wilde, C. J. Local control of mammary development and function. Rev Reprod. 3, 104-112 (1998).
- Walid, M. S., Osborne, T. J., Robinson, J. S. Primary brain sarcoma or metastatic carcinoma? Indian J Cancer. 46, 174-175 (2009).
- Hue-Beauvais, C., et al. Localisation of caveolin in mammary tissue depends on cell type. Cell Tissue Res. 328, 521-536 (2007).
- McManaman, J. L., Neville, M. C. Mammary physiology and milk secretion. Adv Drug Deliv Rev. 55, 629-641 (2003).
- Mather, I. H., Jack, L. J. A review of the molecular and cellular biology of butyrophilin, the major protein of bovine milk fat globule membrane. J Dairy Sci. 76, 3832-3850 (1993).
- Heid, H. W., Winter, S., Bruder, G., Keenan, T. W., Jarasch, E. D. Butyrophilin, an apical plasma membrane-associated glycoprotein characteristic of lactating mammary glands of diverse species. Biochim Biophys Acta. 728, 228-238 (1983).
- Bock, J. B., Klumperman, J., Davanger, S., Scheller, R. H. Syntaxin 6 functions in trans-Golgi network vesicle trafficking. Mol Biol Cell. 8, 1261-1271 (1997).
- Tran, T. H., Zeng, Q., Hong, W. VAMP4 cycles from the cell surface to the trans-Golgi network via sorting and recycling endosomes. J Cell Sci. 120, 1028-1041 (2007).
- Wendler, F., Page, L., Urbe, S., Tooze, S. A. Homotypic fusion of immature secretory granules during maturation requires syntaxin 6. Mol Biol Cell. 12, 1699-1709 (2001).
- Wendler, F., Tooze, S. Syntaxin 6: the promiscuous behaviour of a SNARE protein. Traffic. 2, 606-611 (2001).
- Shitara, A., et al. VAMP4 is required to maintain the ribbon structure of the Golgi apparatus. Mol Cell Biochem. 380, 11-21 (2013).
- Thibault, C., Levasseur, M. C. La reproduction chez les mammifères et l'homme. , INRA Editions. 928 (2001).
- Truchet, S., Wietzerbin, J., Debey, P. Mouse oocytes and preimplantation embryos bear the two sub-units of interferon-gamma receptor. Mol Reprod Dev. 60, 319-330 (2001).
