We present a robust, cost-effective, and flexible method for measuring changes in hepatocyte number and nuclear ploidy within fixed/cryopreserved tissue samples that does not require flow cytometry. Our approach provides a powerful sample-wide signature of liver cytology ideal for tracking the progression of liver injury and disease.
A subscription to JoVE is required to view this content. Sign in or start your free trial.
Method Article
A High-Throughput In Situ Method for Estimation of Hepatocyte Nuclear Ploidy in Mice
In This Article
Summary
Abstract
When the liver is injured, hepatocyte numbers decrease, while cell size, nuclear size and ploidy increase. The expansion of non-parenchymal cells such as cholangiocytes, myofibroblasts, progenitors and inflammatory cells also indicate chronic liver damage, tissue remodeling and disease progression. In this protocol, we describe a simple high-throughput approach for calculating changes in the cellular composition of the liver that are associated with injury, chronic disease and cancer. We show how information extracted from two-dimensional (2D) tissue sections can be used to quantify and calibrate hepatocyte nuclear ploidy within a sample and enable the user to locate specific ploidy subsets within the liver in situ. Our method requires access to fixed/frozen liver material, basic immunocytochemistry reagents and any standard high-content imaging platform. It serves as a powerful alternative to standard flow cytometry techniques, which require disruption of freshly collected tissue, loss of spatial information and potential disaggregation bias.
Introduction
Hepatocytes in the mammalian liver can undergo stalled cytokinesis to produce binuclear cells, and DNA endoreplication to produce polyploid nuclei containing up to 16N DNA content. Overall cellular and nuclear ploidy increase during postnatal development, ageing and in response to diverse cellular stresses1. The process of polyploidization is dynamic and reversible2, although its precise biological function remains unclear3. Increased ploidy is associated with reduced proliferative capacity4, genetic diversity2, adaptation to chronic injury5 and cancer protection6. Hepatocyte ploidy alterations occur as a result of altered circadian rhythm7, and weaning8. Most notably, the ploidy profile of the liver is altered by injury and disease9, and compelling evidence suggests that specific ploidy changes, such as increased ≥8N nuclei or loss of 2N hepatocytes, provide useful signatures for tracking non-alcoholic fatty liver disease (NAFLD) progression3,10, or the differential impact of viral infections11.
In general terms, liver injury and regeneration are associated with increased hepatocyte cell size and nuclear area12, together with reduced overall numbers of hepatocytes, particularly those with 2N DNA content10,11. Parenchymal injury in the liver is also frequently accompanied by expansion of non-parenchymal cells (NPCs), including stromal myofibroblasts, inflammatory cells and bipotent liver progenitor cells. High-throughput methods that provide a quantitative cytological profile of parenchymal cell number and nuclear ploidy, whilst also accounting for changes in NPCs, therefore have considerable potential as research and clinical tools to track the response of the liver during injury and disease. Compelling recent in situ analysis of ploidy spectra in human samples of hepatocellular carcinoma also demonstrate that nuclear ploidy is dramatically increased within tumors and is specifically amplified in more aggressive tumor subtypes with reduced differentiation and loss of TP5313. Hence, there is a strong possibility that methodological advances in quantitative assessment of nuclear ploidy will assist in future prognostic profiling of liver cancer.
In this protocol, a flexible high-throughput methodology for the comparative analysis of mouse liver tissue sections is described, which provides detailed cytometric profiling of hepatocyte numbers, the NPC response and an internally calibrated method for estimating nuclear ploidy (Figure 1). Hepatocytes are distinguished from NPCs by hepatocyte nuclear factor 4 alpha (HNF4α) immunolabelling, prior to characterization of nuclear size and nuclear morphometry. "Minimal DNA content" is estimated for all circular nuclear masks by integrating mean Hoechst 33342 intensity (a proxy for DNA density) with interpolated three-dimensional (3D) nuclear volume. Hepatocyte minimal DNA content is then calibrated using NPCs to generate a nuclear ploidy profile.
Image acquisition, nuclear segmentation and image analysis are performed using high-content imaging, enabling large areas of two-dimensional (2D) liver sections containing tens of thousands of cells to be screened. A custom-written program is provided for automated post-processing of high-content image analysis data to produce a sample-wide ploidy profile for all circular hepatocyte nuclei. This is performed using free to download software to calculate nuclear ploidy based on stereological image analysis (SIA)10,11,14,15. The SIA methodology has been previously validated by flow cytometry as an accurate, albeit laborious, method for estimating hepatocyte nuclear ploidy in the liver14, assuming circular nuclear morphology and a monotonic relationship between nuclear size and DNA content. In this protocol, both nuclear parameters are measured by assessment of nuclear morphometry and Hoechst 33342 labelling. Calculation of "minimal DNA content" for each nuclear mask is followed by calibration of hepatocyte nuclear ploidy using NPCs, which have a known 2−4N DNA content and therefore serve as a useful internal control.
Compared to conventional flow cytometry methods16 the approach described enables hepatocyte nuclear ploidy to be assessed in situ and does not require access to fresh tissue or disaggregation methods that can bias outcomes and be difficult to standardize. As with all SIA-based approaches, nuclear ploidy subclasses >2N are underrepresented by 2D sampling due to the sectioning of larger nuclei outside of the equatorial plane. The tissue-wide ploidy profile also describes minimum DNA content for all circular hepatocyte nuclear masks, and does not directly discriminate between mononuclear hepatocytes and binuclear cells that have two discrete ("non-touching") nuclei of the same ploidy. However, the simplicity of this protocol allows considerable scope for it to be adapted to account for additional parameters such as internuclear spacing or cell perimeter analysis, that would facilitate identification of binuclear cells providing a more detailed assessment of cellular ploidy.
Access restricted. Please log in or start a trial to view this content.
Protocol
All animal experiments were previously approved by the CIPF ethics committee. Mice were housed in a pathogen-free facility at the Centro de Investigación Príncipe Felipe (Valencia, Spain), registered as an experimental animal breeder, user, and supply centre (reg. no. ES 46 250 0001 002) under current applicable European and Spanish animal welfare regulations (RD 53/2013).
1. Tissue harvesting and sample preparation
NOTE: This protocol describes how to freeze tissue without prior fixation or cryopreservation. For previously fixed/cryopreserved samples proceed to section 2 and omit step 3.1. All analyses have been performed using adult female C57BL/6 mice aged 12−16 weeks.
- Sacrifice animals by fentanyl/pentobarbital intraperitoneal injection followed by cervical dislocation. With the mouse facing ventral side up, open the abdominal cavity and expose the liver by grasping the skin with tweezers and performing a vertical incision from the base of the lower abdomen to the base of the sternum using surgical scissors.
- Carefully remove the gallbladder using fine tweezers, dissect out the liver and rinse the selected liver lobule in a 10 cm Petri dish plate filled with phosphate-buffered saline (PBS).
NOTE: It is recommended to compare the same liver lobe for each animal, in this case the median lobe was used. - Fill a labelled cryomold with optimal cutting temperature (OCT) medium at room temperature (RT). Avoid OCT bubbles. If they appear, push them to the edge of the mold using a needle or pipette tip.
- Embed liver lobule into a filled OCT cryomold and immediately place it on dry ice to ensure rapid freezing. Store cryomolds at -80 °C until cryosectioning.
2. Cryosectioning
- Transport cryomolds on dry ice to avoid tissue degradation. Prior to cryosectioning equilibrate inside cryostat set to -20 °C for 20 min.
- Eject sample by applying pressure to the base of the plastic cryomold. Apply liquid OCT to warm sample disk at RT, position in cryostat and attach an OCT embedded liver sample. Apply gentle pressure and wait 3 min for OCT to freeze ensuring the sample sticks to the disk.
NOTE: Avoid handling the sample with fingers as much as possible to evade tissue degradation. - Lock the sample into the arm of the cryostat and adjust the orientation so that the edge of the sample is parallel with the cryostat blade. Cut into the sample until tissue is reached.
- Section the sample at 6 µm thickness. Place a labelled polyamide-coated slide over the sample for 5 s to let the sample stick onto the slide. Place the slide at RT for 3−5 min, then, for best results, proceed directly to section 3.
NOTE: For processing of multiple fresh-frozen samples reproducible results have been obtained by temporarily storing slides in a slide box on dry ice until all samples have been processed. When using this approach allow all slides to equilibrate to RT before proceeding to section 3. Formalin fixed paraffin embedded (FFPE) samples can be used, although background autofluorescence is increased by this method. To proceed from FFPE samples, section at 4 µm. Mount by catching sections from 40 °C water bath on polyamide-treated slides. Heat slides for 1 h at 60 °C, then deparaffinize by serial RT washes (5 min) in Coplin jars containing xylene (x2), ethanol 100% (x2), 96% (x2), 70% (x1) and dH2O (x1). To expose antigens place slides in citrate buffer for 20 min at 90 °C before tempering slides in PBS at RT. Proceed to step 3.2.
3. Fluorescence immunolabelling
- Fix tissue sections in a fume hood by applying 1 mL of 4% paraformaldehyde (PFA) in PBS for 10 min at RT. Transfer slides to a PBS filled Coplin jar and wash for 3 min using gentle agitation (repeat 3x).
NOTE: From now until the end of the immunostaining process, avoid drying of the sample. - Dry the area around each tissue section and surround using a hydrophobic pen. Permeabilize with 0.5% nonionic surfactant (i.e., Triton X-100) in PBS for 15 min at RT. Then wash in PBS filled Coplin jar for 3 min using gentle agitation (repeat 2x).
- Block using a filtered solution of 1% bovine serum albumin (BSA), 5% horse serum, 0.2% nonionic surfactant in PBS (for at least 1 h at RT).
- Incubate with primary HNF4α antibody diluted in blocking buffer over night at 4 °C in a dark humid staining chamber (see Table of Materials for antibodies and specific dilutions).
- Place slides into a PBS filled Coplin jar and wash for 3 min using gentle agitation (repeat 4x).
- Incubate with Alexa-488 conjugated secondary antibody and Hoechst diluted in filtered 1% BSA and 0.2% nonionic surfactant in PBS for 2 h at RT in a dark humid staining chamber (see Table of Materials for antibodies and specific dilutions).
- Place slides into a PBS filled Coplin jar and wash for 3 min using gentle agitation (repeat 4x). Wash in ddH2O for 3 min using gentle agitation (repeat 2x).
- Mount slides by placing two drops of fluorescent mounting media on a coverslip (24 x 60 mm) and laying slides over it, eliminating bubbles by applying gentle pressure. For long-term storage, seal coverslip at edges with clear nail polish and store in the dark at 4 °C.
- Before proceeding, check slides using a conventional fluorescence microscope to ensure good fixation and immunolabeling.
NOTE: See Figure 2A,B for expected results.
4. Fluorescence image acquisition
NOTE: For this step, a high-content imaging platform (Table of Materials) is required that supports automatic fluorescence image acquisition.
- Turn on the imaging system and open a new acquisition protocol.
- Select the 10x objective, note the area of the field of view (in this case 0.6 mm2).
- Set parameters to acquire fluorescence images using the appropriate excitation and emission filters (as per step 3.6). For Hoechst and Alexa-488, select "DAPI" and "GFP" channels with 390/18 and 438/24 nm excitation and 432.5/48 and 475/24 nm emission, respectively.
- Focus the sample and ensure signal intensity is non-saturating. Ensure that image capturing is done with the same exposure time for all the images or use a system where the intensity of fluorescence is corrected for the exposure time.
- Scan sample and acquire sufficient images to obtain complete coverage of the tissue section (approximately 20−50 fields of view, depending on the sample size).
- Review the image database, manually eliminating (i) poorly focused fields, (ii) those at the borders of each tissue section (to avoid biasing cell density calculations), and (iii) those containing folded/physically damaged areas of the tissue section if present.
5. Automated fluorescence image analysis
NOTE: This step requires appropriate image analysis software (Table of Materials) capable of: (1) automatically identifying Hoechst labelled nuclei within images at 405 nm (nuclear segmentation), (2) assessing mean Hoechst nuclear intensity and morphometry, and (3) threshold analysis to determine the +/- status of nuclear fluorescence at 488 nm (HNF4α). Some basic operator training/expertise is required to visually assess and adjust segmentation and thresholding parameters within the program to ensure that nuclei and HNF4α+/- status are optimally gated (Figure 2).
- In the image analysis software, open the acquisition file containing Hoechst (405 nm) and HNF4α (488 nm) images from step 4.5, and create a new analysis protocol.
- Define wavelengths to be used for nuclear segmentation (Hoechst, 405 nm) and for hepatocyte/NPC threshold analysis (HNF4α, 488 nm).
- Adjust the software's nuclear segmentation parameters (such as "minimum nuclear area" and nuclear detection "sensitivity") to ensure nuclei are optimally segregated.
NOTE: Good segmentation of hepatocytes should be prioritized over that of NPCs. Hepatocyte nuclei are characteristically rounded (interquartile size range: 40−64 µm2). NPC nuclei, such as those of sinusoidal endothelia, are flattened/elliptical or irregular in shape and generally smaller and more closely packed than those of hepatocytes (interquartile size range: 30−43 µm2). For mouse liver, minimal nuclear area ≥23 µm2 and detection "sensitivity" of 65% were used (see Figure 2C,D for expected results). Sensitivity determines how pixel clusters are recognized as individual nuclei based on their intensity and should be empirically tested for each sample set by the user before proceeding with automated image analysis. - Modify the threshold intensity at 488 nm to ensure optimal gating of hepatocytes (HNF4α+) and non-parenchymal cells (HNF4α-).
NOTE: See Figure 2C,D for expected results. The value of threshold intensity is relative and will depend on staining efficiency and acquisition settings such as laser intensity. It should therefore be standardized by the user. Use known HNF4α- cells such as endothelial cells and periportal NPCs as an internal negative control and binuclear hepatocyte nuclei as a positive reference for staining. Test the analysis parameters using a small number of images to ensure good nuclear segmentation and intensity threshold segregation before applying analysis parameters to the entire dataset. - Select the following nuclear parameters to be quantified: (1) nuclear area based on Hoechst staining (µm2), (2) mean nuclear Hoechst intensity (RU), (3) nuclear elongation factor (mean ratio of the short axis of the nucleus to the long axis of the nucleus, where a centre-symmetric [non-elongated] object has a value of 1, (4) Nuc 1/(form factor), mean nuclear "roundness" index calculated by perimeter 2/(4π x area). Values range from 1 to infinity, where 1 is a perfect circle, (5) HNF4α status (positive-1 or negative-0), and (6) nuclear x/y coordinates based on "center of gravity" (cg), a method for locating the center of the object from greyscale images with sub-pixel precision.
- Run the analysis for all sample datasets and export numerical data from step 5.5 to spreadsheet software.
6. Data analysis
NOTE: The data analysis step can be performed using any standard spreadsheet software.
- Calculate hepatocyte and non-hepatocyte cell numbers.
- Calculate the total area of liver section analyzed for each sample by multiplying the number of fields of view by the area of the field of view (step 4.2).

- Working with spreadsheet files generated for each liver section, filter the data by selecting only HNF4α+ nuclei. Calculate the total number of HNF4α+ nuclei analyzed and divide this by the total area analyzed to obtain mean hepatocyte density for each sample (Figure 2F).

- Perform the same calculation for non-parenchymal cells by filtering the spreadsheet for HNF4α- cells (Figure 2E).
- Calculate the total area of liver section analyzed for each sample by multiplying the number of fields of view by the area of the field of view (step 4.2).
- Calculate hepatocyte nuclear size distribution.
- Using spreadsheet software, filter data to select only HNF4α+ nuclei.
- Plot values of nuclear area in a histogram (Figure 2G). Set the bin width to 5 µm2.
NOTE: Frequency values can be corrected for area (nuclei/mm2) as per step 6.1.1.
- Perform hepatocyte nuclear ploidy analysis.
NOTE: The spreadsheet data from step 5.6 are used to generate a nuclear ploidy profile for each sample. This process has been automated and can be performed using a custom written software that is freely available to download with supporting information and demonstration datasets at https://github.com/lukeynoon (see Supplemental Files). Source code is provided for users who wish to adapt the methodology. A description of the algorithm, together with instructions for installation and use are outlined below. The program uses spreadsheet data to automatically separate hepatocyte nuclei into two groups; (1) those with "simple" circular nuclei and (2) "complex" non-circular nuclei representative of binuclear cells with >2c ploidy. The minimal nuclear DNA content (a function of nuclear area and DNA density) is next calculated for all "simple" nuclei. A subsequent step then automatically calibrates HNF4α+ hepatocyte nuclear ploidy using HNF4α- nuclei as a known 2−4N internal control.- Download and install software.
- Download the packaged application from: https://github.com/lukeynoon
- Launch MATLAB. Navigate to the APP tab of the toolstrip, click Install App and open the downloaded application termed "Ploidy_Application.mlappinstall". A message will appear to confirm the successful installation.
NOTE: The application is now ready for use and will remain in the APP tab of the toolstrip.
- Format input data.
NOTE: Prior to automated nuclear ploidy analysis, all spreadsheet files containing high content imaging data (step 5.6) should be stored and formatted according to the following instructions.- In each exported data file (.XLS 97-2004 workbook) from step 5.6, include a sheet termed "Cell measures" containing all the data required for the ploidy analysis set out in columns (Figure 3A). Ensure that the spreadsheet layout including column header names remains unchanged from that of Figure 3A, because the analysis method finds the correct column data by searching for these names (see demonstration datasets in Supplemental Files for reference). If for example, high-content image analysis software does not produce a "Light flux" column (Figure 3A), manually insert a "Light flux" column in the same location, i.e., column K and fill it with zeros.
- For each experimental condition (e.g., "Injured-d14"), provide a control dataset, which will be used to calculate the internal control for 2−4N nuclear ploidy calibration (step 6.3.4.3). Here, select liver samples from untreated adult littermates ("Control-d0"; Figure 3B−D).
- For biological replicates (per condition), store each spreadsheet in its own folder (as in Figure 3B). Name the folder prefixes incrementally, e.g., "Sample1, Sample2, Sample3… SampleN", as per the filenames contained within. Hence, every dataset folder (e.g., "Control-d0") should contain a series of subfolders ("Sample1", "Sample2", etc.) each containing a spreadsheet file of the same corresponding name.
- Run the application.
- Within MATLAB, launch the "Ploidy_Application" by clicking on the icon within the MY APPS tab of the toolstrip (Figure 3C). The Ploidy_Application graphical user interface (GUI) will appear (Figure 3C).
- Click the Path to control data button to navigate to the folder in which the control data replicates reside (e.g., "Control-d0"). This data path will then appear in the interface (e.g., /Users/Desktop/Control-d0).
- Next, in "folder prefix" type the name to be given to the output files (e.g., "Sample").
NOTE: This prefix can be changed to any text, provided that the folders and filenames remain incrementally named. - Click the Path to other data button and navigate to the folder in which the comparative data replicates reside (e.g., "Injured-d14"). This data path will then appear in the interface (e.g., /Users/Desktop/Injured-d14).
- Click Run!. When the analysis is complete, the status bar will read "Analysis Complete!..".
NOTE: The application will report, for each sample, stratification of "simple" nuclei into ≤2n, 2n−4n, 4n−8n and 8n+ in terms of absolute counts and as a percentage of total (Figure 3D). These files will be automatically saved in each sample folder as: "Count_2n.txt", "Count_2n_to_4n.txt", "Count_4n_to_8n.txt", "Count_8n_and_higher.txt", "Percentage_2n.txt", "Percentage_2nto4n.txt", "Percentage_4nto8n.txt", "Percentage_8n_and_higher.txt". The Ploidy_Application will automatically save a list for each sample, of all the individual ploidy estimates for "simple" hepatocyte and non-hepatocyte nuclei in "Ploidy_All_Hepatocytes.txt" and "Ploidy_NonHepatocytes.txt". For the control dataset, the method also saves the minimal DNA content thresholds calculated for stratification of ploidy (see step 6.3.4.3.7) in a file named "Normalised_Thresholds_Control". Finally, the application will produce a folder for both the control and the selected comparative condition data termed "Summary". This folder contains two subfolders, "Ploidy" and "Stratification" which contain the averages of all samples provided (Figure 3D).
- Description of the methodology.
NOTE: The following section describes in detail the methodology used by the Nuclear Ploidy Analysis software. If the user chooses not to use the application, these steps can be followed using spreadsheet software to calculate the nuclear ploidy profile manually.- Separate nuclei into "simple" or "complex" according to nuclear morphometry.
- Calculate a "circularity index" for all nuclei, defined as the nuclear "elongation factor" divided by the "Nuc 1/(form factor)", where a value of 1.0 indicates a perfect circle.
NOTE: "Nuclear elongation" and "Nuc 1/(form factor)" are two discrete measures of an object's "circularity" that assess complementary, non-overlapping morphometric criteria. The former measures the long- and short-axes of an object, while the latter compares the length of perimeter of an object to that of its area. To strengthen the definition of nuclear circularity used in this protocol, these two measurements have been combined into a single "circularity index". A previous approach to estimate nuclear ploidy using the described methodology used only nuclear elongation17. While acceptable results were obtained using this approach, the authors have observed that a composite "circularity index" improves discrimination of manually selected nuclei from mononuclear and binuclear hepatocytes (data not shown). - Classify nuclei with a circularity index ≤ 0.8 as "complex" and those > 0.8 as "simple".
- Calculate a "circularity index" for all nuclei, defined as the nuclear "elongation factor" divided by the "Nuc 1/(form factor)", where a value of 1.0 indicates a perfect circle.
- Estimate "minimal" DNA content (m) for all "simple" nuclei.
- Calculate the nuclear radius (r) using the formula:
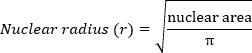
- Calculate nuclear volume (v) using the volume of a sphere formula:

- Generate a relative value for minimal DNA content (m) using the formula:

- Calculate the nuclear radius (r) using the formula:
- Calibrate the dataset using the NPC (HNF4α-) nuclei as an internal 2−4N control.
NOTE: NPCs have a 2−4N DNA content depending on cell cycle status. Hence, the mean value of NPC "minimal" DNA content (NPCm) increases with injury (Figure 4A). Calibration error is minimized by establishing an upper limit of NPCm representing a 4c threshold (Figure 4B).- Within the spreadsheet, select only NPC nuclei with values for "m" that lie within 1 standard deviation (SD) of the mode (this filters out noise from possible segmentation error).
- Within this filtered range, examine nuclear areas and their corresponding mean Hoechst intensities (Figure 4C).
- Estimate the smallest nuclear area within this filtered range with maximal nuclear Hoechst intensity (i.e., the point at which the line of the curve changes direction in the filtered dataset as illustrated by the red circle in Figure 4C). This value represents a 2N−4N transitional state (t) above which sampling of 4c nuclei predominates over 2c nuclei, resulting in a maxima of mean Hoechst intensity.
NOTE: This value is automatically determined by the software; however, spreadsheet users can manually select this point as the transitional size. - Calculate the minimal DNA content represented by this transitional size (tm) by following step 6.3.4.2.
- To estimate the 4N shoulder of the NPCm dataset, add 1 SD to the value of tm. The resulting number (Figure 4B) describes the upper limit of NPC minimal DNA content to be used for nuclear ploidy stratification (S4c).
- Repeat steps 6.3.4.3.1−6.3.4.3.5 for all "control" samples.
NOTE: For example, in Figure 3, uninjured control livers ("Control-d0") are used as a control condition. - Calculate an average 4c stratification threshold (S4c) for "control" samples and use this to extrapolate the 2c (S2c) and 8c (S8c) boundaries for minimal DNA content (m). Stratification thresholds are automatically generated and stored by the software (step 6.3.3.3).
NOTE: Depending on the study design, the average stratification threshold values may be calculated for each condition or for specific conditions (e.g., healthy control liver). However, the Nuclear Ploidy Analysis software requires that one of a set of 2 files is designated as "control" for the purposes of calculating relative ploidy values. - Calculate a ploidy value for all nuclei using the S2c value generated in step 6.3.4.3.7 as per:

- Stratify "simple" hepatocyte (HNF4α+) nuclei into 2c/4c/8c/>8c brackets according to the following criteria: "2c" HNF4α+ = p ≤ 2; "4c" HNF4α+ = 2 < p ≤ 4; "8c" HNF4α+ = 4 < p ≤ 8; ">8c" HNF4α+ = 8 < p.
- To reconstruct the spatial patterning of ploidy subgroups, separate the nuclear data within each sample spreadsheet according to the corresponding fields in which they were acquired. Then use associated nuclear x/y coordinates (from step 5.5) to plot ploidy subgroups in 2D (Figure 5C).
- Separate nuclei into "simple" or "complex" according to nuclear morphometry.
- Download and install software.
Access restricted. Please log in or start a trial to view this content.
Results
This method has been used to measure the impact of cholestatic injury on the adult mouse liver by feeding animals for 0−21 days with a hepatotoxic diet containing 0.1% 3,5-diethoxycarbonyl-1,4-dihydrocollidine (DDC)17. Chronic DDC feeding results in hepatocellular injury increased ploidy and periportal expansion of NPCs. The user should be aware that mouse strain and age-dependent differences may exist in nuclear ploidy and that all analyses have been performed usi...
Access restricted. Please log in or start a trial to view this content.
Discussion
A high-content, high-throughput approach for the analysis of tissue remodeling and estimation of hepatocyte nuclear ploidy in the murine liver is described. Once familiar with the procedure, a user can process, image and analyze multiple samples in a 3−5 day period, generating large testable datasets that provide a detailed signature of liver health. Given the simplicity of the sample preparation method, together with the large numbers of cells and tissue area analyzed (on average 14 mm2/sample), results...
Access restricted. Please log in or start a trial to view this content.
Disclosures
The authors have nothing to disclose.
Acknowledgements
This work was funded by the Spanish MINECO Government grants BFU2014-58686-P (LAN) and SAF-2017-84708-R (DJB). LAN was supported by a national MINECO Ramón y Cajal Fellowship RYC-2012-11700 and Plan GenT award (Comunitat Valenciana, CDEI-05/20-C), and FMN by a regional ValI+D studentship of the Valencian Generalitat ACIF/2016/020. RP would like to acknowledge Prof. Ewa K. Paluch for funding. We thank Dr. Alicia Martínez-Romero (CIPF Cytometry service) for help with the IN Cell Analyzer platform.
Access restricted. Please log in or start a trial to view this content.
Materials
| Name | Company | Catalog Number | Comments |
|---|---|---|---|
| 3,5-diethoxycarboxynl-1,4-dihydrocollidine diet (DDC) | TestDiet | 1810704 | Modified LabDiet mouse diet 5015 with 0.1% DDC |
| Alexa Fluor 488 donkey anti-goat IgG (H+L) | Invitrogen | A11055 | Dilution 1:500 |
| Bovine Serum Albumin | Sigma-Aldrich | A7906 | |
| Cryostat Leica CM1850 UV | Leica biosystems | CM1850 UV | Tissue sectioning |
| Fluorescent Mounting medium | Dako | S3023 | |
| GraphPad Prism | GraphPad Software | Prism 8 | Statistical software for graphing data |
| Hoechst 33342 | Sigma-Aldrich | B2261 | Final concentration 5 µg/mL |
| IN Cell Analyzer 1000 | GE Healthcare Bio-Sciences Corp | High-Content Cellular Imaging and Analysis System | |
| MATLAB | MathWorks | R2019a | Data analytics software for automated analysis of nuclear ploidy |
| Microscope coverslides | VWR International | 630-2864 | Size of 24 x 60 mm |
| Microsoft Office Excel | Microsoft | Speadsheet software | |
| OCT Tissue Tek | Pascual y Furió | 4583 | |
| Paraformaldehyde | Panreac AppliChem | 141451.121 | |
| Pen for immunostaining | Sigma-Aldrich | Z377821-1EA | 5mm tip width |
| Polysine Microscope Slides | VWR International | 631-0107 | |
| Rabbit polyclonal Anti-HNF4α | Thermo Fisher Scientific | PA5-79380 | Dilution 1:250 (alternative) |
| Rabit polyclonal Anti-HNF4α | Santa Cruz Biotechnology | sc-6556 | Dilution 1:200 (antibody used in the study) |
| Tween 20 | Sigma-Aldrich | P5927 |
References
- Gentric, G., Desdouets, C. Polyploidization in liver tissue. American Journal of Pathology. 184 (2), 322-331 (2014).
- Duncan, A. W., et al. The ploidy conveyor of mature hepatocytes as a source of genetic variation. Nature. 467 (7316), 707-710 (2010).
- Gentric, G., Desdouets, C. Liver polyploidy: Dr Jekyll or Mr Hide? Oncotarget. 6 (11), 8430-8431 (2015).
- Wilkinson, P. D., et al. The Polyploid State Restricts Hepatocyte Proliferation and Liver Regeneration in Mice. Hepatology. 69 (3), 1242-1258 (2019).
- Wilkinson, P. D., et al. Polyploid Hepatocytes Facilitate Adaptation and Regeneration to Chronic Liver Injury. The American Journal of Pathology. 189 (6), 1241-1255 (2019).
- Zhang, S., et al. The Polyploid State Plays a Tumor-Suppressive Role in the Liver. Developmental Cell. 44 (4), 447-459 (2018).
- Chao, H. W., et al. Circadian clock regulates hepatic polyploidy by modulating Mkp1-Erk1/2 signaling pathway. Nature Communications. 8 (1), 2238(2017).
- Celton-Morizur, S., Merlen, G., Couton, D., Margall-Ducos, G., Desdouets, C. The insulin/Akt pathway controls a specific cell division program that leads to generation of binucleated tetraploid liver cells in rodents. Journal of Clinical Investigation. 119 (7), 1880-1887 (2009).
- Wang, M. J., Chen, F., Lau, J. T. Y., Hu, Y. P. Hepatocyte polyploidization and its association with pathophysiological processes. Cell Death & Disease. 8 (5), e2805(2017).
- Gentric, G., et al. Oxidative stress promotes pathologic polyploidization in nonalcoholic fatty liver disease. Journal of Clinical Investigation. 125 (3), 981-992 (2015).
- Toyoda, H. Changes to hepatocyte ploidy and binuclearity profiles during human chronic viral hepatitis. Gut. 54 (2), 297-302 (2005).
- Miyaoka, Y., et al. Hypertrophy and Unconventional Cell Division of Hepatocytes Underlie Liver Regeneration. Current Biology. 22 (13), 1166-1175 (2012).
- Bou-Nader, M., et al. Polyploidy spectrum: a new marker in HCC classification. Gut. , (2019).
- Danielsen, H., Lindmo, T., Reith, A. A method for determining ploidy distributions in liver tissue by stereological analysis of nuclear size calibrated by flow cytometric DNA analysis. Cytometry. 7 (5), 475-480 (1986).
- Guidotti, J. E., et al. Liver Cell Polyploidization: A Pivotal Role for Binuclear Hepatocytes. Journal of Biological Chemistry. 278 (21), 19095-19101 (2003).
- Severin, E., Meier, E. M., Willers, R. Flow cytometric analysis of mouse hepatocyte ploidy - I. Preparative and mathematical protocol. Cell and Tissue Research. 238 (3), 643-647 (1984).
- Manzano-Núñez, F., et al. Insulin resistance disrupts epithelial repair and niche-progenitor Fgf signaling during chronic liver injury. PLoS Biology. 17 (1), e2006972(2019).
- Morales-Navarrete, H., et al. A versatile pipeline for the multi-scale digital reconstruction and quantitative analysis of 3D tissue architecture. eLife. 4, e11214(2015).
- Baratta, J. L., et al. Cellular organization of normal mouse liver: A histological, quantitative immunocytochemical, and fine structural analysis. Histochemistry and Cell Biology. 131 (6), 713-726 (2009).
- Pandit, S. K., et al. E2F8 is essential for polyploidization in mammalian cells. Nature Cell Biology. 14 (11), 1181-1191 (2012).
- Vinogradov, A. E., Anatskaya, O. V., Kudryavtsev, B. N. Relationship of hepatocyte ploidy levels with body size and growth rate in mammals. Genome. 44 (3), 350-360 (2001).
- Tanami, S., et al. Dynamic zonation of liver polyploidy. Cell and Tissue Research. 368 (2), 405-410 (2017).
- Kudryavtsev, B. N., Kudryavtseva, M. V., Sakuta, G. A., Stein, G. I. Human hepatocyte polyploidization kinetics in the course of life cycle. Virchows Archiv B Cell Pathology Including Molecular Pathology. 64 (1), 387-393 (1993).
- Gentric, G., Celton-Morizur, S., Desdouets, C. Polyploidy and liver proliferation. Clinics and Research in Hepatology and Gastroenterology. 36 (1), 29-34 (2012).
- Uhlén, M., et al. Tissue-based map of the human proteome. Science. 347 (6220), 1260419(2015).
Access restricted. Please log in or start a trial to view this content.
Reprints and Permissions
