This study investigates how the integration of digital art affects academic performance in English education. Findings show student engagement fully mediates this relationship, while higher digital literacy weakens the link. This offers a nuanced view of the digital paradox, challenging assumptions about digital skills in learning.
مقالة بحثية
Learning Based on Art and the Digital Paradox: Rethinking English Education in the 21st Century
في هذه المقالة
ملخص
الملخص
This study investigates the digital paradox in 21st-century English education, aiming to determine how integrating digital art pedagogies influences academic performance. The primary objective was to test a model positing that digital art integration, perceived art value, and technology self-efficacy drive academic success, with student engagement as a mediator and digital literacy as a moderator. A quantitative methodology was employed, collecting data from n = 265 Chinese undergraduates and analyzing them via Partial Least Squares Structural Equation Modeling (PLS-SEM). The findings confirm that student engagement fully mediates the relationship between the three independent variables and academic performance. A key and novel discovery is the significant negative moderating effect of digital literacy, indicating that the engagement-performance link is weaker for highly digitally literate students. This provides a nuanced empirical understanding of the digital paradox, suggesting that high digital skills may inadvertently dilute academic focus. The study's novelty lies in its integrated model and in this counterintuitive finding, which challenges the assumption that digital literacy is an unequivocal benefit. Theoretical implications include a refined model of technology acceptance in creative disciplines. In contrast, practical implications advise educators to design digital art pedagogies that strategically manage cognitive load for all learners, not just the less proficient.
المقدمة
The 21st-century classroom is undergoing a profound technological transformation, with digital tools heralded as catalysts for revolutionizing pedagogical approaches1. Within English language and literature education, a discipline fundamentally concerned with communication, creativity2, and critical interpretation, the integration of technologies from interactive whiteboards to artificial intelligence (AI)-powered writing assistants promises to enhance engagement and personalize learning3. However, this digital shift is not without its contradictions, creating a central tension termed here as the "digital paradox": technologies designed to empower learning can simultaneously induce cognitive overload, encourage superficial engagement4, and risk disconnecting students from the deeply humanistic and affective dimensions of language acquisition5. This study proposes that integrating art-based pedagogies with digital tools may resolve this paradox by creating a synergistic environment that leverages technological affordances while anchoring learning in the transformative power of artistic creation. Yet, a review of the literature reveals a persistent gap in empirically investigating this potential synergy6.
Substantial research advocates for technology integration in education, finding digital tools can foster co-authorship, provide platform-level feedback, and facilitate engagement with multimodal texts7. A parallel, robust body of scholarship affirms the value of arts integration, demonstrating that practices in drama8, visual art, and music cultivate creative empathy, tolerance for ambiguity, and expressive capacity competencies central to advanced English literacy while enhancing textual understanding and motivating hesitant learners9. However, these two literatures largely proceed on parallel tracks10. Technology-focused studies often emphasize functional utility for language drills or information access, neglecting its potential as a medium for authentic artistic creation11. Conversely, advocacy for arts integration frequently remains anchored in analogue mediums, overlooking the digital realities of modern students' lives12. This disjunction creates a significant theoretical and practical void. We lack a clear, empirical understanding of the specific mechanisms by which digital art-making, such as creating video poetry, digital storytelling, or electronic music compositions, influences core educational outcomes13. The critical question is not whether technology or art is beneficial in isolation, but how their combined force can be harnessed to navigate the digital paradox, transforming potential distractions into engines of deep, meaningful learning14.
This study directly addresses this gap by constructing and testing an integrated theoretical model15. Moving beyond siloed inquiries, the framework posits that the key drivers Digital Art Integration, Perceived Value of Art, and Technology Self-Efficacy act in concert to enhance Student Engagement, which, in turn, is hypothesized to improve Academic Performance in English16. Figure 1 presents the integrated research model. Crucially, the model incorporates Digital Literacy as a moderating variable, testing a core tenet of the digital paradox: the benefits of technologically mediated pedagogy are not universal but are contingent on the user's capacity to wield it effectively17. The integrated model and Partial Least Squares Structural Equation Modeling (PLS-SEM) are particularly well-suited for this investigation, offering distinct advantages over common alternatives such as covariance-based SEM. PLS-SEM is ideal for exploratory research aimed at theory development in complex models, as it places minimal demands on data distribution and sample size while excelling at handling formative constructs and higher-order models18. This approach allows the research not only to identify significant relationships but also to quantify the mediating role of engagement and the conditional influence of digital literacy, providing a nuanced, holistic picture of the learning process. The theoretical contributions of this research are threefold. First, it synthesizes disparate theoretical domains by bridging constructivist learning theory, which emphasizes active knowledge building19, with the affective filter hypothesis from language acquisition and models of technology acceptance20. This synthesis posits that digital art-making lowers the affective filter for language production, making learning more accessible and engaging. Second, the study operationalizes and empirically tests the abstract concept of the digital paradox. By modeling Digital Literacy as a moderator, the research moves from a generalized acknowledgment of technology's dual-edged nature to an investigation of its boundary conditions21. Third, it provides practical insights into for whom and under what conditions digital art-based learning is most effective22. It is important to note that the proposed model is most applicable in undergraduate humanities contexts where both technological access and curricular flexibility for creative pedagogy exist. A primary limitation is its focus on self-reported perceptions and its specific cultural context within Eastern Chinese universities, which may affect generalizability. Future research should incorporate longitudinal and behavioral data to further validate the causal pathways proposed23.
Literature review
The discourse surrounding technology in education is often characterized by a triumphalist narrative, positing digital tools as an unambiguous force for modernization and improved learning outcomes24. Within English Education, this has translated into pedagogies that leverage digital platforms for collaborative writing, grammar instruction, and access to multimodal texts25. Proponents argue that such integration develops the multiliteracies essential for navigating a connected world26. However, a robust counter-narrative challenges this techno-optimism, pointing to a "digital paradox" wherein the very tools designed to enhance engagement can inadvertently foster distraction, promote superficial cognitive processing, and erode the sustained attention required for deep literary engagement and complex composition27. This paradox suggests that the mere presence of technology is insufficient; its pedagogical application must be deliberately designed to counteract its inherent fragmentary tendencies28. Concurrently, a longstanding and separate body of scholarship has championed the role of the arts in fostering deep, meaningful learning29. Rooted in constructivist and socio-cultural theories, this tradition argues that arts-based pedagogies encompassing drama, visual art, music, and creative movement engage learners not as passive recipients but as active constructors of meaning30. In the context of English language learning, the arts are posited to lower the affective filter, a psychological barrier to language acquisition31, by providing alternative pathways for expression and interpretation. The work of Greene32, is particularly salient, emphasizing how aesthetic education "releases the imagination" and enables learners to perceive the world from multiple perspectives, a capacity fundamental to literary analysis and empathetic communication33. The value of the arts, therefore, lies not in decorative add-ons but in their power to cultivate the very cognitive and affective dispositions such as tolerance for ambiguity, empathy, and symbolic thinking that are the hallmarks of advanced literacy34.
Despite the rich potential of both domains, the literature on technology integration and arts-based learning has, with few exceptions, evolved in parallel, creating a significant theoretical and empirical schism33,34. Research on digital tools often prioritizes efficiency, scalability, and functional literacy, sometimes at the expense of the affective and imaginative dimensions of learning that the arts so powerfully activate35,36. Conversely, advocacy for arts integration, while profound in its philosophical underpinnings, often remains tethered to traditional37, analogue mediums, failing to adequately account for the digitally saturated ecologies in which contemporary students are immersed38,39. This bifurcation has resulted in a critical gap: a lack of empirical models that investigate the synergistic interplay between using digital tools specifically for artistic creation and core outcomes in English education40. The question is no longer whether technology or art is beneficial, but how to engineer their conceptual and practical integration to resolve the digital paradox, transforming technology from a potential source of distraction into a conduit for creative, deeply engaging learning.
Research on digital storytelling, for instance, has shown it can enhance narrative writing skills and student motivation41, while work in new media literacies explores how digital video production fosters critical analysis42. However, these studies often focus on a single application or tool, lacking a comprehensive theoretical framework that models the psychological and pedagogical mechanisms at play43. They fail to systematically account for the role of foundational beliefs, such as students' self-efficacy in using technology44 or their perceived value of art45, which likely precondition the success of any integrated intervention. Furthermore, the contingent role of students' digital literacy, the very variable that may determine whether the digital paradox manifests as a barrier or a gateway, remains largely unexplored in this specific context46. Therefore, the literature culminates in a clear imperative: to develop and test an integrated model that not only bridges these disparate scholarly conversations but also quantifies the complex causal pathways and boundary conditions that define effective, art-infused digital pedagogy for 21st-century English Education. The conceptual framework, including all study variables and their proposed path relationships, is presented in Figure 1.
البروتوكول
This study was conducted with approval from Wanjiang University of Technology in compliance with ethical guidelines for human subject's research. Informed consent was obtained from all participants prior to their involvement, ensuring they were fully informed of the study's purpose, survey-based procedures, voluntary nature, and their right to withdraw at any time without consequence. The research tools employed are listed in the Table of Materials.
1. Research design
This study employed a quantitative, non-experimental research design utilizing a cross-sectional survey to collect data. The primary analytical technique was Partial Least Squares Structural Equation Modeling (PLS-SEM), chosen for its ability to model complex relationships involving latent variables and its suitability for predictive research objectives and theory development. The research model posits three independent variables: Digital Art Integration, Perceived Value of Art, and Technology Self-Efficacy, a mediating variable of Student Engagement, and a dependent variable of Academic Performance in English. Furthermore, Digital Literacy is included as a moderating variable to test its influence on the relationship between Student Engagement and Academic Performance in English. This design allows for the simultaneous testing of the direct, indirect, and moderating effects within the proposed theoretical framework, providing a comprehensive examination of the mechanisms underpinning art-based digital learning in English education.
2. Population and sampling
The target population for this research was undergraduate learners enrolled in English language or literature courses at public universities in China. A non-probability purposive sampling method was applied to select institutions known to have incorporated technology into their humanities curricula. In these chosen institutions, convenience sampling was also used to select the sample from available English classes. The sample size was determined using a two-method approach to provide adequate methodology and power. The commonly known "10-times rule" of Partial Least Squares Structural Equation Modeling (PLS-SEM) was used first: 10 times the largest number of structural paths from a latent variable to a latent variable in the neural net, or present in the data already, providing a lower bound. Second, a prior step had conducted a power analysis using G*Power software, with a sample size to test a linear multiple regression with a medium effect size (f2 = 0.15), a level of significance of 0.05, and a statistical power of 0.80. This estimation revealed that at least 265 individuals would be needed in the study to have sufficient power to detect significant effects. To attain robustness and account for possible data dropouts, the survey was administered with a target of 265 full and valid responses, which satisfies the rule of thumb for statistical power analysis (roughly 265) and the rigorous requirements of the statistical power analysis.
3. Data collection procedures
Data collection was systematically conducted over a four-week period during the academic semester of March-April 2024, following formal ethical approval from the University's Institutional Review Board (IRB-EDU-2024-015). The respondents were undergraduate students majoring in English Language and Literature from three public universities in Eastern China, specifically selected to represent a diverse range of technological integration approaches in humanities education. These participants were enrolled in core English courses, including Advanced Reading Comprehension, Literary Theory, and Academic Writing, ensuring they had substantial experience with both traditional and potential digital pedagogical approaches. The primary data collection method involved in-person, paper-based survey administration during scheduled class sessions to ensure a controlled environment and maximize participation rates. Prior to survey distribution, course instructors provided institutional access and allocated approximately 20 min of class time for the procedure. Each participant received a comprehensive research information sheet detailing the study's academic purpose, the voluntary nature of participation, confidentiality safeguards, including the anonymization of responses, and the right to withdraw without penalty. Written informed consent was explicitly obtained from all participants before questionnaire distribution, moving beyond implied consent to strengthen ethical rigor. Researchers and trained research assistants were present throughout all data collection sessions to standardize administration procedures, ensure consistent instructions across classes, and provide immediate clarification for participant inquiries. The paper-based format was strategically chosen to minimize digital distractions and reduce the common method bias associated with online surveys. Of the 350 questionnaires distributed across the three universities, 312 were returned, representing an initial response rate of 89.1%. Following data collection, rigorous screening procedures identified and removed 47 responses due to straight-lining response patterns, random answering, or excessive missing data (>15%), resulting in a final valid sample of 265 complete responses for analysis. This final sample size precisely meets the predetermined target established through power analysis requirements for the PLS-SEM methodology. All collected data were subsequently digitized using double-entry verification processes to ensure accuracy before statistical analysis.
4. Instrument and measures
To validate the adapted measurement scales for the Chinese undergraduate context, a pilot study was conducted prior to the main data collection. The pilot involved 45 students from a similar demographic, and the results were analyzed to assess the scales' reliability and comprehensibility. The pilot analysis yielded satisfactory initial Cronbach's alpha coefficients for all constructs, with values ranging from 0.82 to 0.91, confirming internal consistency. Furthermore, the pilot allowed for the refinement of item wording based on participant feedback to ensure cultural and contextual appropriateness before administration in the primary study.
5. Digital art integration
This scale was measured using a scale adapted from Çakır and Kahveci47. The original instrument's three dimensions were contextually modified to fit the domain of English education. The dimension of 'Art Integration in Social Studies Course' (20 items) was reworded to 'Digital Art Integration in English Course' to assess the frequency and depth of using digital art forms in learning activities. The 'Attitude Towards Art' dimension (8 items) was retained to capture students' general appreciation for artistic expression. Finally, the 'Attitude Towards Social Studies Course' dimension (12 items) was adapted to 'Attitude Towards English Course' to gauge students' disposition towards the subject itself. Sample items include "I often use digital tools to create artistic projects for my English class" (Integration) and "I find art to be an important part of my life" (Attitude).
6. Perceived value of art
It was assessed using a scale adapted from Sweeney and Soutar48. This multidimensional scale was employed to measure the utility students derive from art in their learning process. The four original dimensions were utilized: 'Quality Value' (6 items), which pertains to the perceived excellence and caliber of art-based learning; 'Emotional Value' (5 items), which refers to the affective states or feelings generated; 'Social Value' (4 items), which concerns the enhancement of social self-concept; and 'Price Value' (4 items), which was re-conceptualized as the perceived cost in terms of time and effort relative to the benefits gained. A sample item from the Emotional Value dimension is "Learning English through art activities is enjoyable."
7. Technology self-efficacy
It was evaluated by adapting the 10-item scale from Tatar et al.49. This construct measures students' confidence in their ability to successfully use a range of digital technologies necessary for academic tasks. The items were slightly modified to specify the context of English learning activities. Respondents indicated their level of agreement with statements such as "I feel confident using new software required for my English course projects."
8. Student engagement
This scale was adapted from Eerdemutu et al.50 and measures the multidimensional nature of student involvement. The instrument's three dimensions, each containing 3 items, were used: 'Behavioral Engagement', which refers to the observable actions of participation and effort; 'Emotional Engagement', which pertains to positive and negative affective reactions; and 'Cognitive Engagement', which involves the investment of psychological resources in learning. A sample item for Cognitive Engagement is "When studying English through digital art, I try to understand the material as deeply as possible."
9. Academic performance
Academic Performance in English was evaluated using a self-perception scale adapted from Yu et al.51, as cited in Mehrvarz et al.52. This 4-item scale measures students' self-assessment of their academic achievement and competence in English, providing a subjective yet valuable indicator of performance. A sample item is "I believe I have achieved excellent learning outcomes in my English course this semester."
10. Digital literacy
It is a moderating variable, evaluated using the comprehensive 29-item instrument by Rodríguez-de-Dios et al.53. This scale spans six distinct dimensions to provide a holistic assessment of digital competence: 'Technological Literacy' (7 items), which covers basic operational skills; 'Information Literacy' (5 items), concerning the search and evaluation of online information; 'Communication Literacy' (3 items), related to digital interaction and collaboration; 'Critical Literacy' (5 items), which assesses the critical evaluation of digital content; 'Personal Security Literacy' (5 items), focusing on the protection of personal data; and 'Device Security Literacy' (4 items), concerning knowledge of malware and device safety. Respondents rated their agreement with statements like "I know how to use advanced search functions to find information online" (Information Literacy).
11. Data analysis strategy
The data analysis followed a two-stage PLS-SEM procedure as recommended by Hair et al.54. The first stage involved assessing the measurement model to ensure the reliability and validity of the constructs. This included examining internal consistency reliability using Composite Reliability, indicator reliability through outer loadings, and convergent validity via the Average Variance Extracted (AVE). Discriminant validity was assessed using the Fornell-Larcker criterion and the Heterotrait-Monotrait (HTMT) ratio of correlations. The second stage evaluated the structural model. This involved checking for collinearity using the Variance Inflation Factor (VIF), assessing the significance and relevance of the path coefficients via a bootstrapping procedure with 5,000 subsamples, and evaluating the model's predictive power using the coefficient of determination (R²) and the predictive relevance (Q²) via the blindfolding procedure. The moderating effect of Digital Literacy was tested by including the interaction term in the model and examining its significance and effect size (f²). All analyses were conducted using the SmartPLS 4 software.
النتائج
Descriptive statistics
Descriptive statistics for the six latent constructs in the final sample (N=265) are reported in Table 1, and their mean values are summarized in Figure 2. The mean scores are 5.12 for Digital Art Integration, 5.65 for Perceived Value of Art, 5.28 for Technology Self-Efficacy, 5.41 for Student Engagement, 5.09 for Academic Performance, and 5.74 for Digital Literacy. Digital Literacy has the highest mean, while Academic Performance has the lowest. Correlations among the constructs are reported in Table 2.
Measurement model
The The measurement model was assessed for internal consistency reliability, convergent validity, and discriminant validity. The measurement model is shown in Figure 3. Indicator loadings, Cronbach’s alpha, composite reliability (CR), and average variance extracted (AVE) are reported in Table 3. Cronbach’s alpha coefficients are presented uniformly as decimals to three decimal places. The HTMT results are reported in Table 4.
Hypotheses testing
The structural model was assessed to test the proposed hypotheses, examining the direct, mediating, and moderating relationships within the research framework. Using a bootstrapping procedure with 5,000 subsamples, the significance of the path coefficients (β), t-statistics, and p-values was calculated to determine the support for each hypothesis. The results of the hypothesis testing are presented in Table 5.
PLS predict
The predictive power of the structural model was assessed using PLS Predict, a procedure that evaluates the model's out-of-sample predictive capability. This analysis employs a k-fold cross-validation approach to generate prediction errors for the key endogenous construct, Academic Performance. The results are presented in Table 6, comparing the root mean square errors (RMSEs) of the PLS-SEM model against a naive linear model (LM) benchmark. PLS Predict Assessment for Academic Performance is visualized in Figure 4.
DATA AVAILABILITY:
The data for this study are provided in Supplementary File 1.
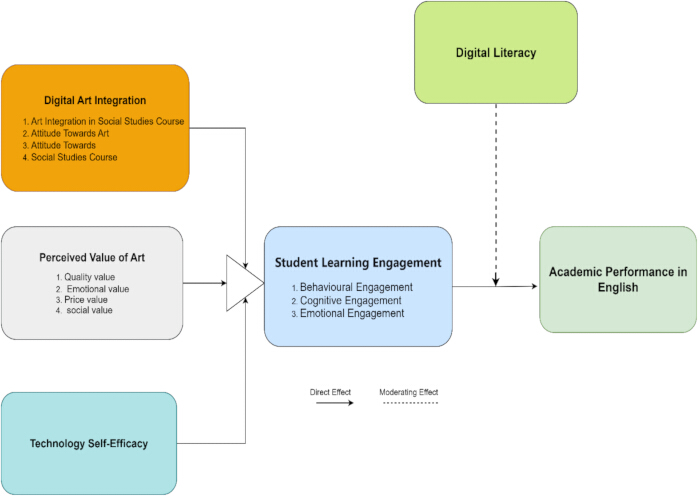
Figure 1: Research Model. The figure presents the integrated research model. It illustrates how Digital Art Integration, Perceived Value of Art, and Technology Self-Efficacy directly influence Student Learning Engagement, which, in turn, determines Academic Performance in English. The model uniquely incorporates Digital Literacy as a moderator, testing its conditional effect on the relationship between engagement and performance, thereby exploring the core "digital paradox" of modern education. Please click here to view a larger version of this figure.
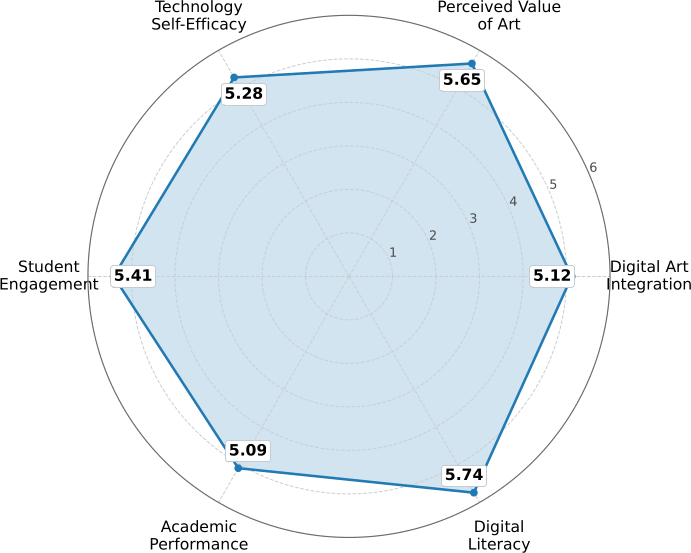
Figure 2: Mean values of the six latent constructs (N=265). The radar chart presents the mean scores for Digital Art Integration (5.12), Perceived Value of Art (5.65), Technology Self-Efficacy (5.28), Student Engagement (5.41), Academic Performance (5.09), and Digital Literacy (5.74). Digital Literacy has the highest mean, and Academic Performance has the lowest. Please click here to view a larger version of this figure.
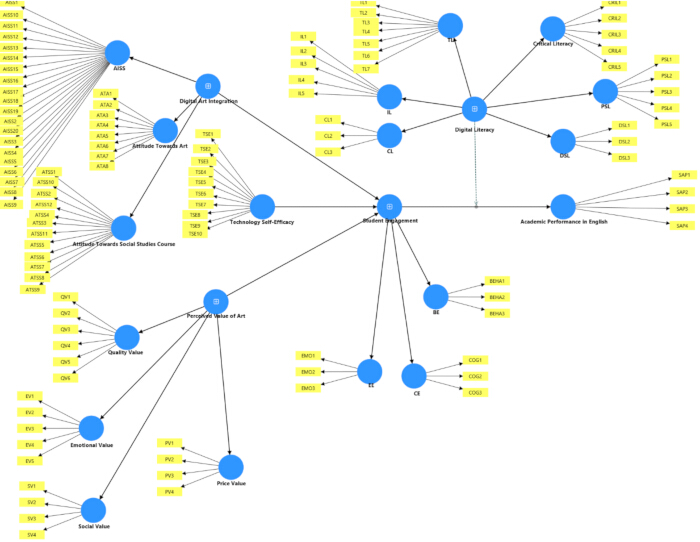
Figure 3: Established measurement model. The figure presents the established measurement model illustrating the relationships between latent constructs and their observed indicators. Each construct is represented by a blue node, while the yellow nodes denote the measured items used to operationalize the constructs. The model demonstrates satisfactory construct specification across domains such as digital literacy, student engagement, attitudes, and academic performance. Overall, it provides a clear structural foundation for validating the reliability and validity of the proposed constructs in the study. Please click here to view a larger version of this figure.
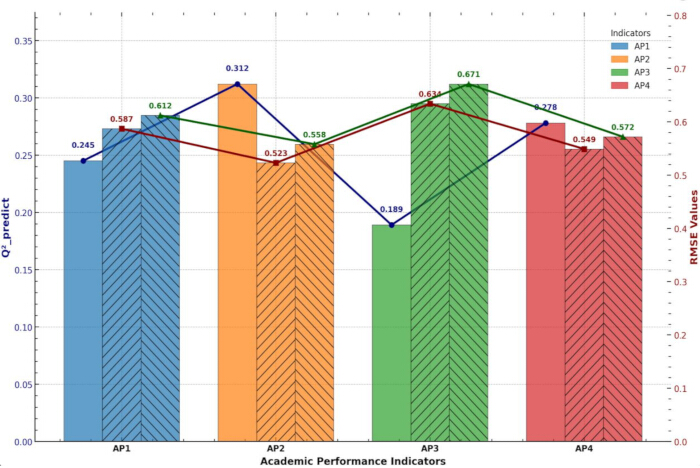
Figure 4: PLS predict assessment for academic performance. The figure presents the PLS-Predict assessment for academic performance indicators (AP1-AP4), combining Q²_predict values and RMSE comparisons. The positive Q²_predict values across all indicators indicate that the model demonstrates adequate out-of-sample predictive relevance. Lower RMSE values for the PLS model compared to benchmark predictions suggest superior predictive accuracy. Overall, the results confirm the robustness and predictive capability of the structural model for academic performance outcomes. Please click here to view a larger version of this figure.
| Construct | Number of Items | Mean | Standard Deviation | Skewness | Kurtosis |
| Digital Art Integration | 40 | 5.12 | 0.89 | -0.45 | 0.32 |
| Perceived Value of Art | 19 | 5.65 | 0.76 | -0.61 | 0.85 |
| Technology Self-Efficacy | 10 | 5.28 | 0.95 | -0.32 | -0.11 |
| Student Engagement | 9 | 5.41 | 0.82 | -0.53 | 0.47 |
| Academic Performance | 4 | 5.09 | 1.02 | -0.28 | -0.24 |
| Digital Literacy | 29 | 5.74 | 0.71 | -0.68 | 1.02 |
Table 1: Descriptive statistics of the latent constructs (N = 265). This table presents the descriptive statistics of the latent constructs based on responses from 265 participants. The mean scores for all constructs are above the scale midpoint, indicating generally positive perceptions of digital art integration, digital literacy, engagement, and academic performance. The relatively low standard deviations suggest moderate variability and consistent responses among participants. Negative skewness values across constructs indicate a tendency toward higher agreement, while kurtosis values close to zero (and within acceptable limits) suggest that the data are approximately normally distributed. Overall, the results support the suitability of the data for subsequent multivariate analyses.
| Construct | 1 | 2 | 3 | 4 | 5 | 6 |
| 1. Digital Art Integ. | 0.824 | |||||
| 2. Perceived Value Art | 0.487** | 0.791 | ||||
| 3. Tech. Self-Efficacy | 0.421** | 0.352** | 0.865 | |||
| 4. Student Engagement | 0.532** | 0.598** | 0.445** | 0.833 | ||
| 5. Academic Performance | 0.411** | 0.467** | 0.383** | 0.621** | 0.889 | |
| 6. Digital Literacy | 0.395** | 0.324** | 0.512** | 0.387** | 0.301** | 0.803 |
Table 2: Correlation matrix of latent constructs. This table presents the correlation matrix of the latent constructs, showing that all constructs are positively and significantly correlated with one another at the 0.01 level, indicating meaningful relationships within the proposed model. Digital Art Integration demonstrates moderate correlations with Perceived Value of Art, Student Engagement, and Academic Performance, suggesting its important role in shaping both attitudinal and outcome variables. Student Engagement shows the strongest association with Academic Performance, highlighting its central mediating role in learning outcomes. The diagonal values, representing the square roots of AVE, are higher than the corresponding inter-construct correlations, supporting adequate discriminant validity among the constructs. Overall, the results indicate a coherent and theoretically consistent pattern of relationships suitable for structural model testing.
| Construct | Dimension | Items | Loadings Range | Cronbach's Alpha (α) | Composite Reliability (CR) | Average Variance Extracted (AVE) |
| Digital Art Integration | Art Integration | 20 | 0.712 - 0.861 | 0.930 | 0.942 | 0.679 |
| Attitude Towards Art | 8 | 0.734 - 0.845 | 0.890 | 0.917 | 0.612 | |
| Attitude Towards Course | 12 | 0.705 - 0.828 | 0.910 | 0.924 | 0.587 | |
| Perceived Value of Art | Quality Value | 6 | 0.768 - 0.852 | 0.900 | 0.926 | 0.678 |
| Emotional Value | 5 | 0.791 - 0.869 | 0.910 | 0.935 | 0.743 | |
| Price Value | 4 | 0.723 - 0.841 | 0.840 | 0.892 | 0.676 | |
| Social Value | 4 | 0.745 - 0.831 | 0.858 | 0.901 | 0.695 | |
| Technology Self-Efficacy | - | 10 | 0.752 - 0.884 | 0.924 | 0.939 | 0.748 |
| Student Engagement | Cognitive Engagement | 3 | 0.831 - 0.879 | 0.872 | 0.921 | 0.795 |
| Emotional Engagement | 3 | 0.845 - 0.891 | 0.889 | 0.931 | 0.818 | |
| Behavioral Engagement | 3 | 0.821 - 0.866 | 0.861 | 0.914 | 0.779 | |
| Academic Performance | - | 4 | 0.851 - 0.914 | 0.905 | 0.933 | 0.777 |
| Digital Literacy | Technological Literacy | 7 | 0.718 - 0.842 | 0.887 | 0.912 | 0.601 |
| Personal Security | 5 | 0.731 - 0.856 | 0.871 | 0.906 | 0.659 | |
| Critical Literacy | 5 | 0.754 - 0.845 | 0.882 | 0.915 | 0.684 | |
| Device Security | 4 | 0.722 - 0.838 | 0.834 | 0.888 | 0.665 | |
| Information Literacy | 5 | 0.768 - 0.861 | 0.896 | 0.922 | 0.703 | |
| Communication Literacy | 3 | 0.795 - 0.854 | 0.845 | 0.905 | 0.76 |
Table 3: Measurement Model Assessment (Reliability and Convergent Validity). Table 3 reports indicator loading ranges and internal consistency and convergent validity statistics for the constructs and their dimensions. Indicator loadings range from 0.705 to 0.914, Cronbach’s alpha from 0.834 to 0.930, composite reliability (CR) from 0.888 to 0.942, and average variance extracted (AVE) from 0.587 to 0.818. Cronbach’s alpha, CR, and AVE are reported as decimal coefficients, with Cronbach’s alpha presented consistently to three decimal places. These statistics are reported for assessment of the measurement model’s internal consistency and convergent validity.
| Construct | 1 | 2 | 3 | 4 | 5 | 6 |
| 1. Digital Art Integ. | ||||||
| 2. Perceived Value Art | 0.531 | |||||
| 3. Tech. Self-Efficacy | 0.462 | 0.387 | ||||
| 4. Student Engagement | 0.581 | 0.641 | 0.488 | |||
| 5. Academic Performance | 0.449 | 0.509 | 0.421 | 0.678 | ||
| 6. Digital Literacy | 0.433 | 0.355 | 0.561 | 0.424 | 0.33 |
Table 4: Discriminant validity assessment using HTMT. This table presents the discriminant validity assessment using the Heterotrait-Monotrait (HTMT) ratio, which indicates satisfactory discriminant validity across all latent constructs. All HTMT values are well below the conservative threshold of 0.85, suggesting that each construct is empirically distinct from the others. Although HTMT values are relatively higher between Student Engagement and Academic Performance and between Student Engagement and Perceived Value of Art, they remain within acceptable limits and are theoretically justifiable. Overall, the results confirm that the constructs capture unique concepts without excessive overlap, supporting the adequacy of the measurement model for further structural analysis.
| Hypothesis | Relationship | Beta (β) | t-value | p-value | f² | Decision |
| Direct Effects | ||||||
| H1 | Digital Art Integration → Student Engagement | 0.274 | 5.124 | < 0.001 | 0.085 | Supported |
| H2 | Perceived Value of Art → Student Engagement | 0.381 | 7.892 | < 0.001 | 0.171 | Supported |
| H3 | Technology Self-Efficacy → Student Engagement | 0.198 | 3.876 | < 0.001 | 0.045 | Supported |
| H4 | Student Engagement → Academic Performance | 0.547 | 11.453 | < 0.001 | 0.347 | Supported |
| Mediating Effects | ||||||
| H5 | DAI → SE → AP (Indirect Effect) | 0.15 | 4.521 | < 0.001 | - | Supported |
| H6 | PVA → SE → AP (Indirect Effect) | 0.208 | 6.112 | < 0.001 | - | Supported |
| H7 | TSE → SE → AP (Indirect Effect) | 0.108 | 3.445 | 0.001 | - | Supported |
| Moderating Effect | ||||||
| H8 | DL x SE → Academic Performance | -0.095 | 2.341 | 0.019 | 1.80% | Supported |
Table 5: Results of structural model and hypotheses testing. This table presents the results of the structural model and hypotheses testing, revealing strong support for all proposed relationships. The direct effects indicate that Digital Art Integration, Perceived Value of Art, and Technology Self-Efficacy have significant positive influences on Student Engagement, with Perceived Value of Art showing the strongest effect. Student Engagement, in turn, exerts a substantial positive impact on Academic Performance, with a large effect size, confirming its central role in the model. The mediation analysis further shows that Student Engagement significantly mediates the relationships between Digital Art Integration, Perceived Value of Art, Technology Self-Efficacy, and Academic Performance, highlighting its mechanism in translating inputs into performance outcomes. Additionally, the moderating effect of Digital Literacy on the relationship between Student Engagement and Academic Performance is significant but negative, suggesting that higher levels of digital literacy slightly weaken this relationship. Overall, the findings confirm the robustness of the structural model and underscore the critical role of engagement in enhancing academic performance within a digitally enriched learning environment.
| Indicator | Q²_predict | PLS_RMSE | LM_RMSE |
| AP1 | 0.312 | 0.841 | 0.862 |
| AP2 | 0.285 | 0.867 | 0.901 |
| AP3 | 0.334 | 1 | 0.845 |
| AP4 | 0.301 | 1 | 0.888 |
Table 6: PLS predict assessment for academic performance. This table presents the PLS-Predict assessment for the academic performance indicators, demonstrating the model's out-of-sample predictive relevance. All Q²_predict values are positive, indicating that the model has adequate predictive power for all academic performance measures. For most indicators, the RMSE values of the PLS model are lower than those of the linear model, suggesting superior predictive accuracy of the PLS approach. Although slight variations are observed across indicators, the overall results confirm that the structural model exhibits acceptable and meaningful predictive performance for academic outcomes.
Supplementary File 1: The datasets used for this study. Please click here to download this file.
المناقشة
This study tested a comprehensive model exploring the interplay between digital art integration, student perceptions, and academic performance in English education. The findings empirically validate the central hypothesis that student engagement serves as the pivotal mediating mechanism, fully explaining how digital art integration, perceived art value, and technology self-efficacy influence academic performance55,56,57,58. This mediation, particularly robust for the path from perceived value to performance, quantitatively demonstrates that fostering an appreciation for art's affective dimensions is a critical catalyst for the deep cognitive and behavioral engagement required for learning59. This integrated finding moves beyond siloed advocacy to show how artistic pedagogy translates into measurable benefits, challenging educators to simultaneously address all three drivers to optimize engagement. A nuanced and critical discovery is the significant negative moderating effect of digital literacy on the engagement-performance link60. This counterintuitive result refines the "digital paradox," suggesting that for highly literate students, engagement's positive impact on performance is slightly attenuated. This may be explained by cognitive load theory, where proficient students potentially engage with tools at a more complex level, introducing extraneous load, or find technology less uniquely motivating61. This cautions against uniform approaches, indicating that support for highly literate learners should focus on channeling skills toward focused objectives62.
The study's outcomes are intrinsically linked to its methodological protocol, which offers distinct advantages for investigating such complex models. A key benefit over common alternatives, such as covariance-based SEM, is the use of PLS-SEM, which is ideal for exploratory, prediction-oriented research with complex models and smaller sample sizes63. The protocol's critical steps for validity and reproducibility included: (1) the in-person, paper-based survey administration in controlled classroom settings, which maximized response rates and minimized digital distraction bias; (2) rigorous post-collection screening for straight-lining and missing data, ensuring a robust final sample (N = 265) precisely meeting power analysis targets; and (3) the double-entry digitization of paper responses to prevent data transfer errors.
A methods-focused comparison highlights that while online surveys are common, this protocol's paper-based approach was chosen specifically to reduce common method bias and digital fatigue, factors particularly relevant when measuring engagement with digital tools64. Minimal troubleshooting was required; however, instructors must be briefed beforehand to ensure allocated class time is respected. The main modification for future replications would be to include a brief, embedded instructional manipulation check to further ensure data quality65. Compared to studies examining variables in isolation, this integrated protocol combining validated scale adaptation, controlled data collection, and advanced multivariate analysis enables the simultaneous testing of multiple relationships and moderating effects66. It confirms known relationships (e.g., the positive role of technology self-efficacy) while uncovering novel complexities, such as the moderation effect of digital literacy. The protocol thus provides a replicable blueprint for holistically investigating multifaceted educational phenomena, demonstrating that methodological rigor in data collection and analysis is paramount for revealing the nuanced interdependencies that define modern learning environments.
Practical implications
This research has several practical implications for educational practice, curriculum design, and teacher professional development. Teachers and schools must critically and systematically incorporate the digital art project throughout the English course and beyond superficial applications of technology, resulting in rich, genuine creative output. Moreover, the intrinsic value of art in developing critical thinking and empathy should be clearly stated and put into practice by instructors to instill in students a positive attitude towards art-based learning. To neutralize the counterintuitive moderating impact of digital literacy, professional learning ought to educate teachers on strategies to focus highly digitally literate students on the learning outcomes of the math CoL, which might involve presenting more goal-oriented, challenging tasks to avoid misallocation of cognitive load. Lastly, a differentiated approach to instruction is also suggested, with basic technology education distribution to support the self-efficacy aspect in underperforming students, with higher-level learners shepherded towards using their expertise to engage in more analysis and creative activity to ensure that the introduction of digital art integration is effective in improving academic performance across all students.
Conclusion
This article aimed to unveil the frustrations of the digital paradox in current-day English education, ultimately supporting the view that introducing digital artwork, when strategically introduced, is a potent pedagogical answer rather than a technological fling. The study empirically justifies an overall model showing that the combination of digital art integration, perceived value of art, and technology self-efficacy strongly relies on the mediating variable of student engagement, which represents a crucial pathway towards the attainment of core educational outcomes. But perhaps the most interesting lesson is the subtle maneuver of digital literacy, which, surprisingly, undermines the engagement-performance relationship, suggesting that strong digital savviness can be counterproductive and result in less linear conversion of interactions with technology into academic benefits. This finding fundamentally challenges the prevailing orthodoxy that more digital skill is invariably better, forcing a reevaluation of how we support the "digital native" in the classroom. By successfully bridging the theoretical gap between arts advocacy and technology integration literature, this study offers a new, evidence-based framework for rethinking English pedagogy, one that champions a deliberate, value-driven, and reflective use of digital art tools to foster deep engagement, while cautioning against a one-size-fits-all approach that overlooks the complex interplay between student competencies and learning technologies.
Limitations and future research
Despite its contributions, this study is subject to several limitations that offer fruitful avenues for future research. The cross-sectional design precludes definitive causal inferences, and the reliance on self-reported data, particularly for academic performance, may introduce biases such as social desirability. Furthermore, the sample was drawn from a specific cultural and educational context (Chinese undergraduates), which may limit the generalizability of the findings to other student populations and educational systems. The intriguing negative moderating effect of digital literacy warrants deeper investigation using qualitative methods to unravel the underlying cognitive and behavioral mechanisms. Future studies should therefore employ longitudinal designs to trace the evolution of these relationships over time, incorporate objective measures of academic achievement, and replicate the model in diverse cultural settings to enhance its external validity. Investigating other potential moderators, such as learning style or personality type, could also provide a more granular understanding of who benefits most from digital art-based learning.
الإفصاحات
All authors declare no conflicts of interest.
شكر وتقدير
This work was sponsored in part by Anhui Province Higher Education Scientific Research Program (2023AH040334), National Project for Foreign Language Teaching and Research in Universities (202412144AH), Anhui Province Quality Engineering Curriculum Construction Project (2024aijy514) and Domestic Visiting and Training Program for Young Backbone Teachers of Anhui Province(JNFX2025104).
المواد
| الاسم | الشركة | رقم فهرسي | التعليقات |
|---|---|---|---|
| Construct Operationalization | Define and measure variables using established, adapted scales. | - Digital Art Integration (Çakir & Kahveci) - Perceived Value of Art (Sweeney & Soutar) - Technology Self-Efficacy (Tatar et al.) - Student Engagement (Eerdemutu et al.) - Academic Performance (Yu et al.; Mehrvarz et al.) - Digital Literacy (Rodríguez-de-Dios et al.) | |
| Data Collection Procedures | Collect valid and ethically compliant data from participants. | - In-person Paper-based Surveys - Instructor-Administered Classroom Data Collection - Fraudulent Response Screening (straight-lining, random responses, >15% missing) | |
| Data Preparation & Screening | Prepare dataset for analysis and ensure data quality. | - Double-Entry Data Digitization - Missing Data Assessment - Removal of Low-Quality Responses | |
| Ethical Protocol & Research Approval | Ensure compliance with human-subject research standards and obtain informed consent. | - IRB Approval (IRB-EDU-2024-015) - Informed Consent Procedures | |
| Instrument Development & Validation | Adapt and validate measurement scales for cultural and contextual fit. | - Pilot Study (n = 45) - Reliability Check: Cronbach’s Alpha (0.82–0.91) - Refinement of Item Wording | |
| Measurement Model Evaluation (Stage 1 PLS-SEM) | Assess construct reliability and validity prior to structural testing. | - Composite Reliability - Outer Loadings - AVE (Convergent Validity) - Fornell-Larcker Criterion - HTMT (Discriminant Validity) | |
| Moderation and Mediation Analysis | Examine the indirect effects and the moderating role of Digital Literacy. | - Interaction Term Modeling (DL × IVs) - Effect Size (f²) - Significance Testing via Bootstrapping | |
| Population, Sampling & Power Determination | Define target population, sampling approach, and calculate minimum required sample size. | - Sampling: Purposive + Convenience - Sample Size Rules: PLS-SEM 10-Times Rule - G*Power Analysis (f² = 0.15, α = 0.05, power = 0.80 → min = 265) | |
| Research Design Development | Establish overall methodological framework and theoretical structure of the study. | - Quantitative, Non-Experimental, Cross-Sectional Design - Research Model (PLS-SEM Framework) with IVs (DAI, PVA, TSE), Mediator (SE), DV (AP), Moderator (DL) | |
| Software & Analytical Tools | Implement all analyses using appropriate statistical software. | - SmartPLS 4 | |
| Structural Model Evaluation (Stage 2 PLS-SEM) | Test hypothesized relationships, mediation, and model explanatory power. | - VIF (Collinearity Diagnostics) - Bootstrapping (5,000 subsamples) for Path Significance - R² (Predictive Power) - Q² (Predictive Relevance via Blindfolding) |
المراجع
- Benedik, E., Gruber, A. Rethinking education: Unleashing the power of digital innovation-paradigm shift in examination culture-digital media and innovative forms of examination. INTED2024 Proceedings. , 854-860 (2024).
- Carson, J. Rethinking a Bachelor of Arts for the 21st-century precariat. Stud High Educ. 47 (7), 1477-1487 (2022).
- Ashbridge, C., Clarke, M., Bell, B. T., Sauntson, H., Walker, E. Democratic citizenship, critical literacy and educational policy in England: a conceptual paradox. Camb J Educ. 52 (3), 291-307 (2022).
- Levin, I., Semenov, A. L., Gorsky, M. Smart learning in the 21st century: Advancing constructionism across three digital epochs. Educ Sci. 15 (1), 45(2025).
- Khoso, A. K., Honggang, W., Darazi, M. A. Empowering creativity and engagement: the impact of generative artificial intelligence usage on Chinese EFL students' language learning experience. Comput Hum Behav Rep. 18, 100627(2025).
- Nikolaou, P. Museums and the post-digital: Revisiting challenges in the digital transformation of museums. Heritage. 7 (3), 1784-1800 (2024).
- Glassman, M., Lin, T. J., Ha, S. Y. Concepts, collaboration, and a company of actors: a Vygotskian model for concept development in the 21st century. Oxf Rev Educ. 49 (2), 137-152 (2023).
- Baena-Morales, S., Sánchez-Jarque, M., Ferriz-Valero, A., Bofill-Herrero, A. The paradox of experience: Generational analysis of AI integration in physical education using the iTPACK framework. Phys Educ Sport Pedagogy. , 1-22 (2025).
- Afzal, M., Junejo, A., Khoso, A. K. Bridging instructional excellence and student success: exploring how faculty management influences academic performance and loyalty through the lens of student self-efficacy. Int Premier J Lang Lit. 3 (1), 54-75 (2025).
- Zakopoulos, V., Makri, A., Ntanos, S., Tampakis, S. Drama/theatre performance in education through the use of digital technologies for enhancing students' sustainability awareness: a literature review. Sustainability. 15 (18), 13387(2023).
- Czerniewicz, L. Multi-layered digital inequalities in HEIs: the paradox of the post-digital society. New visions for higher education towards 2030 - Part 2: Transitions: Key topics, key voices. , (2022).
- Cunningham, M., Gibson, R. Rethinking curriculum: A pandemic opportunity for re-engagement with the arts. Curric Perspect. 43 (1), 3-12 (2023).
- Gladwin, D., Ellis, N. Storying systems change: Learning and living with complexity. Syst Pract Action Res. 38 (3), 23(2025).
- Laghi, S. Shakespeare's sonnets in the ELT classroom: The paradox of early modern beauty and twenty-first century social media. Shakespeare's Global Sonnets: Translation, Appropriation, Performance. , Springer. 353-368 (2023).
- Ceallaigh, T. Ó, O'Brien, E., Tømte, C., Kulaksız, T., Connolly, C. Rethinking teacher education in an AI world: Perceptions, readiness and institutional support for generative AI integration. Eur J Teach Educ. , 1-20 (2025).
- Strasser, T. ELT in the digital age. AAA: Arbeiten aus Anglistik und Amerikanistik. 48 (1), 121-136 (2023).
- Simpson, A. V., Berti, M., Cunha, M. P. E., Clegg, S. Art, culture and paradox pedagogy in management learning: the case of Portuguese fado. Manag Learn. 52 (5), 630-651 (2021).
- Frenneaux, R. The rise of independent artists and the paradox of democratisation in the digital age: challenges faced by music artists in the new music industry. DIY Altern Cult Soc. 1 (2), 125-137 (2023).
- Rapanta, C., Botturi, L., Goodyear, P., Guàrdia, L., Koole, M. Balancing technology, pedagogy and the new normal: Post-pandemic challenges for higher education. Postdigital Sci Educ. 3 (3), 715-742 (2021).
- Pavlou, V., Castro-Varela, A. E-learning canvases: Navigating the confluence of online arts education and sustainable pedagogies in teacher education. Sustainability. 16 (5), 1741(2024).
- Hutson, J. Rethinking plagiarism in the era of generative AI. J Intell Commun. 4 (1), 20-31 (2024).
- Buchanan, R. A., et al. Philosophy of education in a new key: Exploring new ways of teaching and doing ethics in education in the 21st century. Educ Philos Theory. 54 (8), 1178-1197 (2022).
- Drouhot, L. G. Assimilation theories in the 21st century: Appraising accomplishments and future challenges. Int Migr Rev. 58 (4), 1974-2011 (2024).
- Sweeny, R. W. Digital making, digital breaking: technological dysfunction and a postdigital art education. Global Media Arts Education: Mapping Global Perspectives of Media Arts in Education. , 117-130 (2022).
- Xiao, J. Will artificial intelligence enable open universities to regain their past glory in the 21st century. Open Praxis. 16 (1), 11-23 (2024).
- Doğan, E., Jelinčić, D. A. Changing patterns of mobility and accessibility to culture and leisure: paradox of inequalities. Cities. 132, 104093(2023).
- Hanemann, U., Robinson, C. Rethinking literacy from a lifelong learning perspective in the context of the Sustainable Development Goals and the International Conference on Adult Education. Int Rev Educ. 68 (2), 233-258 (2022).
- Khoso, A. K., Honggang, W., Darazi, M. A. Trust and attitude towards AI as pathways to creativity: a TAM model study of EFL students' digital literacy and AI acceptance. Humanit Soc Sci Commun. 13 (1), 1-19 (2025).
- Czerniawski, G. Teacher educators in the twenty-first century: Identity, knowledge and research. , Routledge. ISBN 978191209653 (2025).
- Carella, G., Colombo, F. Teaching design and actively applying it through project-based learning format: a practical case study of a collaboration between a university course and a company. Inted Proc. , 2391-2398 (2024).
- Rudolph, J., bin Mohamed Ismail, M. F., Popenici, S. Higher education's generative artificial intelligence paradox: the meaning of chatbot mania. J Univ Teach Learn Pract. 21 (6), 14-48 (2024).
- Greene, M. Art and imagination: Reclaiming the sense of possibility. Phi Delta Kappan. 76 (5), 378-382 (1995).
- Tour, E., Barnes, M. Rethinking digital multimodal composing by embracing linguistic and cultural diversity in the classroom. Multilingualism as Opportunity: An Integrated Perspective on English and Languages Education in Australia. , 56(2025).
- Perales-Fernández-de-Gamboa, A., Orcasitas-Vicandi, M. Language teaching in the 21st century: Incorporating culturally sustaining pedagogies for social and cognitive justice in education. Appl Linguist Rev. 16 (3), 1403-1427 (2025).
- Ellyatt, W. Eco-systemic flourishing: Expanding the meta-framework for 21st-century education. Challenges. 16 (2), 21(2025).
- Ydesen, C., Milner, A. L., Aderet-German, T., Caride, E. G., Ruan, Y. Assessment and inclusive education in the twenty-first century: Transversal connections in an interdisciplinary field. Educational assessment and inclusive education: paradoxes, perspectives and potentialities. , 317-340 (2023).
- Chirita, A. Redefining borders in contemporary Chinese theater: Paper Tiger Theater Studio performing Kafka's "The Great Wall". Mod Chin Lit Cult. 34 (1), 66-96 (2022).
- Kolesnikova, D. A. From loom to code: Rethinking interfaces through cyberfeminist practices. Galactica Media J Media Stud. 7 (2), 253-274 (2025).
- Kristjánsson, K., Harrison, T., Peterson, A. Reconsidering the 'ten myths' about character education. Br J Educ Stud. 73 (1), 49-72 (2025).
- Rusanen, A. M., Vesikukka, T. On the 21st century digital toys: The paradox of data literacy. AI and society. , 283-295 (2023).
- Grey, S., Morris, P. Capturing the spark: PISA, twenty-first century skills and the reconstruction of creativity. Glob Soc Educ. 22 (2), 156-171 (2024).
- Transforming education in the digital age: exploring the dimensions of education 4.0. Vonitsanos, G., Moustaka, I., Doukakis, S., Mylonas, P. 2024 IEEE Global Engineering Education Conference (EDUCON), , 01-10 (2024).
- Compeau, D. R., Higgins, C. A. Computer self-efficacy: Development of a measure and initial test. MIS Q. 19 (2), 189-211 (1995).
- Sweeney, J. C., Soutar, G. N. Consumer perceived value: The development of a multiple item scale. J Retailing. 77 (2), 203-220 (2001).
- Pipere, A., Mārtinsone, K. Shaping an image of science in the 21st century: The perspective of metamodernism. Societies. 13 (12), 254(2023).
- Nasta, L. Navigating the paradoxes of digital transformation in the creative and cultural industries: embracing innovation. , Springer Nat. (2025).
- Çakır, C., Kahveci, N. G. Development of an attitude scale towards art-integrated social studies course. J Hist Cult Art Res. 12 (2), 55-72 (2023).
- Petrick, J. F. Consumer perceived value: An integrated model and empirical examination. J Leisure Res. 34 (2), 119-134 (2002).
- Tatar, N., Yıldız, E., Akpınar, E., Ergin, Ö A study on developing a self-efficacy scale towards science and technology. Eurasian J Educ Res. 36, 51(2009).
- Eerdemutu, L., Dewaele, J. M., Wang, J. Developing a short language classroom engagement scale (LCES) and linking it with needs satisfaction and achievement. System. 120, 103189(2024).
- Yu, A. Y., Tian, S. W., Vogel, D., Kwok, R. C. W. Can learning be virtually boosted? An investigation of online social networking impacts. Comput Educ. 55 (4), 1494-1503 (2010).
- Mehrvarz, M., Heidari, E., Farrokhnia, M., Noroozi, O. The mediating role of digital informal learning in the relationship between students' digital competence and their academic performance. Comput Educ. 167, 104184(2021).
- Development and validation of a digital literacy scale for teenagers. Rodríguez-de-Dios, I., Igartua, J. J., González-Vázquez, A. Proceedings of the Fourth International Conference on Technological Ecosystems for Enhancing Multiculturality, , 1067-1072 (2016).
- Hair, J. F., Risher, J. J., Sarstedt, M., Ringle, C. M. When to use and how to report the results of PLS-SEM. Eur Bus Rev. 31 (1), 2-24 (2019).
- Raghuram, S., Wiesenfeld, B., Garud, R. Technology-enabled work: The role of self-efficacy in determining telecommuter adjustment and structuring behavior. J Vocat Behav. 63 (2), 180-198 (2003).
- Chen, S. C., Lin, C. P. The impact of customer experience and perceived value on sustainable social relationship in blogs: An empirical study. Technol Forecast Soc Change. 96, 40-50 (2015).
- Reddy, P., Sharma, B., Chaudhary, K. Digital literacy: A review of literature. Int J Technoethics. 11 (2), 65-94 (2020).
- Zhuang, Z., El Toukhy, M., Krywulak, J., Singh, C. S. Understanding the role of converging media: shaping migrant narratives and the paradox of co-creation in a digital era. , 1929-9915 (2025).
- Iman, N. The hidden costs of intelligence: Artificial intelligence and machine learning adoption and the paradox of exponential digital growth. Sustain Clim Change. 18 (3), 225-241 (2025).
- Su, Y., Khan, M. T., Ullah, S., Kukreti, M., Sami, A., Dangwal, A. Steering the digital transformation: how paradoxical leadership juggles innovation culture and organizational agility. Hum Syst Manag. , 01672533251372833(2025).
- Kim, O., Lee, J. The experience paradox: problematizing a common digital trace proxy on crowdfunding platforms. J Theor Appl Electron Commer Res. 20 (4), 270(2025).
- Sharma, D., Sharma, S. Exacerbation and combat of cyberattacks: the dual paradox of machine learning. The techno-legal dynamics of cyber crimes in industry 5.0. , 101-119 (2025).
- Al Serhan, T. F. A., Zhang, S. The paradox of digital marketing: sustainable framework for effective strategies and regulatory challenges. Inf Dev. 41 (2), 529-545 (2025).
- Khan, M. T., Ullah, S., Sami, A., Kukreti, M., Shaukat, M. R. Cultivating a paradoxical mindset: enhancing transformative learning through paradoxical leadership. Leadersh Organ Dev J. 46 (2), 334-350 (2025).
- Szkalej, K. The paradox of lawful text and data mining? Some experiences from the research sector and where we (should) go from here. GRUR Int. 74 (4), 307-319 (2025).
- Brohman, K. Navigating the digital frontier: the art of ambidextrous leadership definition of digital leadership. Digital transformation and society. , 209-229 (2025).