This protocol describes deoxyribonucleic acid extraction, metabarcoding library preparation, Oxford Nanopore long-read sequencing, and bioinformatic analysis of bat guano and urine samples to characterize microbial communities and detect potential pathogens, enabling taxonomic profiling of prokaryotic, archaeal, and eukaryotic microorganisms.
مقالة منهجية
Oxford Nanopore Long-Read Sequencing of Bat Guano and Urine for Microbiome Characterization and Pathogen Detection
في هذه المقالة
ملخص
الملخص
Deoxyribonucleic acid (DNA) sequencing has made possible the study of genetic sequences for taxonomic assignment, mutational analyses, and novel organism discovery. Long-read sequencing methods offer advantages over short-read methods because they can sequence entire DNA molecules without requiring fragmentation. This protocol describes a workflow for microbiome characterization and pathogen detection through the extraction, sequencing, and analysis of DNA from bat environmental samples, including guano and urine, using tailored approaches for each sample type. Pre-processing of guano and urine is performed prior to DNA extraction using a spin-column-based method to disrupt sample matrices and lyse microorganisms that may be present. This protocol further describes the preparation of sequencing libraries using either extracted DNA directly or polymerase chain reaction (PCR) products targeting the full-length 16S ribosomal RNA gene for prokaryotic and archaeal taxa and a partial 18S ribosomal RNA gene for eukaryotic taxa. PCR amplification of the full-length 16S ribosomal RNA gene is achieved using universal primers. Magnetic bead-based DNA purification is employed at multiple stages, including following PCR amplification of the 16S or 18S ribosomal RNA genes. Library preparation includes end repair, barcode ligation, pooling of barcoded DNA, and adapter ligation. Libraries are sequenced on a nanopore sequencing platform and analyzed using the EPI2ME bioinformatics workflow. Sequencing runs are performed on MinION flow cells, with run settings adjusted using the MinKNOW sequencing software. Runs are configured for 72 h with basecalling enabled for the raw data collected, generating the sequence-read files that are sorted according to barcode assignment. This workflow enables high-throughput sequencing of multiple samples in a single run, and the resulting sequence data are used for taxonomic classification of prokaryotic, archaeal, and eukaryotic organisms present in each sample, supporting wildlife microbiome characterization, environmental surveillance, and pathogen detection.
المقدمة
Next generation sequencing (NGS) has become an indispensable tool for wildlife disease ecology because of its ability to characterize the diversity of genetic material present in biological and environmental samples. Genetic surveillance of wildlife hosts and their associated microbiomes is increasingly used to assess pathogen diversity, abundance, and distribution1. When pathogen surveillance is required in geographically inaccessible regions, logistical constraints and limited laboratory infrastructure can hinder direct sampling of wildlife. Environmental sampling provides an effective alternative by enabling the collection of material from habitats occupied by target species while minimizing animal handling and disturbance2. Such samples can provide insights into the microbiome composition of wildlife populations, including microorganisms with pathogenic potential. The identification of these organisms is facilitated through the sequencing of evolutionarily conserved genes that contain taxa-specific sequence variation. Metabarcoding approaches typically involve amplification of ribosomal small subunit (SSU) ribonucleic acid (RNA) genes using universal primers, whereas whole-metagenome sequencing and target-enrichment approaches can provide broader insights into the taxonomic composition and functional potential of microbial communities3.
Advances in sequencing technologies have improved the ability to characterize complex microbial communities from environmental samples. Although computational methods can reconstruct genes and genomes from short sequencing reads, long-read sequencing technologies can generate intact or near full-length sequences, reducing challenges associated with sequence assembly and improving taxonomic resolution3,4. Compared with short-read sequencing platforms, long-read approaches can recover full-length marker genes, such as the 16S ribosomal RNA gene, thereby facilitating higher-resolution taxonomic classification. In contrast to culture-based methods, sequencing-based approaches can detect both culturable and unculturable microorganisms directly from environmental samples3. Oxford Nanopore Technologies (ONT) sequencing, a third-generation NGS platform, combines long-read capability with real-time data generation and portable instrumentation. Nanopore sequencing platforms have been successfully applied in environmental microbiology, wildlife surveillance, and field-based molecular studies, including pathogen detection and biodiversity assessments conducted in remote settings4. The portability of devices such as the nanopore sequencer has enabled deployment of molecular workflows outside conventional laboratory environments, supporting rapid analysis in field conditions.
In this article, we describe a protocol for sequencing amplicons or whole-community DNA from bat environmental samples using nanopore sequencing and its native barcoding workflow. The protocol is suitable for microbiome characterization and pathogen surveillance using bat guano and urine samples. Full-length amplification of the bacterial and archaeal 16S ribosomal RNA gene enables detailed taxonomic characterization and phylogenetic analyses, while partial amplification of the 18S ribosomal RNA gene supports the detection of eukaryotic taxa5,6. The workflow incorporates sample pre-processing, DNA extraction, library preparation, multiplexed sequencing, and bioinformatic analysis, providing a reproducible approach for the characterization of microbial communities and the detection of potential pathogens from wildlife-associated environmental samples.
البروتوكول
All work was performed under Institutional Biosafety Committee (IBSC) approval (ASHOKA/IBSC/4/2024/8). No separate animal ethics approval or wildlife collection permit was required because the study used non-invasive environmental samples collected in accordance with applicable institutional and national regulations.
1. Pre-processing of Environmental Samples (Bat Guano and Urine)
- Bat Guano Pre-processing
- Store field-collected bat guano pellets in nucleic acid preserving agent at −80°C until processing (IBSC: ASHOKA/IBSC/4/2024/8).
- Place the tube containing the guano suspension on ice and allow it to thaw completely. Aliquot zirconium/silicon beads (0.5 mm diameter) into sterile 1.5 mL microcentrifuge tubes to the 200 µL graduation mark, corresponding to bead volume only.
- Seal the tube lid with thermoplastic film and vortex for 3 s to homogenize the suspension. Centrifuge the tube at 376 × g for 3 s to collect material from the tube lid.
- Transfer the tube to a biosafety cabinet. Remove the thermoplastic film and open the tube slowly to minimize aerosol formation.
- Mix the suspension 8–10 times using a 1 mL pipette fitted with a wide-bore tip and transfer 400 µL from the suspension of guano pellet in 800 µL nucleic acid preserving agent into the tube containing the pre-aliquoted beads.
- Seal the tube and vortex using a standard vortex mixer fitted with a 1.5 mL tube head at maximum speed for 5 min.
- Centrifuge the tube at 376 × g for 5 min at room temperature (RT; 24°C ± 1°C). Transfer the tube to a biosafety cabinet, remove the thermoplastic film, and remove 200 µL of supernatant for DNA extraction.
- Bat Urine Pre-processing
- Store field-collected bat urine in 800 µL nucleic acid preserving agent at −80°C until processing.
- Set a thermoblock mixer to 100°C and allow it to reach the target temperature. Transfer the urine samples in thermoplastic-film-sealed tubes directly from −80°C storage to the thermoblock and incubate at 100°C with shaking at 1000 rpm. Keeping the tubes sealed prevents evaporation, aerosol formation, and sample leakage.
- Incubate the samples for 10 min and immediately transfer them to a −80°C freezer for 10 min.
- Repeat Step 1.2.3 once to complete a second freeze–thaw cycle.
- Transfer the tubes to the thermoblock and perform a final thaw at 100°C for 10 min with shaking at 1000 rpm. Process the samples immediately after the final thaw.
- Centrifuge the samples at 376 × g for 3 s to collect the liquid at the bottom of the tube.
- Remove 200 µL of sample and use it for DNA extraction.
2. DNA Extraction
- Use 200 µL of nucleic acid preserving agent as an extraction control (EC) and process it in parallel with each extraction batch.
- In a biosafety cabinet, add 20 µL Proteinase K (PK) to each sample and EC tube and vortex briefly to mix. Centrifuge at 376 × g for 3 s to collect the contents at the bottom of the tube.
- Incubate the tubes at 56°C with shaking at 900 rpm for a minimum of 12 h.
- Add 400 µL Buffer AL (lysis buffer) and vortex briefly to mix.
CAUTION: Lysis buffer may be harmful if swallowed or inhaled and may cause skin irritation, serious eye irritation, or allergic skin reactions. Wear appropriate gloves and eye protection during handling. - Centrifuge briefly to collect the contents and incubate at 56°C for 10 min without shaking.
- Add 400 µL of 100% molecular biology grade ethanol and vortex briefly to mix.
CAUTION: Ethanol is highly flammable and may cause eye irritation. Handle away from ignition sources and wear appropriate eye protection. - Transfer up to 600 µL of the sample mixture to a spin column in a collection tube and centrifuge at 6010 × g for 1 min at RT. Discard the flowthrough and place the spin column into a fresh collection tube.
- Repeat Step 2.7 until the entire sample mixture has been processed through the spin column.
- Add 500 µL Buffer AW1 and centrifuge at 6010 × g for 1 min at RT. Discard the flowthrough and transfer the spin column to a fresh collection tube.
- Add 500 µL Buffer AW2 and centrifuge at 18407 × g for 3 min at RT. Discard the flowthrough and transfer the spin column to a fresh collection tube.
- Centrifuge the empty spin column at 18407 × g for 1 min at RT.
- Transfer the spin column into a labeled sterile microcentrifuge tube and add 50 µL prewarmed Buffer AE (elution buffer) for guano samples or 20 µL prewarmed elution buffer for urine samples directly to the center of the membrane.
- Incubate at RT for 15 min and centrifuge at 18407 × g for 1 min. Centrifuge once more at 18407 × g for 1 min.
- Discard the spin column and store the extracted DNA at −20°C.
NOTE: Proceed to Step 3 for targeted metabarcoding or proceed directly to Step 4 if PCR amplification is not required. - Contamination Control and Biosafety
- Process an EC from the beginning of the extraction workflow and carry it through all downstream procedures, including PCR, magnetic-bead purification, library preparation, sequencing, and data analysis.
- Include a PCR negative control (NC) in every PCR setup and perform PCR amplification on the EC samples in parallel.
- Wear full personal protective equipment (PPE), including a laboratory coat, face mask, protective eyewear, hair covering, and double gloves whenever handling bat guano or urine.
- Treat all workspaces used for handling bat-derived samples as potentially biohazardous areas and maintain PPE throughout all manipulations.
- Irradiate the biosafety cabinet with ultraviolet light after each period of continuous use and spray all interior surfaces with 0.1% bleach at the end of each working day.
- Perform all sample handling and processing in a Biosafety Level 2+ (BSL-2+) or higher containment laboratory.
- Use the nucleic acid preserving agent as a pathogen-inactivating reagent during sample preservation.
- Decontaminate all biomedical waste in a dedicated laboratory autoclave before removing the waste from the containment facility.
3. Polymerase Chain Reaction for Metabarcoding (Optional)
- Quantify each extracted DNA sample using fluorometry according to the manufacturer's instructions.
- PCR for Prokaryotic and Archaeal Metabarcoding Using Universal 16S Primers
- Prepare a 50 µL PCR reaction containing 25 µL double-concentrated enzyme master mix, forward primer (5′-AGAGTTTGATCMTGGCTCAG-3′) and reverse primer (5′-TACGGYTACCTTGTTACGACTT-3′) at a final concentration of 0.2 µM each, 2 ng template DNA, and nuclease-free water (NFW) to volume. Mix thoroughly by pipetting and centrifuge briefly.
- Perform thermal cycling with an initial denaturation at 95°C for 1 min, followed by five cycles of 95°C for 20 s, 55°C for 30 s, and 65°C for 2 min; thirty cycles of 95°C for 20 s, 58°C for 30 s, and 65°C for 2 min; and a final extension at 65°C for 5 min.
- PCR for Eukaryotic Metabarcoding Using Universal 18S Primers
- Prepare a 50 µL PCR reaction containing 25 µL enzyme master mix, forward primer (5′-GTACACACCGCCCGTC-3′) and reverse primer (5’-TGATCCTTCTGCAGGTTCACCTAC-3’) at a final concentration of 0.2 µM each, 2 ng template DNA, and NFW to volume. Mix thoroughly by pipetting and centrifuge briefly.
- Perform thermal cycling with an initial denaturation at 94°C for 3 min, followed by 35 cycles of 94°C for 45 s, 57°C for 1 min, and 65°C for 90 s, and a final extension at 65°C for 10 min.
- PCR Quality Control and Replication
- Load the reactions onto a balanced thermal cycler and include a PCR NC containing NFW instead of template DNA.
- After thermal cycling, remove the PCR products and proceed immediately or store them at −20°C until analysis.
- Analyze 5–10 µL of each PCR product on a 0.7% agarose gel and verify the expected amplicon size (~1.5 kb for 16S and ~200 bp for 18S). Although 0.7% agarose is not optimal for resolving small DNA fragments, it was sufficient in this protocol to distinguish the expected ~200 bp 18S amplicons from nonspecific amplification products and primer dimers while also permitting simultaneous visualization of the ~1.5 kb 16S amplicons using a single gel concentration.
- Pre-stain all loaded samples using GelRed nucleic acid stain. Run the 0.7% agarose gel, prepared in 1× Tris-acetate-EDTA (TAE) buffer, at 120 V for 30 min, using a 100 bp DNA ladder for 18S amplicons and a 1 kb DNA ladder for 16S amplicons. Visualize and document the gel using a gel documentation system according to the manufacturer’s instructions.
- If amplification fails, dilute the extracted DNA to a minimum concentration of 0.3 ng/µL and repeat the PCR using 2 ng of diluted DNA as template.
- Use exactly 2 ng of template DNA for each metabarcoding PCR protocol described here.
- Repeat successful PCR amplifications twice to generate three technical replicates per sample.
- Pool the three technical PCR replicates into a single low-DNA-binding microcentrifuge tube within a biosafety cabinet. Pool the complete volume of each replicate without prior DNA quantification or normalization, and perform DNA purification after pooling.
NOTE: Proceed to Step 4 or store the pooled PCR products at −20°C.
4. Magnetic Bead Purification of DNA
- If PCR amplification was not performed, transfer the DNA extract to a low-DNA-binding microcentrifuge tube.
- Add 1.5 volumes of magnetic DNA purification beads to pooled PCR products or 1 volume of beads to DNA extracts to retain DNA fragments ≥100 bp while removing most DNA fragments <100 bp, primers, primer dimers, nucleotides, salts, and other reaction contaminants.
CAUTION: The beads contain sodium azide. Wear appropriate gloves and protective equipment and avoid skin contact, inhalation, ingestion, and eye exposure. - Incubate the bead-DNA mixture on a rotator mixer at 100 rpm for 5 min at RT and centrifuge briefly at 376 × g for 3 s.
- Place the tubes on a magnetic stand in a biosafety cabinet and allow the beads to separate completely from the supernatant, as indicated by the supernatant becoming completely clear.
- Carefully remove the supernatant while keeping the tubes on the magnetic stand.
- Add sufficient 80% molecular biology-grade ethanol (typically 200–1000 µL) to fully immerse the bead pellet. Select the ethanol volume according to the bead pellet size and tube format, ensuring that the pellet is completely submerged. Gently wash the beads by rotating the tube left, right, and back to the center.
CAUTION: Ethanol is highly flammable and may cause eye irritation. - Remove the ethanol wash and repeat the wash once using the same volume of fresh 80% ethanol.
- Remove the second ethanol wash and centrifuge briefly at 376 × g for 3 s. Place the tubes back on the magnetic stand and remove any residual ethanol.
- Air-dry the bead pellet for 30 s. Do not extend the drying time beyond 30 s.
- Add 17 µL nuclease-free water directly onto the beads, mix thoroughly by flicking the tube, centrifuge briefly at 376 × g for 3 s, and incubate at RT for 2 min.
- Place the tubes on the magnetic stand and allow the beads to separate completely from the eluate.
- Transfer the eluate to a fresh low-DNA-binding microcentrifuge tube without disturbing the beads and quantify the DNA using fluorometry.
NOTE: Proceed to Step 5 or store the purified DNA at −20°C.
5. Nanopore Library Preparation
- DNA Repair and End Preparation
- Thaw the magnetic DNA purification beads and DNA Control Sample on ice.
CAUTION: The beads contain sodium azide. Wear appropriate gloves and protective equipment and avoid skin contact, inhalation, ingestion, and eye exposure. - Prepare the DNA repair and end-preparation reagents according to the manufacturer's instructions and place them on ice. Vortex the reaction buffer for 30 s after it reaches RT to dissolve visible precipitates.
- Aliquot up to 1 µg DNA into sterile PCR tubes, strips, or plates. For ECs and NCs, use 1 µL sample and adjust the volume to 12.5 µL with NFW.
- Select one sample for inclusion of the control DNA and add 1 µL control DNA plus 11.5 µL sample DNA. Add 12.5 µL sample DNA directly to all remaining samples. Prepare the control DNA-containing sample according to the manufacturer’s protocol for the library preparation kit.
- Add 1.75 µL reaction buffer and 0.75 µL reaction enzyme to each sample, mix thoroughly by pipetting, and centrifuge briefly. Prepare a master mix when processing multiple reactions.
- Incubate the reactions at 20°C for 5 min followed by 65°C for 5 min. Transfer the reactions to fresh low-DNA-binding microcentrifuge tubes.
- Purify the reactions according to Step 4 using a 1.0× bead ratio and quantify the purified DNA using fluorometry. Proceed to barcode ligation only if at least 200 ng of end-prepared DNA is recovered.
NOTE: Proceed to Step 5.2 or store the end-prepared DNA overnight at 4°C or long-term at −20°C.
- Thaw the magnetic DNA purification beads and DNA Control Sample on ice.
- Native Barcode Ligation
- Use a target input of 216 femtomoles (fmol) per sample for 1.5 kb amplicons. Calculate the mass of double-stranded DNA using Equation 1.
Mass of dsDNA (g) =
Moles of dsDNA (mol)
× [(Length of dsDNA (bp) × 615.94 g mol−1 bp−1) + 36.04 g mol−1]
For a 1.5 kb amplicon, 216 fmol corresponds to approximately 200 ng DNA. - Convert the DNA concentration to the required sample volume by dividing the required DNA amount by the measured DNA concentration. For example, if the DNA concentration is 20 ng/µL, transfer 10 µL to obtain 200 ng DNA. If the DNA concentration is 40 ng/µL, transfer 5 µL. Transfer DNA corresponding to 200 ng into PCR tubes, strips, or plates and adjust the volume to 7.5 µL using nuclease-free water if required. Use 7.5 µL of end-prepared EC and NC samples without adjustment.
- Prepare the barcode ligation master mix according to the manufacturer's instructions and place it on ice.
- Thaw EDTA and native barcodes at RT, vortex or centrifuge as appropriate, and place them on ice.
- Add 2.5 µL of the assigned barcode and 10 µL barcode ligation master mix to each sample. Mix thoroughly, centrifuge briefly, and incubate at 25°C for 20 min.
- Add 2 µL EDTA from a clear-capped vial or 4 µL EDTA from a blue-capped vial and mix thoroughly. Pool all reactions into a single low-DNA-binding microcentrifuge tube.
- Purify the pooled library according to Step 4 using a 0.4× bead ratio. Retain DNA fragments larger than approximately 500 bp, incubate the bead-DNA mixture for 10 min, wash with Short Fragment Buffer (SFB) instead of ethanol, and elute in 35 µL NFW after incubation at 37°C for 10 min with intermittent mixing every 2 min.
NOTE: Proceed to Step 5.3 or store the barcoded DNA overnight at 4°C or long-term at −20°C.
- Use a target input of 216 femtomoles (fmol) per sample for 1.5 kb amplicons. Calculate the mass of double-stranded DNA using Equation 1.
- Native Adapter (Sequencing Adapter) Ligation
- Prepare the adapter ligation reagents according to the manufacturer's instructions and place them on ice. Vortex the ligation buffer after it reaches RT to dissolve visible precipitates.
- Thaw the sequencing adapter and DNA ligase, mix by pipetting, centrifuge briefly, and place on ice.
- Combine 30 µL pooled barcoded DNA, 5 µL sequencing adapter, 10 µL ligation buffer, and 5 µL ligase enzyme in a low-DNA-binding microcentrifuge tube. Mix thoroughly, centrifuge briefly, and incubate at RT for 20 min.
- Thaw the elution buffer (EB), vortex, and centrifuge briefly. Purify the adapter-ligated library according to Step 4 using a 0.4× bead ratio and the modifications described in Step 5.2.7, except elute the final library in 15 µL EB instead of NFW.
- Quantify 1 µL of the final adapter-ligated library using fluorometry.
NOTE: Proceed to Step 6 or store the library overnight at 4°C or long-term at −20°C.
6. Flow Cell Check and Priming for Sequencing
- Remove the flow cell from 4°C storage and allow it to reach RT. Insert the flow cell into the sequencing device and perform a flow-cell check using MinKNOW sequencing software (version 25).
- Proceed with priming only if the number of active pores exceeds the manufacturer’s warranty threshold (800 active pores).
- Thaw the Flow Cell Flush (FCF) and Flow Cell Tether (FCT), mix as appropriate, and place them on ice.
- Prepare a 50 mg/mL bovine serum albumin (BSA) solution using sterile water.
CAUTION: Wear gloves, eye protection, and appropriate laboratory protective equipment when handling BSA. - Prepare the priming mix by combining 1170 µL Flow Cell Flush (FCF), 30 µL Flow Cell Tether (FCT), and 5 µL of 50 mg/mL BSA in a low-DNA-binding microcentrifuge tube and mix thoroughly. The final BSA concentration in the priming mix is 0.2 mg/mL. BSA is included according to the manufacturer’s recommended priming protocol.
- Insert a 1000 µL pipette tip into the priming port and withdraw approximately 30 µL of fluid by slowly rotating the pipette plunger. The pipette may be set to any volume between 100 and 970 µL before aspiration; the exact setting is not critical because only approximately 30 µL of fluid is withdrawn.
- Load 800 µL of priming mix through the priming port and incubate the flow cell for 5 min at RT.
- Open the SpotON port and load an additional 200 µL of priming mix through the priming port.
NOTE: Perform flow-cell priming and loading-library preparation in parallel where possible.
7. Loading Library Preparation and Flow Cell Loading
- Transfer up to 100 fmol for libraries containing ~200 bp fragments or up to 50 fmol for libraries containing ~1.5 kb fragments into a low-DNA-binding microcentrifuge tube and adjust the volume to 12 µL with EB if required.
- Thaw the Sequencing Buffer (SB) and Library Beads (library-loading beads), vortex thoroughly, and centrifuge the sequencing buffer briefly. Add 37.5 µL sequencing buffer and 25.5 µL library-loading beads to the adapter-ligated library to prepare the loading library.
- Load the entire 75 µL loading library into a pipette tip and slowly dispense it onto the SpotON sample port dropwise, allowing the library to enter the nanopore array area. Close the SpotON port and priming port after loading and place the light shield onto the flow cell.
- Configure the sequencing run by selecting the Native Barcoding Kit (SQK-NBD114), setting the run duration to at least 72 h, enabling super-accurate basecalling, selecting POD5 output for raw data and the FASTQ sequence-read file output for basecalled reads, enabling barcode trimming, and setting the minimum q-score threshold to 7.
- Use super-accurate basecalling for all sequencing runs. Super-accurate basecalling is mandatory for this protocol, and no alternative basecalling settings are recommended when computational resources are limited.
- Start the sequencing run and verify that data acquisition is proceeding normally. Monitor pore health, sequencing yield, and median read length (N50) periodically using the sequencing software.
- Continue the sequencing run until the number of active pores decreases to 100, then terminate the sequencing run and save all sequencing data.
8. Data Analysis Using Bioinformatics Workflow
- Export the sequencing output files from the computer connected to the sequencing device. Select the desired output directory during sequencing-run setup and ensure that the generated sequence-read files or BAM alignment files are accessible for downstream analysis.
- Transfer the sequencing data to a local workstation, external drive, or cloud storage location with access to the bioinformatics workflow application.
- Open the bioinformatics workflow and launch the 16S workflow using the cloud-run option. Configure the workflow according to Table 1 and the step-by-step screenshots provided in Supplementary File 1.
- Under Input Options, upload either a merged sequence-read file, a directory containing multiple sequence-read files, or alignment files generated from the sequencing run. When barcode-specific sequence-read files are generated, do not merge files from different barcodes. Upload the directory containing the individual barcode-specific files instead.
- Select minimap2 as the classification method.
- Under Sample Options, enter a sample name that does not contain personally identifiable information.
- Under Reference Options, select S (Species) from the Taxonomic Rank dropdown menu. Select G (Genus) instead when genus-level classification is preferred.
- Under Minimap2 Options, enter taxid 2,2157 for 16S metabarcoding datasets or taxid 2759 for 18S metabarcoding datasets. Taxid 2 corresponds to Bacteria, taxid 2157 corresponds to Archaea, and taxid 2759 corresponds to Eukaryota. Enable Keep BAM Files and Compute Coverage and Sequencing Depth of References.
- Set the minimum percent coverage and percent identity thresholds according to Table 1. Use 95% minimum coverage and 95% minimum identity for full-length 16S sequences. For the partial (~200 bp) 18S amplicons generated using this protocol, use 0% minimum coverage and 95% minimum identity.
- Under Report Options, set the abundance threshold to a minimum of 10 reads and select the number of taxa to display in the taxonomic bar plot, for example, 9 taxa, as shown in Table 1. Thresholds below 10 reads are not recommended in this protocol.
- Under Output Options, enable IGV Visualization and select the option to export unclassified reads.
- Under Advanced Options, enter the read-length limits and read-quality cutoff listed in Table 1. Use 1500–2200 bases for 16S reads, 100–300 bases for 18S reads, and a read-quality cutoff of 8 unless an alternative cutoff is justified.
- Verify that no human sequence data are included in the uploaded dataset and launch the workflow.
- Record the bioinformatics workflow software version, workflow version, reference database version, and minimap2 version used for analysis. The versions reported in Table 1 correspond to those used in this study.
- Evaluate EC and NC outputs together with sample outputs.
- Export and archive the bioinformatics workflow report, classified-read outputs, unclassified-read outputs, and retained alignment files.
| Parameter Category | Setting | 16S Metabarcoding | 18S Metabarcoding |
| Workflow | EPI2ME Workflow | wf-16s v1.3.0 | wf-16s v1.3.0 |
| Classification | Classification method | minimap2 (v2.26-r1175) | minimap2 (v2.26-r1175) |
| Taxonomic filtering | Taxids included | 2,2157 (Bacteria, Archaea) | 2759 (Eukaryota) |
| Taxonomic rank | Classification level | Species (S) | Species (S) |
| Coverage filtering | Minimum percent coverage | 95% | 0% |
| Identity filtering | Minimum percent identity | 95% | 95% |
| Read filtering | Minimum read quality | Q8 | Q8 |
| Read filtering | Minimum read length | 1500 bp | 100 bp |
| Read filtering | Maximum read length | 2200 bp | 300 bp |
| Report generation | Minimum abundance threshold | 10 reads | 10 reads |
| Report generation | Number of taxa displayed in bar plot | 9 (modifiable) | 9 (modifiable) |
| Output generation | Retain BAM files | Enabled | Enabled |
| Output generation | Compute coverage and sequencing depth | Enabled | Enabled |
| Output generation | Export unclassified reads | Enabled | Enabled |
| Output generation | IGV visualization | Enabled | Enabled |
Table 1: Bioinformatics workflow parameters used for taxonomic classification of metabarcoding sequencing data. Analysis settings and software-component versions used for classification of nanopore-derived 16S and 18S metabarcoding reads in the bioinformatics 16S workflow, including taxonomic-rank selection, taxonomy-identifier filters, sequence-quality thresholds, read-length filters, abundance thresholds, and workflow dependencies.
9. Troubleshooting
- Use sufficient starting material during DNA extraction, particularly for urine samples, which often yield low DNA concentrations. Elute DNA in the minimum recommended volume of elution buffer to maximize DNA concentration.
- Use any fluorometrically detectable amount of extracted DNA for PCR and downstream library preparation. No minimum DNA concentration or DNA yield threshold is required for this protocol.
- Use 2 ng of template DNA for 16S and 18S PCR reactions as the default input amount. If amplification fails or produces only faint bands or smearing, increase the input DNA amount to 5 ng or 10 ng.
- If amplification remains unsuccessful, prepare template dilutions of 1:1, 1:5, and 1:10 using nuclease-free water and repeat the PCR using a minimum DNA input of 2 ng.
- If multiple template-DNA dilutions produce successful amplification, select the least diluted sample for downstream analysis.
- Use the touch-up PCR profile described in Step 3 as the default amplification protocol for 16S metabarcoding. Optimize cycling conditions only if amplification remains unsuccessful after implementing the troubleshooting steps described above.
- When PCR optimization is required, first optimize the cycle number, followed by the annealing temperature, and finally the template DNA amount.
- If amplification is weak or absent, repeat PCR using a higher template DNA amount until agarose gel-detectable bands are obtained. If nonspecific bands are observed, increase the annealing temperature by 1°C increments until nonspecific amplification is reduced or eliminated.
- Increase the PCR cycle number and use the touch-up PCR profile described in Step 3 to improve amplification from environmental DNA samples.
- Use a template DNA input of ≥2 ng for all PCR amplifications described in this protocol.
- If no fluorometrically detectable DNA is recovered following DNA extraction, discard the sample and do not proceed with downstream analyses.
النتائج
This protocol is designed to enable high-throughput sequencing and identification of microbial communities in environmental samples, specifically bat feces (guano) and urine. The use of bead beating or freeze–thaw cycling facilitates lysis of cells possessing cell walls. In bat guano samples, the suspension resulting from storage in a liquid nucleic acid preserving agent is often viscous or semi-solid (Figure 1A). The use of sterile 0.5 mm zirconium/silicon beads efficiently disrupts the guano suspension, facilitating lysis of cell wall-containing organisms as well as any tissue material present. The resulting supernatant contains intracellular contents, including nucleic acids. In contrast, urine stored in nucleic acid preserving agent remains a fully liquid suspension (Figure 1B). Since few visibly intact cells are typically present in these samples, a limited number of freeze–thaw cycles can facilitate release of intracellular contents through cell lysis.
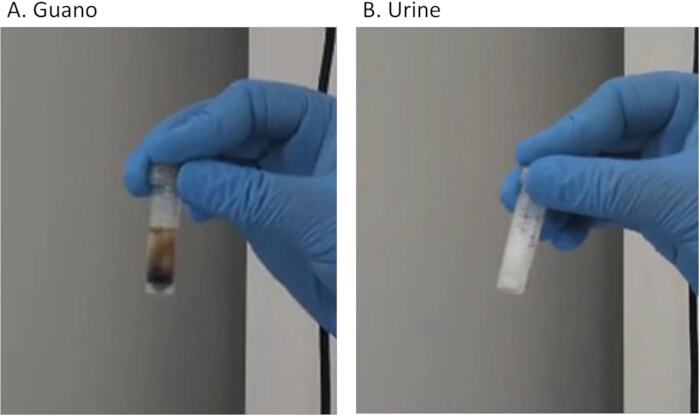
Figure 1. Environmental samples preserved for DNA extraction. (A) Bat guano sample suspended in nucleic acid preservation reagent following removal from −80°C storage and thawing prior to processing. (B) Bat urine sample preserved in nucleic acid preservation reagent following removal from −80°C storage and thawing prior to processing. Please click here to view a larger version of this figure.
DNA extraction using a column-based kit generally yielded more DNA from guano samples than from urine samples due to the higher biomass content of guano. DNA yields obtained from 400 µL guano or 200 µL urine samples are summarized in Table 2. Fluorometric quantification was found to be more useful than ultraviolet-visible spectrophotometry for estimating template volumes required for downstream PCR amplification. Freeze–thaw-based extraction was also evaluated for guano samples but produced lower DNA yields than column-based extraction. In some cases, filtration through a 0.22 µm syringe filter was performed prior to extraction to reduce visible particulate contaminants and minimize column clogging. However, this approach also resulted in lower DNA yields, likely due to DNA loss during filtration.
| Sample Number | PCR Product Concentration (ng/µL) | End-Prepared DNA Concentration (ng/µL) | Femtomoles Taken for Barcoding (fmol) | Pooled Barcoded Library Concentration (ng/µL) | Adapter-Ligated Library Concentration (ng/µL) |
| 1 | 7.5 | 2.11 | 216 femtomoles each (equivalent to ~200 ng) | 3.42 | 3.68 |
| 2 | 6.14 | 3.5 | |||
| 3 | 7.32 | 3.59 | |||
| 4 | 4.1 | 1.47 | |||
| 5 | 5.55 | 3.35 | |||
| 6 | 4.96 | 0.77 | |||
| 7 | 3.38 | 2.85 | |||
| 8 | 7.61 | 4.99 | |||
| 9 | 3.5 | 0.95 | |||
| 10 | 6.77 | 3.47 | |||
| 11 | 4.19 | 2.63 | |||
| 12 | 3.42 | 3.1 | |||
| 13 | 4.98 | 4.6 | |||
| 14 | 9.13 | 5.5 | |||
| 15 | 38.5 | 22.2 | |||
| 16 | 6.85 | 0.77 | |||
| 17 | 13.8 | 10.13 | |||
| 18 | 6.77 | 4.15 | |||
| 19 | 4.38 | 6.77 | |||
| 20 | 6.94 | 1.94 | |||
| 21 | 4.38 | 1.28 | |||
| 22 | 5.54 | 1.36 | |||
| 23 | 4.22 | 3.25 | |||
| 24 | 5.96 | 2.2 | |||
| EC | Below quantification limit | Below quantification limit | 1 µL input | ||
| NC | Below quantification limit | Below quantification limit | 1 µL input |
Table 2: DNA concentrations measured during library preparation for representative 16S metabarcoding samples. PCR-product and end-prepared DNA concentrations were determined by fluorometric quantification. Extraction control (EC) and PCR negative control (NC) samples remained below the quantification limit throughout library preparation. Each sample was taken forward for barcoding using 216 fmol of DNA, corresponding to approximately 200 ng for a 1.5 kb amplicon. The pooled barcoded library concentration and final adapter-ligated library concentration are reported for the combined library preparation workflow. Quantification of the pooled barcoded library is optional.
Amplification of the full-length 16S rRNA gene was optimized using a touch-up PCR strategy. Five initial cycles performed at a lower annealing temperature facilitated primer binding and generation of sufficient template molecules, whereas the subsequent 30 cycles at a higher annealing temperature increased amplification specificity for bacterial and archaeal targets. Initial attempts using 35 cycles at the higher annealing temperature alone did not yield amplification from guano-derived DNA samples used during optimization. DNA extracted from cultured Escherichia coli served as the positive control. For 18S amplification, implementation of a previously reported primer set and thermal-cycling profile successfully amplified the target fragment from nearly all tested samples. Performing PCR reactions in triplicate increased the amount of purified amplicon recovered after magnetic-bead purification, thereby providing sufficient input DNA for downstream DNA repair and end-preparation reactions.
Representative PCR products analyzed by agarose gel electrophoresis are shown in Figure 2. Twenty-three guano samples and one PCR negative control were used to generate the 16S gel (Figure 2A), whereas twenty-four guano samples and one PCR negative control were used to generate the 18S gel (Figure 2B). Full-length 16S amplicons exhibited variation in fragment length among samples, potentially reflecting differences in dominant bacterial and archaeal communities. Similar variation was observed among both guano and urine samples.
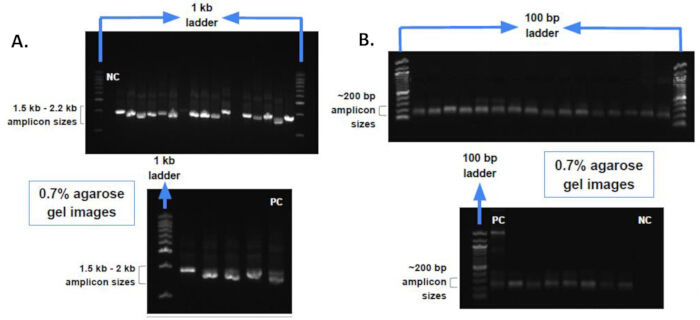
Figure 2. Agarose-gel verification of metabarcoding PCR amplification. (A) Representative agarose gel showing amplification of full-length 16S rRNA gene amplicons generated using universal bacterial and archaeal primers. (B) Representative agarose gel showing amplification of 18S rRNA gene amplicons generated using universal eukaryotic primers. NC, negative control; PC, positive control; bp, base pairs; kb, kilobases. Please click here to view a larger version of this figure.
Because PCR amplification and magnetic-bead purification were used, the quantity of purified amplicon obtained from individual reactions varied, which was reflected in fluorometric DNA quantification results (Table 2). It was observed that using the maximum available amount of purified amplicon for DNA repair and end preparation generally resulted in sufficient recovery of end-prepared DNA following magnetic-bead purification.
Sequencing-run configuration through the sequencing software interface determines several output characteristics, including read-length ranges, quality-score thresholds, and output-file formats. Sequencing yield increased progressively throughout the run until the available nanopores approached exhaustion. Under the conditions used here, a typical 72 h sequencing run generated multiple gigabases of sequence data (Figure 3A).
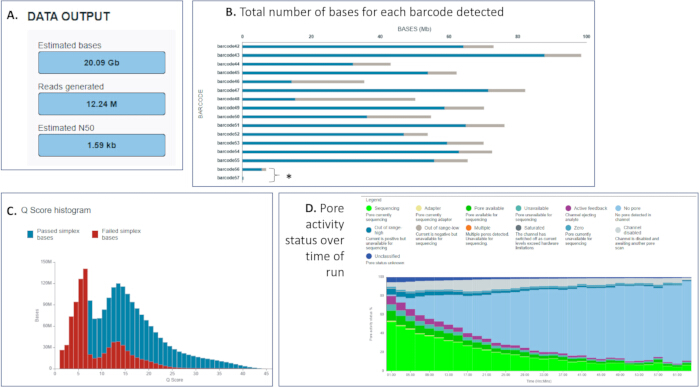
Figure 3. Representative sequencing-run metrics generated by nanopore sequencing software. (A) Summary of sequencing output, including total bases generated, total reads, and N50 read length. (B) Distribution of sequencing yield among individual barcodes. Asterisks indicate extraction-control and negative-control barcodes. (C) Distribution of read quality scores for passed and failed reads. (D) Pore activity and sequencing performance throughout the sequencing run. Gb, gigabases; Mb, megabases; M, million; kb, kilobases; h, hours; min, minutes. Please click here to view a larger version of this figure.
Sequencing run reports provide summary statistics, including pore-health metrics throughout the experiment. Figure 3B shows read outputs obtained from ECs and PCR NCs, which were processed alongside samples throughout library preparation and sequencing to assess potential cross-contamination. The EC and NC samples generated substantially fewer reads than amplicon-containing samples. Any sequencing run in which control samples generate read counts comparable to biological samples should be considered compromised. Representative sequencing-run statistics, barcode-level output distributions, quality-score distributions, and pore-activity metrics are shown in Figure 3.
Taxonomic classification of sequencing reads was performed using the EPI2ME wf-16S workflow. Detailed workflow configuration and representative screenshots of the graphical user interface are provided in Supplementary File 1 (Figures S1–S18), while all analysis parameters are summarized in Table 1. Based on agarose gel electrophoresis results, expected amplicon sizes were used to define minimum and maximum read-length thresholds during analysis. The workflow supports analysis of individual sequence-read files, alignment files, or entire directories containing sequencing outputs. Depending on the selected workflow configuration, users may classify reads against reference databases such as National Center for Biotechnology Information (NCBI)-derived 16S/18S databases, SILVA databases, or locally installed custom databases. Appropriate selection of abundance thresholds, minimum percent coverage, minimum percent identity, and desired taxonomic rank enables generation of detailed abundance profiles for detected taxa.
The partial 18S amplicons generated using this protocol typically provide sufficient information for taxonomic assignment to approximately the genus level but may not contain enough phylogenetically informative sites for robust phylogenetic analyses. Representative outputs generated using a demonstration dataset are shown in Supplementary File 1, including sequencing-summary statistics (Figure S17) and taxonomic-classification results (Figure S18).
SUPPLEMENTARY FILE:
Supplementary File 1. Step-by-step configuration of the bioinformatics 16S workflow for taxonomic classification of nanopore metabarcoding data. This supplementary file provides a graphical walkthrough of the bioinformatics workflow used for taxonomic classification of Nanopore-derived 16S and 18S metabarcoding data. The file illustrates workflow launch, input-file selection, classification settings, reference-database configuration, minimap2 parameter selection, report and output settings, advanced workflow options, workflow execution, and representative output reports. All analysis parameters and thresholds used in this study are summarized in Table 1 of the main manuscript. Please click here to download this file.
المناقشة
Nanopore sequencing has made it possible to sequence virtually any DNA molecule that is appropriately adapter-ligated and introduced into a nanopore array. Among its library-preparation workflows, the Native Barcoding protocol allows libraries to be prepared from DNA fragments of a wide range of sizes, provided that fragments smaller than 100 bp constitute only a minor proportion of the DNA being processed, as these are removed during magnetic bead purification. To facilitate shorter turnaround times, nanopore sequencing has also introduced rapid barcoding approaches that use tagmentation to add barcodes directly to DNA molecules, including kits developed for 16S rRNA gene sequencing7. An example is the tagmentation-based Midnight Protocol for whole-genome sequencing of SARS-CoV-2, which yielded N50 values of approximately 750 bp despite generating individual amplicons of approximately 1.2 kb in length8. In contrast, the workflow described here preserves intact amplicons and can also be applied to genomic or extrachromosomal DNA, thereby providing flexibility for a broader range of metabarcoding and metagenomic applications.
A critical aspect of this protocol is the preparation of environmental samples prior to sequencing. When appropriately preserved and pathogen-inactivated, environmental samples such as bat guano and urine can serve as valuable sources of DNA for both PCR-based metabarcoding and direct library preparation, particularly when clean DNA preparations are obtained using column-based extraction methods. Proper sample storage is essential and may involve the use of nucleic acid preservation reagents, storage at −80°C, or a combination of both, as described here. PCR amplification of environmental DNA frequently requires optimization because such samples often contain inhibitors. In our study, guano-derived DNA presented a particular challenge due to the apparent presence of PCR inhibitors, and dilution of extracted DNA was sometimes required to achieve successful amplification. Similarly, a single PCR reaction may not generate sufficient amplicon for downstream library preparation following magnetic bead purification; therefore, performing PCR in triplicate helps ensure adequate recovery of purified amplicon DNA. Care should also be taken to use the correct reference database for downstream classification, whether targeting 16S or 18S amplicons. Errors in sample naming or barcode assignment can result in incorrect interpretation of bioinformatics workflow outputs. For partial 18S amplicons of approximately 200 bp, the minimum coverage threshold in the bioinformatics workflow was set to 0% because these amplicons represent only a small fraction of the full-length reference sequences. This was the final setting used for partial 18S amplicon analysis in this study. It is also not uncommon for a small proportion of reads to remain unclassified. Such reads may originate from off-target amplification products generated through nonspecific primer binding or from organisms that are poorly represented in existing databases. In some cases, classification may be improved by reducing the minimum percent identity threshold. This approach was not used in the analyses reported in this study and is provided only as a troubleshooting recommendation for exploratory classification of reads that remain unclassified. Another critical step involves the use of the correct magnetic bead wash buffer. Long Fragment Buffer should not be used during post-barcoding or post-adapter-ligation bead purification when targeting amplicons smaller than 3 kb, as these fragments may be lost during washing. Unless enrichment for fragments longer than 3 kb is specifically desired, Short Fragment Buffer should be used instead.
Contamination monitoring is incorporated throughout the workflow, beginning with the inclusion of an EC during DNA extraction. The EC is processed alongside all samples through fluorometric quantification, PCR amplification, agarose gel electrophoresis, library preparation, sequencing, and downstream analysis. Inclusion of a PCR NC provides an additional layer of contamination monitoring, as the NC is also subjected to gel electrophoresis, fluorometric quantification, and library preparation. Ideally, EC and NC intermediates should remain below the detection limit of fluorometric quantification. During sequencing, contamination should be monitored by comparing the number of reads assigned to EC and NC barcodes with those assigned to biological samples. In this protocol, a sequencing run is considered compromised if the EC or NC generates more than 10% of the number of reads observed in the sample with the fewest reads. Because barcode assignments are predetermined, only the intended sample and control barcodes should be considered during data analysis. Additional barcode signals may occasionally be observed if a flow cell has been reused without adequate washing and previously used barcodes remain detectable. When a fresh flow cell is used, barcode signals from non-selected barcodes should remain negligible; otherwise, contamination or barcode carryover should be suspected.
Flow-cell reuse introduces additional considerations that can affect sequencing accuracy and data interpretation. When a flow cell is reused, barcode combinations should not overlap with those used in previous runs performed on the same flow cell. Consequently, barcode selection and knowledge of prior flow-cell usage are important determinants of data quality. Equimolar pooling of amplicons prior to barcoding helps minimize bias among samples and promotes more balanced sequencing output. Cross-barcoding can be minimized through careful pipetting and accurate barcode assignment during library preparation. Ideally, the amount of pooled barcoded DNA recovered after cleanup should approximately reflect the combined input from all end-prepared DNA samples. Although some loss of material is expected during magnetic bead purification, the final adapter-ligated library is often sufficient for multiple sequencing runs, whether performed on fresh or appropriately washed flow cells.
Several limitations and troubleshooting considerations should also be recognized. Multiplex amplification of both 16S and 18S targets within a single PCR may be feasible but would require extensive optimization of primer concentrations and downstream library-preparation workflows to avoid amplification bias. DNA yield from environmental samples can also limit downstream applications, as broad representation of microbial diversity depends on sufficient DNA input for library preparation. We encountered instances of unsuccessful amplification, particularly for the 16S target in guano-derived DNA samples. In such cases, optimization of PCR conditions may be necessary when the affected samples are critical to the study. Users may need to adjust template concentration, employ dilution strategies to reduce inhibition, or optimize amplification conditions according to sample type. These considerations highlight that environmental sample quality remains one of the principal factors influencing overall protocol performance.
The significance of this method lies in its ability to combine environmental sample processing with portable, high-throughput long-read sequencing. Oxford Nanopore Technologies developed portable nanopore sequencing platforms with portability as a primary objective, and the Mk1B device can be operated using a sufficiently powerful laptop, enabling sequencing to be performed in a wide variety of settings9. Subsequent developments, including the Mk1C and Mk1D platforms, further expanded the utility of nanopore sequencing flow cells. Nanopore sequencing has been reported to achieve N50 values of up to 440 kb10, establishing the technology as a leading platform for long-read sequencing. In addition, Q20+ chemistry has substantially improved raw-read accuracy and consensus-sequence quality3,6, contributing to increased adoption of nanopore sequencing across multiple research areas7. Full-length sequence information reduces limitations associated with reconstructing consensus sequences from fragmented reads and facilitates detection of minority variants when adequate sequencing depth is achieved. By combining these capabilities with the processing of environmental samples described in this protocol, nanopore sequencing provides a practical framework for microbial surveillance, ecological studies, and emerging-pathogen detection, including deployment in settings with limited infrastructure where rapid outbreak response or long-term surveillance is required.
الإفصاحات
The authors declare no competing interests.
شكر وتقدير
The authors thank the Trivedi School of Biosciences and the Koita Centre for Digital Health at Ashoka University, Haryana, India, for funding support. The authors would like to thank Ratnesh Karjee, Department of Biology, Trivedi School of Biosciences, Ashoka University, for videography assistance.
المواد
| الاسم | الشركة | رقم فهرسي | التعليقات |
|---|---|---|---|
| Agarose, low electroendosmosis | HiMedia | MB229 | Agarose gel electrophoresis |
| Blunt/TA Ligase Master Mix | New England Biolabs | M0367L | Adapter ligation |
| Bovine serum albumin (BSA) | HiMedia | MB083 | Flow-cell priming |
| Centrifuge | Eppendorf | 5406000313 | Sample centrifugation |
| DNA extraction kit | Qiagen | 69504 | DNA extraction |
| DNA oligonucleotides (16S and 18S primers) | Sigma-Aldrich | Custom synthesized | PCR amplification |
| DNA quantification kit / fluorometer (Qubit) | Invitrogen | Q33240 | DNA quantification |
| Gel nucleic acid stain (GelRed) | Biotium | 41003 | Agarose gel visualization |
| DNA ladder, 100 bp | New England Biolabs | N3231S | 18S amplicon sizing |
| DNA ladder, 1 kb | GeNei | 2652070501730-MBD20 | 16S amplicon sizing |
| DNA LoBind microcentrifuge tubes, 1.5 mL | Eppendorf | 30108051 | DNA handling |
| DNA LoBind microcentrifuge tubes, 2.0 mL | Eppendorf | 30108078 | DNA handling |
| DNA repair/end-preparation module | New England Biolabs | E7546L | DNA repair and end preparation |
| Ethanol, absolute (molecular biology grade) | EMSURE | 1.00983 | DNA extraction and magnetic-bead purification |
| Filtered pipette tips, 10 µL | Tarsons | 529100 | Liquid handling |
| Filtered pipette tips, 20 µL | Tarsons | 529101 | Liquid handling |
| Filtered pipette tips, 100 µL | Tarsons | 529103 | Liquid handling |
| Filtered pipette tips, 200 µL | Tarsons | 529104 | Liquid handling |
| Filtered pipette tips, 1000 µL | Tarsons | 529106 | Liquid handling |
| Flow cell (R10.4.1) | Oxford Nanopore Technologies | FLO-MIN114 | Nanopore sequencing |
| Flow Cell Wash Kit (optional) | Oxford Nanopore Technologies | EXP-WSH004 | Optional; required only if flow cells are reused |
| Gel documentation system | Vilber | E-Box CX5 | Agarose gel imaging |
| Magnetic DNA purification beads | Beckman Coulter | A63881 | DNA purification |
| Magnetic stand | Invitrogen | 12321D | Magnetic-bead separation |
| Metabarcoding analysis workflow (wf-16s) | Oxford Nanopore Technologies | v1.3.0 | Taxonomic classification |
| Minimap2 | Open source | v2.26-r1175 | Sequence alignment and taxonomic classification |
| MinKNOW sequencing software | Oxford Nanopore Technologies | Version 25 | Sequencing control and basecalling |
| Native Barcoding Kit | Oxford Nanopore Technologies | SQK-NBD114.96 | Library preparation |
| Nuclease-free water | New England Biolabs | B1500L | PCR and library preparation |
| PCR Master Mix | New England Biolabs | M0533L | PCR amplification |
| PCR tubes/strips | Tarsons | 610080 | PCR setup |
| Micropipettes | Eppendorf | 3123000942 | Liquid handling |
| Rotator mixer | Invitrogen | 15920D | Magnetic-bead incubation |
| Thermoblock mixer | Eppendorf | 5360000038 | Heat incubation during urine pre-processing |
| Thermocycler | Applied Biosystems | A37835 | PCR amplification |
| Thermomixer | Eppendorf | 5382000015 | Mixing and incubation |
| Thermomixer block | Eppendorf | 5362000035 | Tube heating |
| Thermoplastic sealing film | Tarsons | 380020 | Tube sealing |
| Ultra-low-temperature freezer | PHCbi | MDF-U55V | −80 °C sample storage |
| Vortex mixer | Tarsons | 3020 | Sample mixing |
| Microtube vortex adapter | Tarsons | 3004 | Mechanical disruption (bead beating) |
| Wide-bore filtered pipette tips, 200 µL | Thermo Fisher Scientific | 2069G | Guano handling |
| Wide-bore filtered pipette tips, 1000 µL | Thermo Fisher Scientific | 2079G | Guano handling |
| Zirconia/silica beads, 0.5 mm | BioSpec Products | 11079105z | Mechanical disruption of guano samples |
المراجع
- Vayssier-Taussat M, et al. Next generation sequencing uncovers unexpected bacterial pathogens in ticks in western Europe. PLoS One. 2013;8:e81439.
- Brown VA, Willcox EV, Fagan KE, Bernard RF. Identification of southeastern bat species using noninvasive genetic sampling of individual guano pellets. J Fish Wildl Manag. 2017;8:632-639.
- Liu L, et al. Nanopore long-read-only metagenomics enables complete and high-quality genome reconstruction from mock and complex metagenomes. Microbiome. 2022;10:209.
- Doorenspleet K, et al. Advancing molecular macrobenthos biodiversity monitoring: a comparison between Oxford Nanopore and Illumina-based metabarcoding and metagenomics. PeerJ. 2025;13:e19158.
- Wilson KH, Blitchington RB, Greene RC. Amplification of bacterial 16S ribosomal DNA with polymerase chain reaction. J Clin Microbiol. 1990;28:1942-1946.
- Amaral-Zettler LA, McCliment EA, Ducklow HW, Huse SM. A method for studying protistan diversity using massively parallel sequencing of V9 hypervariable regions of small-subunit ribosomal RNA genes. PLoS One. 2009;4:e6372.
- Matsuo Y, et al. Full-length 16S rRNA gene amplicon analysis of human gut microbiota using MinION nanopore sequencing confers species-level resolution. BMC Microbiol. 2021;21:35.
- Freed NE, Vlková M, Faisal MB, Silander OK. Rapid and inexpensive whole-genome sequencing of SARS-CoV-2 using 1200 bp tiled amplicons and Oxford Nanopore Rapid Barcoding. Biol Methods Protoc. 2020;5:bpaa014.
- Jain M, Olsen HE, Paten B, Akeson M. The Oxford Nanopore MinION: delivery of nanopore sequencing to the genomics community. Genome Biol. 2016;17:239.
- Lu D, et al. Nanopore ultra-long sequencing and adaptive sampling spur plant complete telomere-to-telomere genome assembly. Mol Plant. 2024;17:1773-1786.
إعادة الطباعة والأذونات
تم نشر هذه المقالة
الفيديو قريباً