طورت هذه الدراسة الاسترجاعية نموذجاً استكشافياً لمخاطر التكرار، وقارنت بين المتابعة الموجهة بالمخاطر والمعتمدة على النموذج وبين المتابعة الروتينية بعد إجراء استئصال الغشاء المخاطي تحت المخاطي بالتنظير الداخلي (ESD). وقد ارتبطت المتابعة الموجهة بالمخاطر بانخفاض معدل التكرار خلال 12 شهراً، وبنتائج أفضل من حيث الجوانب النفسية، والإدارة الذاتية، والتغذوية، والرضا، واستخدام الموارد، على الرغم من أن التصميم غير العشوائي وغياب التحقق الخارجي يحدان من التفسير السببي والتنبئي.
مقالة بحثية
بروتوكول تمريضي للمتابعة الموجهة بالمخاطر بعد عملية التشريح تحت المخاطية بالمنظار في حالات سرطان الجهاز الهضمي المبكر
50 مشاهدة
⸱
سبتمبر 11, 2026
في هذه المقالة
ملخص
الملخص
يُستخدم التشريح تحت المخاطي بالمنظار (ESD) على نطاق واسع لعلاج سرطان الجهاز الهضمي المبكر، على الرغم من أن الانتكاس بعد الجراحة لا يزال ذا أهمية سريرية. أجرينا دراسة أترابية استعادية على مرحلتين. شملت مجموعة تطوير النموذج 124 مريضاً عولجوا في الفترة ما بين يناير 2022 ويناير 2023، عانى منهم 22 مريضاً من الانتكاس. تم إدخال سبعة مؤشرات تمريضية ذات صلة بما بعد الجراحة في نموذج انحدار لوجستي متعدد المتغيرات. ونظراً لتسجيل العديد من المؤشرات أثناء المتابعة بعد الجراحة، تم تفسير النموذج كنموذج استكشافي لمخاطر الانتكاس بدلاً من كونه أداة تنبؤية أساسية. بلغت المساحة الظاهرية تحت منحنى خصائص التشغيل للمستقبل 0.922 (95% CI, 0.872-0.972)؛ وعند عتبة احتمالية قدرها 0.1484، بلغت الحساسية 95.45%، والنوعية 84.31%، بينما أعطى التحقق الداخلي بطريقة bootstrap قيمة AUC مصححة من التفاؤل بلغت 0.884. وشملت مجموعة مقارنة استعادية منفصلة 84 مريضاً عولجوا في عام 2024: تلقى 42 منهم متابعة موجهة بالمخاطر بناءً على النموذج، وتلقى 42 مريضاً متابعة روتينية بفواصل زمنية ثابتة. خلال 12 شهراً، حدث الانتكاس لدى 5 من أصل 42 مريضاً (11.90%) و13 من أصل 42 مريضاً (30.95%) على التوالي، وهو ما يتوافق مع فرق في المخاطر قدره -19.05 نقطة مئوية (95% CI, -35.55 to -1.37) وخطر نسبي قدره 0.38 (95% CI, 0.15-0.98). وأظهرت المعادلات التقديرية المعممة تغيرات أكثر إيجابية في الحالة النفسية، والإدارة الذاتية، والمؤشرات الغذائية في المجموعة الموجهة بالمخاطر، في حين لم تكن التفاعلات بين المجموعة والوقت بالنسبة لمؤشرات الامتثال ذات دلالة إحصائية. كما سجلت المجموعة الموجهة بالمخاطر استخداماً أقل للموارد المقاسة ورضا تمريضي أعلى. هذه النتائج هي ارتباطات رصدية؛ حيث إن العدد المحدود للحالات، والتداخل الزمني المحتمل بين المتنبئات والانتكاس، وغياب التحقق الخارجي، والمقارنات غير العشوائية، تحد من التفسير التنبؤي والسببي.
المقدمة
لا يزال سرطان الجهاز الهضمي في مراحله المبكرة يمثل عبئاً صحياً عالمياً كبيراً، حيث يتم تسجيل ما يقرب من 2 مليون حالة جديدة كل عام، يحدث أكثر من 40% منها في الصين1. وقد أصبح التشريح تحت المخاطي بالمنظار (ESD) علاجاً أساسياً لأنه يسمح بالاستئصال الكامل للآفة (en bloc) مع الحفاظ على تشريح ووظائف الجهاز الهضمي، وقد أفيد بأن عدد هذه الإجراءات في الصين يتجاوز 150,000 عملية سنوياً. ومع ذلك، لا يزال يُسجل حدوث انتكاسة في 15-22% من المرضى خلال فترة تتراوح بين 1 إلى 3 سنوات بعد عملية ESD، وقد يؤدي التأخر في اكتشاف المرض المتكرر إلى ظهور آفات متقدمة لدى ما يقرب من 60% من هؤلاء المرضى، مما يؤثر سلباً على النتائج طويلة المدى2. وفي الممارسة الروتينية، تُجرى المراقبة عادةً وفق جدول زمني ثابت (على سبيل المثال: "6 أشهر-سنة واحدة-سنتان")3، ويتم تحديد هذا الجدول بشكل كبير بناءً على التصنيف المرضي، مع اهتمام محدود بالعوامل التي يمكن التدخل فيها تمريضياً مثل الالتزام بالنظام الغذائي والحالة النفسية. وتشير البيانات إلى أن هذا النموذج التقليدي يؤدي إلى معدل عدم اكتشاف يصل إلى 30% بين الفئات الأكثر عرضة للخطر، وأكثر من 40% من المتابعات غير الضرورية بين المجموعات منخفضة المخاطر، مما يؤدي ليس فقط إلى هدر الموارد الطبية (حيث تتجاوز تكاليف الفحوصات السنوية الزائدة للفرد 2,000 RMB) ولكن أيضاً إلى زيادة الأعباء النفسية والاقتصادية على المرضى4,5.
ركزت الدراسات السابقة حول التكرار بعد ESD بشكل أساسي على خصائص الآفة، وعلم الأمراض النسيجي، والعوامل المرتبطة بالاستئصال، وحالة Helicobacter pylori، والتغيرات في الغشاء المخاطي الخلفي، وعوامل نمط حياة مختارة، وقد تم الإبلاغ عن عدة نماذج مخاطر خاصة بمواقع محددة6,7,8,9. ومع ذلك، نادراً ما تم ربط السلوكيات ذات الصلة بالتمريض ومؤشرات عملية الرعاية مباشرة بكثافة المتابعة10. وفي الدراسة الحالية، اعتُبر السلوك الغذائي، والالتزام بتناول الأدوية، والضيق النفسي، والتدخين، والتحكم في نسبة السكر في الدم، والحضور للمتابعة أهدافاً يمكن تعديلها أو مراقبتها، بينما عومل التوثيق غير المكتمل لنضح الجروح كعلامة على عملية الرعاية وليس كمحدد سببي مفترض للتكرار. ونظراً لأن آليات التكرار ومتطلبات المراقبة تختلف بين آفات المريء والمعدة والقولون والمستقيم، فقد اعتبر التحليل المجمع استكشافياً.
استخدمت هذه الدراسة مجموعتين استرجاعيتين لأغراض متميزة: استخدمت المجموعة الأولى لتطوير وتقييم داخلي لنموذج استكشافي لمخاطر الانتكاس، بينما استخدمت مجموعة لاحقة لمقارنة النتائج استرجاعياً بين المرضى الذين تلقوا متابعة موجهة بالمخاطر بناءً على النموذج وأولئك الذين تلقوا متابعة روتينية بفواصل زمنية ثابتة. هدفت الدراسة إلى بحث ما إذا كان من الممكن ربط المؤشرات التالية للجراحة ذات الصلة بالتمريض بمسار متابعة عملي، بدلاً من إثبات أداء تنبؤي تم التحقق منه خارجياً أو تأثير سببي نهائي للتدخل.
البروتوكول
تمت الموافقة على المراجعة الاسترجاعية لكلتا المجموعتين من قبل مستشفى Taikang Tongji (Wuhan) (رقم الموافقة 128/06/2025). وقد تم إخفاء هوية جميع البيانات قبل التحليل، كما تم التنازل عن الموافقة المستنيرة. لم يكن تسجيل التجارب السريرية مطلوباً لأن كلتا المجموعتين كانتا استرجاعيتين، وجميع التعرضات واستراتيجيات المتابعة حدثت كجزء من الرعاية السريرية الروتينية قبل استخراج البيانات، ولم يتم إجراء أي تسجيل استباقي أو تخصيص للتدخلات بتوجيه بحثي.
تصميم الدراسة
اعتمدت هذه الدراسة تصميماً لدراسة أتراب استرجاعية على مرحلتين. استُخدمت مجموعة الأتراب التي عولجت في الفترة ما بين يناير 2022 ويناير 2023 لتطوير النموذج والتحقق الداخلي بطريقة البوتستراب (bootstrap)، بينما استُخدمت مجموعة الأتراب التي عولجت في الفترة ما بين يناير وديسمبر 2024 لمقارنة النتائج استرجاعياً بين المرضى الذين تلقوا متابعة موجهة بالمخاطر ومبنية على النموذج، وأولئك الذين تلقوا متابعة روتينية بفواصل زمنية ثابتة. وقد قامت المجموعة الثانية بتقييم مسار الرعاية الموثق ولم تشكل تحققاً خارجياً من أداء النموذج. يوضح الشكل 1 عملية اختيار المرضى لكلتا مجموعتي الأتراب الاسترجاعيتين.
مجتمع الدراسة
دراسة أترابية استعادية
تألفت مجموعة تطوير النموذج من 124 مريضاً مصاباً بسرطان الجهاز الهضمي المبكر خضعوا لعملية ESD في قسم أمراض الجهاز الهضمي في الفترة ما بين يناير 2022 ويناير 2023. وكانت معايير الاشتمال هي: (1) تأكيد إصابة بسرطان المريء أو المعدة أو القولون والمستقيم المبكر مرضياً، وتصنيفه كـ T1a أو T1b دون غزو وعائي؛ (2) إجراء عملية ESD لأول مرة مع استئصال كامل من نوع R0؛ (3) البقاء على قيد الحياة بعد الجراحة لمدة 6 أشهر على الأقل؛ و(4) اكتمال السجلات السريرية والتمريضية، بما في ذلك المعلومات المحددة المتعلقة بالنظام الغذائي والأدوية والحالة النفسية والمتابعة. أما معايير الاستبعاد فكانت: (1) النقائل البعيدة أو وجود أورام خبيثة أولية متعددة؛ (2) العلاج الكيميائي الإشعاعي المساعد قبل الجراحة؛ (3) حدوث مضاعفات خطيرة بعد الجراحة تتطلب إعادة الجراحة خلال 3 أشهر؛ (4) التدهور المعرفي أو المرض النفسي الذي حال دون التعاون في المتابعة؛ و(5) فقدان المتابعة أو عدم اكتمال البيانات. لم يتم إجراء حساب رسمي مسبق لحجم العينة لأن هذه كانت مجموعة تطوير نموذج بأثر رجعي، وتم تضمين جميع السجلات المؤهلة المتاحة خلال الفترة المحددة مسبقاً. ومع ذلك، بالنسبة لنماذج التنبؤ السريرية الثنائية، فإن كفاية حجم العينة تعتمد على عدد أحداث النتائج، وعدد معلمات التنبؤ المرشحة، والأداء المتوقع للنموذج، والحاجة إلى الحد من الإفراط في الملاءمة، وليس على إجمالي حجم العينة وحده. تضمنت المجموعة 22 حالة تكرار عبر سبع معلمات تنبؤ، وهو ما يعادل 3.1 حدثاً لكل معلمة؛ وبالنظر إلى هذه النسبة المنخفضة من الأحداث إلى المعلمات، اعتُبر النموذج عرضة لعدم استقرار المعاملات والإفراط في الملاءمة11,12.
دراسة أترابية مقارنة استرجاعية
تألفت المجموعة المقارنة الاسترجاعية من 84 مريضاً مصاباً بسرطان الجهاز الهضمي المبكر الذين خضعوا لعملية التشريح تحت المخاطي الداخلي (ESD) في الفترة ما بين يناير وديسمبر 2024، وكانت لديهم وثائق كاملة حول استراتيجية المتابعة المتبعة ونتائج الـ 12 شهراً المحددة مسبقاً. تمثلت معايير الاشتمال في: (1) تأكيد إصابة مريئية أو معدية أو قولونية مستقيمة بسرطان مبكر عن طريق الفحص الباثولوجي؛ (2) إجراء عملية ESD خلال فترة الدراسة المحددة مسبقاً؛ (3) وجود توثيق كامل لاستراتيجية المتابعة المتبعة؛ و(4) اكتمال بيانات النتائج بعد 12 شهراً. أما معايير الاستبعاد فكانت: (1) وجود نقائل بعيدة أو أورام خبيثة أولية متعددة؛ (2) تلقي علاج كيميائي إشعاعي مساعد؛ (3) حدوث مضاعفات شديدة بعد الجراحة تطلبت إعادة التدخل الجراحي في غضون 3 أشهر؛ (4) وجود ضعف إدراكي أو مرض نفسي يمنع المشاركة في المتابعة؛ و(5) عدم اكتمال بيانات المتابعة أو النتائج. وبناءً على استراتيجية المتابعة الموثقة في السجلات الطبية وسجلات التمريض، تم تصنيف 42 مريضاً ضمن مجموعة المتابعة الموجهة بالمخاطر والمستندة إلى النموذج، و42 مريضاً ضمن مجموعة المتابعة الروتينية ذات الفواصل الزمنية الثابتة. لم يتم إجراء أي تخصيص عشوائي، أو إخفاء للتخصيص، أو تعيين موجه بحثياً. وقد تم تحديد حجم المجموعة بناءً على عدد السجلات المؤهلة التي تحتوي على بيانات نتائج كاملة لمدة 12 شهراً خلال الفترة المحددة مسبقاً؛ وبناءً على ذلك، لم يكن من الممكن تطبيق حساب حجم العينة الاستشرافي القائم على القوة الإحصائية.
جمع البيانات
استخلاص البيانات الاستعادية
شملت المتغيرات الأساسية العمر، والجنس، ومؤشر كتلة الجسم (BMI)، والنوع المرضي. تم استخراج المؤشرات التالية المتعلقة بالتمريض في مرحلة ما بعد الجراحة باستخدام تعريفات محددة مسبقًا في قاعدة البيانات: تناول الأطعمة عالية الملوحة أو الحارة مرتين على الأقل أسبوعيًا خلال الأشهر الثلاثة الأولى بعد الجراحة؛ عدم اكتمال التوثيق اليومي لنضح الجرح خلال الشهر الأول بعد الجراحة؛ تسجيل درجة ≥11 في مقياس القلق والاكتئاب في المستشفى (HADS)13 عند مرور شهر واحد؛ تفويت جرعتين على الأقل من السوكرافات أسبوعيًا خلال الأشهر الثلاثة الأولى بعد الجراحة؛ تفويت موعدين على الأقل من مواعيد المتابعة خلال الأشهر الستة الأولى؛ تدخين 10 سجائر على الأقل يوميًا لمدة 6 أشهر على الأقل؛ ومتوسط تركيز جلوكوز الدم الصائم ≥7.0 mmol/L خلال الأشهر الثلاثة الأولى بعد الجراحة لدى المرضى المصابين بداء السكري. وكانت النتيجة المرجوة هي حدوث الانتكاسة خلال 12 شهرًا، والتي عُرِّفت بأنها انتكاسة موضعية أو سرطان متزامن تم تأكيده عن طريق الخزعة بالمنظار وعلم الأمراض النسيجي. وبسبب تداخل فترات التقييم لعدة مؤشرات ما بعد الجراحة مع فترة مراقبة الانتكاسة، لم يكن من الممكن التحقق من الأسبقية الزمنية لكل مريض؛ ولذلك تم تحليل هذه المتغيرات كعوامل مرتبطة بحدوث الانتكاسة في مرحلة ما بعد الجراحة، ولم يتم تفسير النموذج الناتج كأداة تنبؤية أساسية.
تطوير النموذج والتحقق الداخلي من صحته
تم إدخال سبعة متغيرات ثنائية ذات صلة بالتمريض بشكل متزامن في نموذج انحدار لوجستي متعدد المتغيرات، وهي: تناول الأطعمة عالية الملوحة أو الحارة، وعدم اكتمال توثيق نضحة الجرح، ودرجة HADS ≥11، والاستخدام غير المنتظم لـ sucralfate خلال الأشهر الثلاثة الأولى بعد الجراحة، وتفويت موعدين على الأقل من مواعيد المتابعة، والتعرض للتدخين، وداء السكري غير المنضبط. وقد اختير الانحدار اللوجستي لأن النتيجة كانت ثنائية ولأن الدراسة سعت للحصول على معادلة احتمالية قابلة للتفسير يمكن تطبيقها في السجلات الروتينية. ولم يتم مقارنة خوارزميات إحصائية أو خوارزميات تعلم آلي بديلة نظراً لتوفر 22 حالة تكرار فقط، مما يجعل تطوير الخوارزميات وضبطها بشكل موثوق أمراً غير مرجح. كما تم تقييم التعدد الخطية باستخدام عوامل تضخم التباين، مع اعتبار القيم >5 غير مقبولة.
تم تقييم تمييز النموذج باستخدام المساحة تحت منحنى خصائص التشغيل للمستقبل، مع حساب فاصل الثقة 95% باستخدام طريقة DeLong. تم اختيار عتبة التشغيل عن طريق تعظيم مؤشر Youden، وبعد ذلك تم حساب الحساسية والخصوصية. وتم تقييم المعايرة باستخدام اختبار Hosmer-Lemeshow لجودة المطابقة، ودرجة Brier، ومخطط معايرة يعتمد على خماسيات المخاطر المتوقعة. كما تم عرض المعايرة الظاهرية والمعايرة المصححة بطريقة bootstrap، مع تقدير التفاؤل من 1,000 عينة إعادة سحب (bootstrap resamples) تم فيها إعادة ملاءمة النموذج الكامل؛ واستخدم إجراء bootstrap نفسه لتقدير التفاؤل في AUC14. كما تم تقديم معاملات الانحدار، ونسب الأرجحية، وفواصل الثقة، والقاطع، ومعادلة الاحتمالية الكاملة للسماح بالحساب المستقل لدرجة النموذج.
بروتوكول التدخل
مجموعة المتابعة الموجهة حسب المخاطر: أشارت السجلات الطبية والتمريضية إلى أن المرضى في هذه المجموعة قد تلقوا متابعة ودعماً تمريضياً مرتبطاً باحتمالية الانتكاس المشتقة من النموذج. وقد صُنفت هذه الاحتمالات باستخدام العتبات التشغيلية المعتمدة في المسار المؤسسي الأصلي: مخاطر منخفضة، <20%؛ ومخاطر متوسطة، من 20% إلى <40%؛ ومخاطر عالية، ≥40%. وعكست هذه العتبات الممارسة السريرية المحلية والمراجعة متعددة التخصصات بدلاً من أن تكون نقاط قطع مشتقة من إرشادات منشورة، أو دراسة تحقق سابقة، أو إجماع دلفي (Delphi) رسمي؛ وقد استُخدمت لتحديد كثافة الرعاية التمريضية، وكانت متميزة عن العتبة المشتقة من منحنى خصائص التشغيل (ROC) والبالغة 0.1484، والتي استُخدمت حصرياً لتلخيص حساسية النموذج ونوعيته.
تم تنفيذ المسار من خلال المتابعة الروتينية من قبل طاقم تمريض أمراض الجهاز الهضمي. وتلقى المرضى ذوو المخاطر المنخفضة مراجعة سنوية واحدة، وكتيباً موحداً يغطي النظام الغذائي، ونمط الحياة اليومي، والأعراض التحذيرية، ورسائل تعزيزية موجزة كل 3 أشهر. أما المرضى ذوو المخاطر المتوسطة فقد تلقوا مراجعة نصف سنوية، تشمل إعادة تقييم تنظيرية واحدة في العيادات الخارجية، بالإضافة إلى اتصالات هاتفية شهرية بقيادة الممرضين، ومراجعة يوميات الطعام، وخطط غذائية فردية، وتعزيز الالتزام بتناول الأدوية. بينما تلقى المرضى ذوو المخاطر العالية برنامج دعم سلوكي معرفي مهيكل يتكون من ثماني جلسات تُقدم مرة واحدة أسبوعياً، وإرشادات للعناية بالجروح قائمة على الفيديو، وتسجيلاً يومياً للنزيف، والألم، وانتفاخ البطن، والأعراض التحذيرية الأخرى، مع تسليم السجلات أسبوعياً إلى فريق التمريض، وعقد اجتماعات عائلية شهرية لتوضيح مسؤوليات الإشراف، وإدارة منسقة لمرض السكري مع استشارة من قسم الغدد الصماء ومراقبة مجدولة لمستوى الجلوكوز.
وصف المسار المؤرشف المكون النفسي على أنه علاج سلوكي معرفي (CBT)، ولكن لم يتم الاحتفاظ بمؤهلات الصحة النفسية للمقدم أو دليل علاجي؛ ولذلك تم الإبلاغ عنه بصورة تحفظية على أنه دعم سلوكي معرفي مهيكل بدلاً من علاج سلوكي معرفي رسمي يقدمه معالج. تم تطوير مسار المتابعة الموجه بالمخاطر بشكل أساسي كمسار مؤسسي محلي، بالاعتماد على إجراءات ما بعد استئصال الغشاء المخاطي تحت المخاطي بالمنظار (ESD) الروتينية في المستشفى والتوصيات المنشورة التي تدعم المراقبة بالمنظار المجدولة بعد إجراء ESD الشافي15,16. وقد وجهت الإرشادات المنشورة إطار المراقبة العام ولكنها لم تحدد عتبات الاحتمالية القائمة على النموذج أو الإجراءات التمريضية المخصصة لكل مستوى من مستويات المخاطر. تم تطوير هذه العناصر محلياً من خلال ربط المؤشرات ذات الصلة بالتمريض بإجراءات الرعاية المقابلة، وراجعها الفريق السريري متعدد التخصصات في المستشفى دون عملية دلفي رسمية. تم توثيق التنفيذ في سجلات التمريض والمتابعة الحالية؛ ولم يتم الاحتفاظ بقائمة مراجعة منفصلة للدقة، أو عتبة دقة محددة مسبقاً، أو تقييم مستقل للدقة (الجدول 1).
مجموعة المتابعة الروتينية: أشارت السجلات إلى أن المرضى في هذه المجموعة قد تلقوا متابعة بفواصل زمنية ثابتة، شملت فحوصات تنظيرية بعد 6 أشهر، وسنة واحدة، وسنتين من الجراحة، بالإضافة إلى التثقيف الصحي الروتيني دون توجيهات فردية قائمة على نموذج محدد.
مؤشرات النتيجة
مؤشرات أداء النموذج
تم تلخيص أداء النموذج باستخدام المساحة تحت المنحنى (AUC) وفاصل الثقة 95% الخاص بها؛ وعتبة الاحتمالية المختارة؛ والحساسية، والخصوصية، ومؤشر يودن (Youden index)؛ وإحصائية هوسمر-ليميشو (Hosmer-Lemeshow) وقيمة P؛ ودرجة برير (Brier score)؛ والتفاؤل المقدر بطريقة البوتستراب (bootstrap)؛ والمساحة تحت المنحنى (AUC) المصححة من التفاؤل.
النتيجة المقارنة في المجموعة المقارنة الاسترجاعية
كانت النتيجة المقارنة الرئيسية هي التكرار الذي تم تأكيده عن طريق الخزعة بالمنظار وعلم الأمراض النسيجي خلال 12 شهراً بعد عملية ESD. تم تسجيل النتائج كأرقام مطلقة ونسب مئوية، بالإضافة إلى فرق المخاطر، والمخاطر النسبية، ونسبة الأرجحية، وفواصل الثقة الخاصة بها بنسبة 95%. لم يتم الاحتفاظ بتواريخ التكرار الدقيقة في مجموعة بيانات تحليل عام 2024؛ وبناءً على ذلك، لم يتم تحليل البقاء على قيد الحياة الخالي من التكرار، ومنحنيات Kaplan-Meier، وانحدار Cox، وتوزيعات وقت التكرار.
مؤشرات جودة الإدارة التمريضية
تم تقييم الامتثال للتمريض عند شهر و6 أشهر و12 شهراً، وشمل ذلك الامتثال الغذائي، والذي عُرِّف بأنه تناول الأطعمة الغنية بالأملاح أو الأطعمة الحارة أقل من مرتين في الأسبوع؛ وتنفيذ العناية بالجروح، والذي عُرِّف بأنه استكمال السجلات اليومية الموحدة للجروح؛ والالتزام بتناول الأدوية، والذي عُرِّف بأنه تفويت أقل من جرعتين في الأسبوع؛ والالتزام بالمتابعة، والذي عُرِّف بأنه عدم تفويت أي من المواعيد المجدولة.
تم تقييم الحالة النفسية في نفس النقاط الزمنية باستخدام النسخة الصينية من مقياس القلق والاكتئاب في المستشفيات (HADS) المكون من 14 بندًا، والذي يشتمل على مقاييس فرعية للقلق والاكتئاب تتكون كل منها من 7 بنود، ويتم تسجيل كل منهما من 0 إلى 21، حيث تشير الدرجات الأعلى إلى عبء أكبر من الأعراض. تم تحليل درجات القلق والاكتئاب والدرجات الكلية كمتغيرات مستمرة. وقد أظهرت النسخة الصينية من مقياس HADS خصائص سيكومترية مرضية، بما في ذلك صدق البناء، والاتساق الداخلي، والصدق المتزامن، وذلك في عينة متعددة المراكز من مرضى السرطان الصينيين13.
تم تقييم الإدارة الذاتية باستخدام مقياس الإدارة الذاتية لأمراض الجهاز الهضمي المسجل في قاعدة بيانات الدراسة الأصلية. وتكون المقياس المعتمد من أربعة مجالات مقيمة وهي: الإدارة الغذائية، ومراقبة الأعراض، وإدارة الأدوية، والتنظيم العاطفي، مع حساب درجة إجمالية تمثل مجموع درجات المجالات الأربعة؛ حيث تشير الدرجات الأعلى إلى إدارة ذاتية أفضل. وقد سجلت وثائق الدراسة الأصلية معامل ألفا كرونباخ (Cronbach’s α) بقيمة 0.85. ونظرًا لعدم الاحتفاظ بالاستجابات على مستوى البنود، ودليل الأداة الأصلي، ومرجع تحقق خارجي مستقل، فقد تم التعامل مع المقياس كأداة دراسة بدلاً من وصفه كمقياس تم التحقق من صحته خارجيًا بشكل كامل.
تم تقييم رضا التمريض بعد 12 شهراً باستخدام مقياس رضا مكون من 100 نقطة تم تطويره في المستشفى وسُجل في قاعدة بيانات الدراسة. صُنفت الدرجات إلى: راضٍ جداً (≥90)، أو راضٍ (80–89)، أو متوسط (60-79)، أو غير راضٍ (<60). ذكرت وثائق الدراسة الأصلية أن قيمة معامل ألفا كرونباخ (Cronbach’s α) بلغت 0.87، ولكن لم يتم الاحتفاظ بالاستجابات على مستوى البنود وسجلات تطوير المقياس الأصلية؛ ولذلك، اعتبرت نتائج الرضا استكشافية.
مؤشرات كفاءة الموارد الطبية
تم تقييم استخدام الموارد على مدى فترة ملاحظة استمرت 12 شهرًا من منظور الموارد الطبية المباشرة للمستشفى. وعُبر عن تكاليف الفحوصات باليوان الصيني الاسمي كما هي مسجلة في قاعدة بيانات المستشفى، وشملت رسوم الفحوصات التنظيرية والتصويرية والمخبرية؛ ولم يتم تطبيق أي تعديل للتضخم أو خصم لأن التحليل غطى فترة متابعة واحدة مدتها 12 شهرًا. كما تم تحديد حالات الاستشفاء الناتجة عن الانتكاس أو المضاعفات التالية للجراحة من السجلات الطبية الإلكترونية. وحُلل وقت المتابعة باستخدام المتغير المركب المحتفظ به في قاعدة البيانات، والذي يجمع بين وقت متابعة مقدم الرعاية الصحية ووقت سفر واستشارة المريض؛ حيث لم يتم تخزين مكونات الوقت الفردية بشكل منفصل. ونظراً لأن متغيرات التكلفة والاستخدام قد تكون ملتوية، فقد تم تقدير متوسط الفروق بين المجموعات وفواصل الثقة 95% باستخدام 10,000 إعادة سحب عينات (bootstrap) غير معلمية.
الطرق الإحصائية
تم تحليل البيانات باستخدام برنامج SPSS ولغة R. وقُيم التوزيع الطبيعي للمتغيرات المستمرة ذات النقطة الزمنية الواحدة باستخدام اختبار Shapiro-Wilk، ولُخِّصت في شكل متوسط ± انحراف معياري أو وسيط (المدى الربيعي)، حسبما كان مناسباً. واستُخدمت اختبارات t للعينات المستقلة أو اختبارات Mann-Whitney U لإجراء المقارنات بين المجموعات. أما المتغيرات الفئوية فقد لُخِّصت في شكل n (%) وقُورنت باستخدام اختبار Pearson’s χ2 أو اختبار Fisher’s exact عندما كانت أعداد الخلايا المتوقعة <5. وقُورنت فئات الرضا المرتبة باستخدام اختبار Mann-Whitney rank-sum، بينما قُورن معدل الرضا العام باستخدام اختبار Fisher’s exact.
تم تحليل النتائج المستمرة المتكررة باستخدام معادلات التقدير المعممة مع توزيع غاوسي (Gaussian distribution)، ورابط الهوية (identity link)، وارتباط تشغيلي قابل للتبادل (exchangeable working correlation)، وأخطاء معيارية قوية؛ وشملت التأثيرات الثابتة المجموعة، والوقت، والتفاعل بين المجموعة والوقت. أما نتائج الامتثال الثنائية المتكررة فقد حُللت باستخدام معادلات التقدير المعممة مع توزيع ثنائي الحدين (binomial distribution) ورابط لوجيت (logit link). وتم تعديل قيم P الخاصة بالتفاعل بين المجموعة والوقت ضمن كل عائلة من النتائج باستخدام إجراء بنجاميني-هوشبرغ لمعدل الاكتشافات الكاذبة (Benjamini-Hochberg false-discovery-rate procedure)، كما تم تسجيل الفروق بين المجموعات أو نسب الأرجحية عند 12 شهراً مع فترات ثقة 95%.
تَمّ استكمال درجة إجمالية واحدة مفقودة للإدارة الذاتية بعد 6 أشهر في مجموعة المتابعة الروتينية لتصبح 72، وذلك لأن درجات المجالات الأربعة كانت جميعها متاحة ومجموعها يساوي هذا الإجمالي تماماً. وأُبلغ عن مقارنات التكرار باستخدام فرق المخاطر، والمخاطر النسبية، ونسبة الأرجحية مع فواصل ثقة 95%. كما قُدِّرت متوسطات الفروق في استخدام الموارد وفواصل الثقة باستخدام 10,000 عينة إعادة سحب غير معلمية بطريقة bootstrap. وتَمّ تقييم النموذج اللوجستي المكون من سبعة متغيرات باستخدام الإجراءات الموضحة أعلاه، بما في ذلك 1,000 عينة إعادة سحب بطريقة bootstrap للتحقق الداخلي. ونظراً لأن المجموعة المقارنة لم تكن عشوائية واحتوت على 18 حالة تكرار فقط، فقد فُسِّرت نتائجها على أنها ارتباطات رصدية غير معدلة بدلاً من كونها تقديرات للتأثير السببي. وكانت جميع الاختبارات ثنائية الجانب، واعتُبرت قيمة p < 0.05 ذات دلالة إحصائية.
النتائج
Univariate associations between nursing-relevant indicators and recurrence
Among the 124 patients in the model-development cohort, 22 experienced recurrence and 102 did not. High-salt or spicy food intake, incomplete wound-exudate documentation, HADS score ≥11, irregular sucralfate use, at least two missed follow-up appointments, smoking exposure, and uncontrolled diabetes were more frequent among patients with recurrence than among those without recurrence. Age, BMI, lesion size ≥2 cm, and poor differentiation did not differ significantly between the groups (Table 2). These univariate findings were interpreted as associations rather than evidence of causal effects (Table 2).
Model development and internal validation
The seven-variable logistic model included high-salt or spicy food intake, incomplete documentation of wound exudate, HADS score ≥11, irregular sucralfate use, at least two missed follow-up appointments, smoking exposure, and uncontrolled diabetes. Let X1-X7 denote these variables in the order listed, coded as 1 when present and 0 when absent. The linear predictor was LP = −6.0438 + 1.3123X1 + 1.6194X2 + 2.2870X3 + 0.9335X4 + 1.3526X5 + 1.1080X6 + 0.6359X7, and the estimated probability was p = exp(LP)/[1 + exp(LP)]. The apparent AUC was 0.922 (95% CI, 0.872–0.972). At the threshold of 0.1484 selected by the maximum Youden index, sensitivity was 95.45%, specificity was 84.31%, and the Youden index was 0.7977. The Hosmer-Lemeshow statistic was χ2 = 4.358 (P = 0.823), and the Brier score was 0.088. Bootstrap internal validation estimated optimism of 0.038, yielding an optimism-corrected AUC of 0.884. These performance estimates should be interpreted with caution because only 22 recurrence events were available for seven predictor parameters (Figure 2 and Tables 3,4).
Baseline characteristics of the retrospective comparative cohort
No statistically significant differences were observed between the two groups in the measured baseline characteristics, including age, sex, BMI, pathological type, lesion size, differentiation, vascular invasion, diabetes, and baseline HADS score (p > 0.05; Table 5). Because the follow-up strategy was not randomly assigned, similarity in measured characteristics does not rule out treatment selection bias or unmeasured confounding.
Twelve-month recurrence in the retrospective comparative cohort
During 12 months, recurrence was documented in 5 of 42 patients (11.90%) in the risk-guided follow-up group and 13 of 42 patients (30.95%) in the routine follow-up group. The risk-guided-minus-routine risk difference was −19.05 percentage points (95% CI, −35.55 to −1.37), the relative risk was 0.38 (95% CI, 0.15-0.98), and the odds ratio was 0.30 (95% CI, 0.10-0.94). Local recurrence occurred in 2 of 42 and 8 of 42 patients, respectively (OR, 0.21; 95% CI, 0.04-1.07; Fisher’s exact p = 0.088), while metachronous cancer occurred in 3 of 42 and 5 of 42 patients, respectively (OR, 0.57; 95% CI, 0.13-2.55; Fisher’s exact p = 0.713). Exact event dates and individual risk-tier assignments were not retained in the 2024 analysis dataset; therefore, no time-to-event or risk-tier-specific recurrence analysis was performed (Table 6).
Nursing compliance during follow-up
Generalized estimating equations did not show significant group-by-time interactions for dietary compliance, wound-care execution, medication adherence, or follow-up adherence; the false-discovery-rate-adjusted P value was 0.328 for each interaction. At 12 months, the risk-guided group nevertheless had higher odds of dietary compliance (OR, 5.55; 95% CI, 1.82–16.94), wound-care execution (OR, 7.22; 95% CI, 1.90-27.40), medication adherence (OR, 4.11; 95% CI, 1.33-12.69), and follow-up adherence (OR, 14.55; 95% CI, 1.78-118.76). These estimates describe the 12-month group differences but do not demonstrate significantly different longitudinal trajectories (Table 7).
Inter-group differences in psychological status
Generalized estimating equations showed significant group-by-time interactions for anxiety (χ2 = 20.96, false-discovery-rate-adjusted p < 0.001), depression (χ2 = 24.84, adjusted p <0.001), and total HADS score (χ2 = 40.80, adjusted p < 0.001). At 12 months, the estimated risk-guided-minus-routine differences were −1.60 points for anxiety (95% CI, -2.05 to -1.14), -1.71 points for depression (95% CI, -2.12 to -1.31), and -3.31 points for the total HADS score (95% CI, -3.95 to -2.67; Figure 3).
Inter-group differences in self-management ability
Significant group-by-time interactions were observed for dietary management, symptom monitoring, medication management, emotional regulation, and the total self-management score (all false-discovery-rate-adjusted p < 0.001). At 12 months, the estimated risk-guided-minus-routine differences were 8.62 points for dietary management (95% CI, 7.51–9.73), 10.31 points for symptom monitoring (95% CI, 9.17-11.45), 9.02 points for medication management (95% CI, 7.72–10.32), 9.10 points for emotional regulation (95% CI, 7.92–10.27), and 37.05 points for the total score (95% CI, 34.67–39.43; Figure 4).
Inter-group differences in nutritional status
Generalized estimating equations showed significant group-by-time interactions for BMI (false-discovery-rate-adjusted p < 0.001), serum albumin (adjusted p < 0.001), and hemoglobin (adjusted p = 0.006). At 12 months, the estimated risk-guided-minus-routine differences were 1.59 kg/m2 for BMI (95% CI, 0.50–2.68), 5.43 g/L for serum albumin (95% CI, 3.56–7.30), and 7.31 g/L for hemoglobin (95% CI, 3.56–11.06; Figure 5).
Inter-group differences in medical resource consumption and nursing satisfaction
Mean annual examination cost was RMB 6,330.79 ± 1,186.52 in the risk-guided group and RMB 8,269.29 ± 1,569.26 in the routine group; the bootstrap mean difference was −RMB 1,938.50 (95% CI, -2,533.51 to -1,342.91). Annual hospitalizations averaged 0.76 ± 0.79 and 1.69 ± 1.28, respectively, with a mean difference of -0.93 (95% CI, -1.38 to -0.50). Mean follow-up time was 27.05 ± 5.66 and 39.26 ± 5.96 min, respectively, with a mean difference of -12.21 min (95% CI, -14.67 to -9.83). Satisfaction-category distributions differed between groups (Mann-Whitney U = 1197.0, P = 0.001), and the overall satisfaction rates were 39 of 42 (92.86%) and 30 of 42 (71.43%), respectively (Fisher’s exact P = 0.020; Table 8).
Data Availability:
Raw data supporting the model development and retrospective comparative cohort analyses are provided in Supplementary File 1.
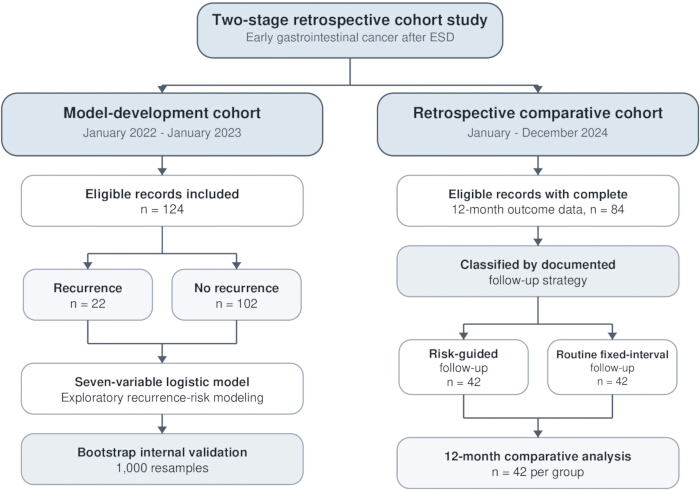
Figure 1: Included patients and analytic structure of the retrospective model-development cohort and the retrospective comparative cohort. Patients in the 2024 cohort were classified according to the follow-up strategy documented in their medical and nursing records; no random allocation was performed. Please click here to view a larger version of this figure.
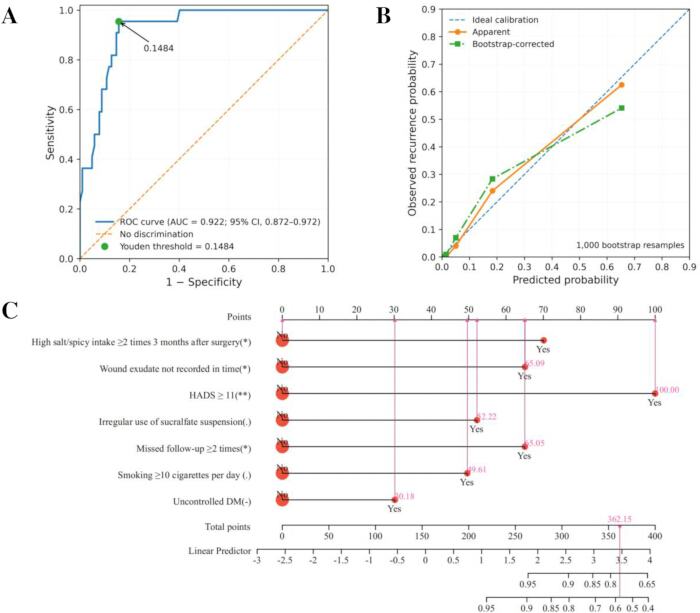
Figure 2: Apparent performance and internal validation of the seven-variable exploratory recurrence-risk model. (A) Receiver operating characteristic curve; the apparent AUC was 0.922 (95% CI, 0.872-0.972), and the Youden threshold of 0.1484, explicitly marked on the curve, yielded a sensitivity of 95.45% and specificity of 84.31%. (B) Apparent and bootstrap-corrected calibration curves based on quintiles of predicted risk; the two curves are separately identified in the plot, and the 45-degree line indicates perfect calibration. The bootstrap-corrected curve was obtained using 1,000 bootstrap resamples with refitting of the full model. (C) Nomogram based on the seven binary nursing-relevant variables. Abbreviations: AUC = area under the curve. Please click here to view a larger version of this figure.

Figure 3: Trends of HADS scores (anxiety/depression dimensions) at different time points after surgery between the two groups. (A) Anxiety dimensions score, (B) Depression dimensions score, (C) total score. Data are presented as mean ± SD; error bars represent SD. vs routine follow-up group * = p < 0.05, vs 1 month after surgery; # = p < 0.05, vs 6 months after surgery; & = p < 0.05. Please click here to view a larger version of this figure.
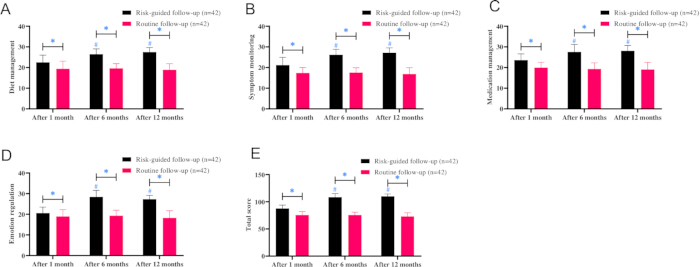
Figure 4: Trends of self-management ability scores in each dimension at different time points after surgery between the two groups. (A) Diet management score, (B) Symptom monitoring score, (C) Medication management score, (D) Emotion regulation score, (E) Total score. Data are presented as mean ± SD; error bars represent SD. vs routine follow-up group * = p < 0.05, vs 1 month after surgery; # = p < 0.05, vs 6 months after surgery; & = p < 0.05. Please click here to view a larger version of this figure.

Figure 5: Trends of nutritional status indicators at different time points after surgery between the two groups. (A) BMI, (B) Serum albumin (ALB), (C) Hb. Data are presented as mean ± SD; error bars represent SD. vs routine follow-up group * = p < 0.05, vs 1 month after surgery; # = p < 0.05, vs 6 months after surgery; & = p < 0.05. Please click here to view a larger version of this figure.
| Risk tier | Model probability | Follow-up schedule | Nursing measures | Provider and coordination | Documentation and fidelity |
| Low risk | <20% | One annual review; reinforcement every 3 months | Standardized booklet covering diet, lifestyle, and recurrence-warning symptoms; quarterly reinforcement messages | Routine gastroenterology nursing team | Recorded in routine follow-up records; no independent fidelity assessment |
| Intermediate risk | 20% to <40% | Semi-annual review, including one outpatient endoscopic reassessment; monthly telephone contact | Review of food diaries, individualized dietary planning, and reinforcement of medication adherence | Gastroenterology nursing team | Telephone and outpatient contacts recorded in nursing records; no prespecified fidelity threshold |
| High risk | ≥40% | Intensive scheduled support in addition to endoscopic surveillance | Eight weekly structured cognitive-behavioral support sessions; video-based wound-care instruction; daily warning-symptom logs with weekly feedback; monthly family sessions; coordinated diabetes management and glucose monitoring | Nursing team, family caregivers, and endocrinology service where diabetes was present | Components recorded in routine nursing records; provider credentials for the psychological component and a separate quantitative fidelity measure were not retained |
Table 1: Development, delivery, and content of the model-informed risk-guided follow-up pathway
| Indicator | Recurrent group | Non-recurrent group | Statistic | p value |
| Age, years | 61.23 ± 6.13 | 61.02 ± 4.99 | t = 0.170 | 0.866 |
| BMI, kg/m² | 23.83 ± 1.98 | 23.09 ± 2.74 | t = 1.207 | 0.23 |
| High-salt/spicy intake, yes/no | 15/7 | 31/71 | χ² = 11.075 | <0.001 |
| Incomplete wound records, yes/no | 14/8 | 28/74 | χ² = 10.579 | 0.001 |
| HADS score ≥11, yes/no | 17/5 | 25/77 | χ² = 22.493 | <0.001 |
| Irregular sucralfate use, yes/no | 15/7 | 35/67 | χ² = 8.626 | 0.003 |
| Missed follow-up ≥2 times, yes/no | 12/10 | 26/76 | χ² = 7.188 | 0.007 |
| Smoking ≥10 cigarettes/day, yes/no | 14/8 | 36/66 | χ² = 6.041 | 0.014 |
| Uncontrolled diabetes, yes/no | 12/10 | 32/70 | χ² = 4.245 | 0.039 |
| Lesion size ≥2 cm, yes/no | 13/9 | 40/62 | χ² = 2.921 | 0.087 |
| Poor differentiation, yes/no | 8/14 | 22/80 | χ² = 2.160 | 0.142 |
Table 2: Univariate associations between nursing-relevant indicators and 12-month recurrence after ESD
| Predictor | B | SE | Wald χ² | P value | OR | 95% CI |
| High-salt or spicy food intake | 1.312 | 0.669 | 3.842 | 0.05 | 3.715 | 1.000–13.797 |
| Incomplete wound-exudate documentation | 1.619 | 0.647 | 6.257 | 0.012 | 5.05 | 1.420–17.963 |
| HADS score ≥11 | 2.287 | 0.674 | 11.506 | 0.001 | 9.845 | 2.626–36.909 |
| Irregular sucralfate use | 0.934 | 0.644 | 2.104 | 0.147 | 2.543 | 0.720–8.979 |
| ≥2 missed follow-up appointments | 1.353 | 0.652 | 4.303 | 0.038 | 3.867 | 1.077–13.882 |
| Smoking ≥10 cigarettes/day | 1.108 | 0.652 | 2.887 | 0.089 | 3.028 | 0.844–10.870 |
| Uncontrolled diabetes | 0.636 | 0.649 | 0.961 | 0.327 | 1.889 | 0.530–6.734 |
| Intercept | −6.044 | 1.136 | 28.323 | <0.001 | 0.002 | — |
Table 3: Multivariable logistic regression model for 12-month recurrence after ESD
| Measure | Estimate |
| Recurrence events/total | 22/124 |
| Predictor parameters | 7 |
| Events per parameter | 3.1 |
| Apparent AUC | 0.922 |
| 95% CI | 0.872–0.972 |
| Probability threshold | 0.1484 |
| Sensitivity | 95.45% |
| Specificity | 84.31% |
| Youden index | 0.7977 |
| Hosmer–Lemeshow χ² | 4.358 |
| Hosmer–Lemeshow P value | 0.823 |
| Brier score | 0.088 |
| Bootstrap resamples | 1,000 |
| Estimated optimism | 0.038 |
| Optimism-corrected AUC | 0.884 |
Table 4: Apparent and bootstrap-corrected performance of the seven-variable exploratory recurrence-risk model
| Indicator | Risk-guided group | Routine group | Statistic | P value |
| Age, years | 60.38 ± 6.56 | 61.07 ± 6.09 | t = −0.500 | 0.618 |
| Sex, male/female | 25/17 | 23/19 | χ² = 0.194 | 0.659 |
| BMI, kg/m² | 23.94 ± 2.36 | 23.10 ± 2.49 | t = 1.591 | 0.115 |
| Pathological type, squamous/adenocarcinoma | 11/31 | 14/28 | χ² = 0.513 | 0.474 |
| Lesion size, cm | 1.78 ± 0.47 | 1.66 ± 0.60 | t = 1.053 | 0.295 |
| Differentiation, well/moderate/poor | 18/19/5 | 16/21/5 | χ² = 0.218 | 0.897 |
| Vascular invasion, yes/no | 7/35 | 8/34 | χ² = 0.081 | 0.776 |
| Diabetes, yes/no | 9/33 | 12/30 | χ² = 0.571 | 0.45 |
| Baseline HADS score | 8.45 ± 2.69 | 8.33 ± 2.14 | t = 0.225 | 0.823 |
Table 5: Baseline characteristics of the retrospective comparative cohort
| Outcome | Risk-guided group | Routine group | Effect estimate | p value |
| Overall recurrence | 5/42 (11.90%) | 13/42 (30.95%) | RD, −19.05 percentage points (95% CI, −35.55 to −1.37); RR, 0.38 (0.15–0.98); OR, 0.30 (0.10–0.94) | 0.033 |
| Local recurrence | 2/42 (4.76%) | 8/42 (19.05%) | OR, 0.21 (0.04–1.07) | 0.088 |
| Metachronous cancer | 3/42 (7.14%) | 5/42 (11.90%) | OR, 0.57 (0.13–2.55) | 0.713 |
Table 6: Twelve-month recurrence in the retrospective comparative cohort
| Indicator | Group-by-time χ² | FDR-adjusted p | 12-month OR | 95% CI |
| Dietary compliance | 2.387 | 0.328 | 5.55 | 1.82–16.94 |
| Wound-care execution | 3.158 | 0.328 | 7.22 | 1.90–27.40 |
| Medication adherence | 2.227 | 0.328 | 4.11 | 1.33–12.69 |
| Follow-up adherence | 3.347 | 0.328 | 14.55 | 1.78–118.76 |
Table 7: Nursing compliance during follow-up analyzed using generalized estimating equations
| Indicator | Risk-guided group | Routine group | Mean difference or test | 95% CI/P value |
| Annual examination cost, RMB | 6330.79 ± 1186.52 | 8269.29 ± 1569.26 | −1938.50 | −2533.51 to −1342.91 |
| Annual hospitalizations | 0.76 ± 0.79 | 1.69 ± 1.28 | −0.93 | −1.38 to −0.50 |
| Follow-up time, min | 27.05 ± 5.66 | 39.26 ± 5.96 | −12.21 | −14.67 to −9.83 |
| Satisfaction categories | 34/5/3/0 | 20/10/8/4 | Mann–Whitney U = 1197.0 | P = 0.001 |
| Overall satisfaction | 39/42 (92.86%) | 30/42 (71.43%) | Fisher’s exact test | P = 0.020 |
Table 8: Resource use and nursing satisfaction in the retrospective comparative cohort
Supplementary File 1: Raw patient-level data supporting the model-development and retrospective comparative cohort analyses.Please click here to download this file.
المناقشة
بحثت هذه الدراسة ما إذا كان يمكن دمج المؤشرات التي تلي الجراحة وذات الصلة بالتمريض في نموذج استكشافي لمخاطر التكرار وربطها بمسار متابعة عملي. في مجموعة التطوير الاسترجاعية، أظهر النموذج المكون من سبعة متغيرات تمييزاً ظاهرياً عالياً، على الرغم من أن العدد المحدود للحالات، والتداخل الزمني بين عدة مؤشرات وحدوث التكرار، وغياب التحقق الخارجي من الصحة، يمنع الوصول إلى استنتاجات مؤكدة بشأن إمكانية نقل القدرة التنبؤية. وأتاحت مجموعة مقارنة استرجاعية منفصلة مقارنة النتائج الموثقة للمرضى الذين تلقوا متابعة موجهة بناءً على المخاطر أو متابعة روتينية على مدار 12 شهراً؛ وبما أن استراتيجية المتابعة لم يتم تحديدها بشكل عشوائي، فإن هذه المقارنات تمثل ارتباطات رصدية وليس تأثيرات تدخل سببية.
قد لا تراعي المراقبة ذات الفواصل الزمنية الثابتة الاختلافات في السلوك بعد الجراحة، أو العبء العاطفي، أو مدى الالتزام، أو جودة المراقبة المستمرة17. وقد هدف المسار الحالي إلى ربط المؤشرات ذات الصلة بالتمريض بكثافة المتابعة وإجراءات الرعاية المحددة مسبقاً. وتمثل السلوكيات الغذائية، واستخدام الأدوية، والضيق العاطفي، والتحكم في مستوى السكر في الدم، والتدخين، وحضور المواعيد مجالات يمكن تعديلها أو مراقبتها، في حين يعكس توثيق نضح الجروح بشكل أساسي عملية الرعاية والمراقبة. وقد يساعد هذا الإطار في تنظيم التمريض بعد الجراحة، بيد أن البيانات الحالية لا تثبت أن كل مؤشر يقع ضمن مسار سببي يؤدي إلى الانتكاس.
كانت نسبة التكرار الملحوظة خلال 12 شهراً أقل بمقدار 19.05 نقطة مئوية في المجموعة التي خضعت للتوجيه بناءً على المخاطر مقارنة بمجموعة المتابعة الروتينية. ويتسق هذا الفرق مع الفائدة المحتملة للدعم الأكثر هيكلية، إلا أن المقارنة الاسترجاعية غير العشوائية لا يمكنها التمييز بين مساهمة نموذج المخاطر ومساهمة الاتصال الإضافي، أو الرعاية الداعمة، أو اختيار المرضى، أو العوامل المربكة المتبقية، أو التفاوت في المراقبة والكشف18. لذا، ينبغي اعتبار نتائج التكرار على أنها مولدة للفرضيات وليست أدلة قاطعة على فعالية التدخل.
تم دمج الدعم النفسي، والاستشارات الغذائية والدوائية، وتسجيل الأعراض المرتبطة بالجروح، ومشاركة الأسرة، وإدارة الأمراض المصاحبة ضمن المسار الموجه بالمخاطر19,20. وتتسق نتائج HADS الطولية ونتائج الإدارة الذاتية مع احتمالية أن يكون التواصل التمريضي المنظم قد دعم الإدارة العاطفية والسلوكية21؛ ومع ذلك، فقد كان المسار متعدد المكونات، ولا يمكن للتصميم الحالي تحديد أي مكون كان مسؤولاً عن الاختلافات الملحوظة. لم يتم الحصول على مؤشرات حيوية للإجهاد، أو مقاييس مناعية، أو تحليلات وسيطة خاصة بمكون معين، أو تقييمات دقة مستقلة، ولذلك يجب تجنب التفسيرات الآلية22. وقد أشارت معلومات مقدمي الخدمة والتنفيذ المتاحة إلى عدم الاحتفاظ بمؤهلات الصحة النفسية للمكون المعرفي السلوكي، وأنه لم يتم استخدام إجراء Delphi رسمي أو إجراء كمي لتقييم الدقة.
كانت نماذج تكرار الإصابة بعد عملية التشريح تحت المخاطي الداخلي (ESD) السابقة محددة بشكل عام بموقع الإصابة وركزت على العوامل السريرية المرضية أو عوامل الغشاء المخاطي. فعلى سبيل المثال، طوّر Xu وآخرون مخططاً بيانياً (nomogram) للتنبؤ بتكرار الإصابة بعد عملية ESD في سرطان المعدة المبكر باستخدام عدوى Helicobacter pylori والعقد الليمفاوية الإيجابية كمتنبئات مستقلة، حيث سجلوا مساحة تحت المنحنى (AUC) بلغت 0.933، على الرغم من عدم إجراء أي تحقق خارجي مستقل2. أما درجة FAMISH، التي طُوّرت للآفات المعدية غير المتزامنة بعد عملية ESD المعدية، فقد شملت العمر، والجنس، والتاريخ العائلي، والميتا بلازيا المعوية في جسم المعدة، والآفات المتزامنة، وعدوى H. pylori المستمرة؛ وكانت قيمة AUC الأولية لها لمدة 3 سنوات 0.704، بينما أسفر التحقق الخارجي اللاحق عن AUC لمدة 5 سنوات بلغت 0.708 مع معايرة مقبولة، مما يدعم استخدامها في تصنيف مخاطر المراقبة9,23. وتعتبر المقارنة الرقمية المباشرة مع قيمة AUC الحالية غير ملائمة لأن هذه النماذج تختلف في المجتمعات المستهدفة، والمتنبئات، وتعريفات النتائج، ومدد المتابعة، والمعايرة، واستراتيجيات التحقق. وحسب علمنا، لا يوجد نموذج لمتابعة تكرار الإصابة بعد عملية ESD قابل للمقارنة بشكل مباشر يركز أساساً على المؤشرات السلوكية وعمليات الرعاية ذات الصلة بالتمريض، أو يربط المخاطر المقدرة مباشرة بمسار متابعة تمريضية؛ لذا تكمن مساهمة الدراسة الحالية في هذا الربط بدلاً من إثبات أداء تنبؤي متفوق.
توفر نتائج استخدام الموارد ومستوى الرضا المقاسة معلومات أولية بشأن الجدوى والمقبولية24. وكان المرضى في المجموعة الموجهة حسب المخاطر لديهم تكاليف فحوصات مسجلة أقل، وعدد أقل من حالات دخول المستشفى، وفترة متابعة أقصر، ومعدل رضا إجمالي أعلى مقارنة بأولئك الذين تلقوا متابعة روتينية (الجدول 8). ولا تشكل هذه النتائج تقييماً اقتصادياً رسمياً لأن التحليل لم يقدر البقاء على قيد الحياة المعدل حسب الجودة، أو فعالية التكلفة المتزايدة، أو جميع التكاليف المباشرة وغير المباشرة ذات الصلة25. علاوة على ذلك، يتطلب مقياس الرضا الذي تم تطويره محلياً مزيداً من التحقق من الصحة26.
هناك عدة قيود لهذه الدراسة. أولاً، كانت كلتا المجموعتين استرجاعيتين وفي مركز واحد، مما أدى إلى مخاطر حدوث تحيز في الاختيار، وتحيز في المعلومات، وتوثيق غير مكتمل أو مصنف بشكل خاطئ، وعوامل مربكة متبقية. ثانياً، توفرت 22 حالة تكرار فقط لسبعة معاملات تنبؤية، مما أدى إلى انخفاض نسبة الأحداث لكل معامل، واحتمالية عدم استقرار المعاملات وحدوث فرط التخصيص (overfitting). ثالثاً، تم قياس العديد من المتغيرات ذات الصلة بالتمريض خلال الفترات التي تلت الجراحة والتي تداخلت مع فترة مراقبة التكرار؛ ولم يكن من الممكن تحديد التسلسل الزمني بدقة لكل مريض، وبالتالي لا ينبغي تفسير النموذج كأداة إنذارية أساسية. رابعاً، قدمت إعادة أخذ العينات بطريقة البوتستراب (bootstrap resampling) تحققاً داخلياً فقط، ولم يتم إجراء أي تحقق خارجي مستقل زمنياً أو جغرافياً أو متعدد المراكز قبل دمج الدرجة في المتابعة الروتينية. خامساً، كانت مقارنة عام 2024 غير عشوائية، وقد يكون التواصل الإضافي، واختيار المرضى، والعوامل المربكة غير المقاسة، والمراقبة أو الكشف التفاضلي قد ساهمت في الاختلافات الملحوظة بين المجموعات. سادساً، لم تكن تواريخ التكرار الدقيقة وتعيينات مستويات المخاطر الفردية متاحة في مجموعة بيانات تحليل عام 2024، مما حال دون إجراء تحليلات الوقت حتى وقوع الحدث والتحليلات الخاصة بكل مستوى. سابعاً، تم تجميع الآفات المريئية والمعدية والقولونية والمستقيمية رغم الاختلافات في آليات التكرار ومتطلبات المراقبة، بينما لم يتم الاحتفاظ بالموقع التشريحي في مجموعة بيانات التحليل لإجراء تحليل طبقي. ثامناً، كان المسار متعدد المكونات، ولم تحتفظ السجلات المؤرشفة ببيانات كاملة حول تدريب مقدمي الخدمة، أو التدوين المنهجي، أو بيانات الدقة المستقلة، لذا تظل المساهمات النسبية وقابلية تكرار العناصر الفردية غير مؤكدة. أخيراً، اقتصرت المتابعة على 12 شهراً، وتتطلب مقاييس الإدارة الذاتية والرضا الخاصة بالدراسة مزيداً من التحقق السيكومتري الخارجي. إن التحقق الخارجي المستقل من النموذج وتقييم مستقبلي متعدد المراكز بصلابة إحصائية كافية لمسار الرعاية مطلوبان قبل التنفيذ الروتيني.
في الختام، أظهر نموذج لوجستي استكشافي مكون من سبعة متغيرات، يعتمد على مؤشرات ما بعد الجراحة ذات الصلة بالتمريض، تمييزاً ظاهرياً عالياً، ولكن تم تطويره من مجموعة صغيرة من مركز واحد، وتضمن تداخلاً زمنياً بين عدة مؤشرات وحدوث الانتكاس، ولم يتم التحقق من صحته خارجياً. وفي دراسة مقارنة منفصلة لمجموعة استرجاعية، ارتبط تلقي متابعة موجهة بالمخاطر ومعلومات النموذج بانخفاض معدل الانتكاس الملاحظ لمدة 12 شهراً، وبنتائج أكثر إيجابية من حيث الجوانب النفسية، والإدارة الذاتية، والتغذية، والرضا، واستخدام الموارد مقارنة بالمتابعة الروتينية. ولا تثبت هذه النتائج الرصدية القابلية التنبؤية للنقل أو التأثير السببي للتدخل. لذا، فإن إعادة تطوير النموذج بعد التحقق من التواريخ، والتحقق الخارجي المستقل، وتقييم مستقبلي متعدد المراكز ذو قوة إحصائية كافية، تعد متطلبات ضرورية قبل التنفيذ السريري الروتيني.
الإفصاحات
لا يعلن المؤلفون عن وجود أي تضارب في المصالح.
المواد
| الاسم | الشركة | رقم فهرسي | التعليقات |
|---|---|---|---|
| محلل كيميائي حيوي آلي | شركة مايندراي للإلكترونيات الطبية الحيوية المحدودة (Mindray Bio-Medical Electronics Co., Ltd.)، شينزين، الصين | BS-240 Pro | قياس مستويات الألبومين والهيموجلوبين في المصل |
| أول أكسيد الكربون2 جهاز نفخ الغاز | شركة Micro-Tech (Nanjing) المحدودة، نانجينغ، الصين | أول أكسيد الكربون2-300 | تُستخدم لتقليل الانزعاج بعد الجراحة أثناء تنظير الداخلي |
| نظام المنظار الإلكتروني | شركة Olympus (China) Co., Ltd.، بكين، الصين | EVIS X1 (CV-1500) | تُستخدم في تنظير التشخيص والمتابعة بعد الجراحة عقب عملية الاستئصال تحت المخاطي بالتنظير (ESD). |
| نظام السجلات الطبية الإلكترونية (EMR) | شركة وينينج لتكنولوجيا الصحة المحدودة (Winning Health Technology Group Co., Ltd.)، نانجينغ، الصين | HIS-V8.0 | استخلاص البيانات السريرية والتمريضية |
| ميزان إلكتروني | شركة شاومي للاتصالات المحدودة، بكين، الصين | XMTZC05HM | قياس وزن الجسم لحساب مؤشر كتلة الجسم |
| جهاز التثبيت بالمشابك بالتنظير الداخلي | شركة Micro-Tech (Nanjing) Co., Ltd.، نانجينغ، الصين | HX-610-135 | إرقاء الدم وإغلاق الجروح بعد تسليح الغشاء المخاطي تحت المخاطي بالمنظار (ESD) |
| سكين التشريح تحت المخاطي بالمنظار | شركة Micro-Tech (Nanjing) المحدودة، نانجينغ، الصين | KD-650Q | سكين ESD قياسي لاستئصال الآفة |
| مقياس الإدارة الذاتية لأمراض الجهاز الهضمي | النسخة الصينية | لم يتم تقديم نص للترجمة. يرجى تزويدنا بالمحتوى الذي ترغب في ترجمته. | تقييم القدرة على الإدارة الذاتية |
| مولد الجراحة الكهربائية عالي التردد | شركة شنغهاي هوتونغ الكهربائية المحدودة، شنغهاي، الصين | GD-350-B | يوفر القطع والتخثير أثناء تسليخ الغشاء المخاطي تحت المخاطي (ESD) |
| مقياس القلق والاكتئاب في المستشفيات (HADS) | النسخة الصينية المعتمدة | نظرًا لعدم توفر نص مصدر للترجمة، يرجى تزويدي بالنص الإنجليزي الذي ترغب في ترجمته إلى اللغة العربية وفقًا للمعايير العلمية والأكاديمية المذكورة. | التقييم النفسي للقلق والاكتئاب |
| مثبط مضخة البروتون (PPI) | شركة جيانغسو هينجروي للأدوية المحدودة، ليانيونغانغ، الصين | H20051628 | كبح الحموضة بعد عملية التشريح تحت المخاطي الداخلي (ESD) |
| برمجيات R الإحصائية | فريق R الأساسي | R 4.3.1 | التحقق الداخلي بطريقة بوتستراب والتحليل الإحصائي |
| برمجيات التحليل الإحصائي | IBM SPSS | SPSS 26.0 | التحليل الإحصائي لبيانات الدراسة |
| معلق سوكرالفات الفموي | مجموعة CSPC Pharmaceutical Group المحدودة، شيجياتشوانغ، الصين | H13023653 | حماية المخاطية والتئام القرحة بعد عملية استئصال الغشاء المخاطي تحت المخاطي بالمنظار (ESD) |
المراجع
- Cao W, et al. Changing profiles of cancer burden worldwide and in China: a secondary analysis of the global cancer statistics 2020. Chin Med J (Engl). 2021;134(7):783-91.
- Xu H, Yang X, Lu Y, Wang S. Prediction of recurrence of early gastric carcinoma after endoscopic submucosal dissection. Afr Health Sci. 2023;23(2):283-9.
- Draganov PV, et al. Endoscopic submucosal dissection in North America: a large prospective multicenter study. Gastroenterology. 2021;160(7):2317-27.e2.
- Rodriguez-Carrasco M, et al. Local recurrence after endoscopic submucosal dissection of gastric neoplastic lesions: special attention should be given also to safety margins. Scand J Gastroenterol. 2024;59(9):1105-11.
- de Moura EGH, Monte Junior ES. Endoscopic submucosal dissection and endoscopic mucosal resection: progress, techniques, and new directions. Arq Gastroenterol. 2021;58(2):129-30.
- Minamide T, et al. Local recurrence risk of esophageal squamous cell carcinoma due to intralesional damage during endoscopic submucosal dissection. J Gastroenterol Hepatol. 2023;38(10):1802-7.
- Nakajo K, et al. Salvage endoscopic resection for cT1N0M0 local recurrence after chemoradiotherapy for esophageal squamous cell carcinoma: endoscopic submucosal dissection versus endoscopic mucosal resection. Jpn J Clin Oncol. 2022;52(9):982-91.
- Li S, et al. Risk factors and a nomogram for predicting local recurrence in adult patients with early gastric cancer after endoscopic submucosal dissection. Dig Liver Dis. 2024;56(11):1921-9.
- Rei A, et al. Metachronous lesions after gastric endoscopic submucosal dissection: first assessment of the FAMISH prediction score. Endoscopy. 2023;55(10):909-17.
- Haasnoot KJC, et al. Low risk of local recurrence after a successful en bloc endoscopic submucosal dissection for noninvasive colorectal lesions with positive horizontal resection margins (R-ESD study). Endoscopy. 2023;55(3):245-51.
- Riley RD, Collins GS. Stability of clinical prediction models developed using statistical or machine learning methods. Biom J. 2023;65(8):e2200302.
- Riley RD, et al. Minimum sample size for developing a multivariable prediction model: PART II - binary and time-to-event outcomes. Stat Med. 2019;38(7):1276-96.
- Li Q, et al. The Chinese version of hospital anxiety and depression scale: psychometric properties in Chinese cancer patients and their family caregivers. Eur J Oncol Nurs. 2016;25:16-23.
- Steyerberg EW, et al. Internal validation of predictive models: efficiency of some procedures for logistic regression analysis. J Clin Epidemiol. 2001;54(8):774-81.
- Pimentel-Nunes P, et al. Endoscopic submucosal dissection for superficial gastrointestinal lesions: European Society of Gastrointestinal Endoscopy (ESGE) Guideline - Update 2022. Endoscopy. 2022;54(6):591-622.
- Japanese Gastric Cancer Association. Japanese Gastric Cancer Treatment Guidelines 2021 (6th edition). Gastric Cancer. 2023;26(1):1-25.
- Gu LS, Lee LY, Huang HY. Post-cancer treatment-related symptom distress and fear of cancer recurrence in colorectal cancer survivors. Hu Li Za Zhi. 2024;71(3):52-63.
- Dahmardeh H, Rezvaniamin M, Salar A. The effectiveness of acceptance and commitment therapy on fear of cancer recurrence in patients with gastrointestinal cancer with a stoma: a randomized controlled trial. Asian Pac J Cancer Prev. 2025;26(12):4569-73.
- Li Q, Liu J, Li L, Luo Y. Effect of prehabilitation on postoperative outcomes in patients with upper gastrointestinal tract cancer: meta-analysis. BJS Open. 2025;9(5):zraf091.
- Yang Y, et al. Deep learning-enabled multiphoton microscopy predicts colorectal cancer recurrence from routine FFPE specimens. NPJ Digit Med. 2025;8(1):689.
- Chou YJ, et al. Serial multiple mediation model of fear of cancer recurrence in patients with colorectal cancer. Health Psychol. 2025;44(10):955-62.
- Li Q, et al. Application effect of preoperative chemoradiotherapy combined with rehabilitation nursing in patients with rectal cancer surgery. Biotechnol Genet Eng Rev. 2024;40(3):2628-42.
- Niu Z, et al. External validation of the FAMISH predicting score for early gastric cancer with endoscopic submucosal dissection. Eur J Gastroenterol Hepatol. 2024;36(1):26-32.
- Lagergren P, et al. Severe reflux and symptoms of anxiety and depression after esophageal cancer surgery. Cancer Nurs. 2022;45(4):280-6.
- Alinia S, et al. Exploring the impact of stage and tumor site on colorectal cancer survival: Bayesian survival modeling. Sci Rep. 2024;14(1):4270.
- Matallana C, et al. Organ/space surgical site infection and long-term outcomes of rectal cancer surgery: retrospective population-based cohort study. BJS Open. 2025;9(3):zraf052.