Using an IgA nephropathy (IgAN) rat model, this protocol evaluates the therapeutic effects of Huangkui capsule through histopathological and molecular analyses. The study demonstrates that Huangkui capsule alleviates renal injury and suppresses inflammatory signaling, providing experimental evidence for its therapeutic mechanism in IgAN.
مقالة بحثية
Huangkui Capsule Effects in IgAN Through TLR4-Mediated Inflammatory Signaling
في هذه المقالة
ملخص
الملخص
Globally, immunoglobulin A (IgA) nephropathy (IgAN) is diagnosed more frequently than any other primary glomerular disorder and contributes substantially to the development of chronic kidney disease and end-stage renal disease. Although the Huangkui capsule, derived from Abelmoschus manihot, has demonstrated renoprotective effects across various kidney diseases, its molecular mechanisms in IgAN remain poorly elucidated. In this study, an experimental IgAN rat model was established and treated with the Huangkui capsule for 8 weeks. A comprehensive evaluation was performed using renal function assessment, histopathological examination, immunofluorescence, immunohistochemistry, enzyme-linked immunosorbent assay (ELISA), and western blot (WB) analysis to investigate renal injury, inflammatory responses, and activation of the Toll-like receptor 4 (TLR4)/myeloid differentiation primary response protein 88 (MyD88)/nuclear factor kappa B (NF-κB) signaling pathway. Huangkui capsule significantly reduced proteinuria, hematuria, serum creatinine, and blood urea nitrogen levels, alleviated glomerular pathological injury and fibrosis, and decreased mesangial IgA and complement component 3 (C3) deposition. In addition, the Huangkui capsule restored the expression of the podocyte-associated proteins nephrin, CD2-associated protein (CD2AP), and Wilms' tumor protein 1 (WT-1), while suppressing the expression of TLR4, MyD88, phosphorylated inhibitor of NF-κB alpha (IκBα), phosphorylated NF-κB, and downstream pro-inflammatory cytokines. These findings suggest that Huangkui capsule ameliorates renal injury and preserves podocyte integrity in experimental IgAN. Its renoprotective effects may be associated with modulation of the TLR4/MyD88/NF-κB signaling pathway. This study provides reproducible experimental evidence supporting further mechanistic investigation and the potential clinical application of the Huangkui capsule for IgAN.
المقدمة
Immunoglobulin A (IgA) nephropathy (IgAN) is one of the most common primary glomerulonephritides worldwide. It is clinically characterized by recurrent hematuria, varying degrees of proteinuria, and progressive decline in glomerular filtration rate (GFR)1. The hallmark pathological feature of IgAN is the deposition of IgA-containing immune complexes within the glomerular mesangium, accompanied by mesangial cell proliferation, extracellular matrix expansion, and inflammatory cell infiltration. Epidemiological studies indicate that IgAN accounts for approximately 20%–40% of primary glomerular diseases, and nearly 30%–40% of affected patients progress to end-stage renal disease (ESRD) within 20 years of diagnosis2. Consequently, IgAN has become a major cause of chronic kidney disease and renal failure, particularly among young and middle-aged adults.
The pathogenesis of IgAN is complex and is currently explained by the widely accepted "four-hit hypothesis," which involves the production of galactose-deficient immunoglobulin A1 (IgA1), the generation of autoantibodies, the formation of circulating immune complexes, and the mesangial deposition of these complexes3. Persistent activation of inflammatory responses is recognized as a major driver of disease progression4,5. Among the inflammatory pathways involved, the Toll-like receptor 4 (TLR4)/myeloid differentiation primary response protein 88 (MyD88)/nuclear factor of kappa light chain enhancer of activated B cells (NF-κB) signaling cascade plays a pivotal role. Activation of TLR4 by immune complexes initiates MyD88-dependent signaling, resulting in phosphorylation of inhibitor of NF-κB alpha (IκBα) and nuclear translocation of NF-κB, which subsequently induces the expression of pro-inflammatory cytokines, including tumor necrosis factor alpha (TNF-α), interleukin 1 beta (IL-1β), and interleukin 6 (IL-6)6. Sustained activation of this pathway aggravates mesangial proliferation, podocyte injury, glomerular filtration barrier dysfunction, and progressive renal fibrosis. Increasing evidence suggests that inhibition of the TLR4/MyD88/NF-κB pathway represents a promising therapeutic strategy for IgAN7.
Current management of IgAN primarily focuses on supportive care, including renin–angiotensin system blockade, blood pressure control, sodium-glucose cotransporter-2 inhibitors, corticosteroids, and immunosuppressive agents. Although these therapies can delay disease progression in some patients, their overall efficacy remains limited, and long-term treatment is frequently associated with significant adverse effects8,9,10. Furthermore, a substantial proportion of patients continue to experience progressive renal function decline despite optimized therapy. Therefore, the development of safer, more effective therapeutic strategies that target multiple pathogenic mechanisms is urgently needed.
Traditional Chinese medicine (TCM) has gained increasing attention in the management of chronic kidney diseases because of its multi-component, multi-target, and holistic therapeutic characteristics. Huangkui capsule, a Chinese patented medicine prepared from the flowers of Abelmoschus manihot, has been widely used to treat chronic glomerular diseases in China11,12. The major bioactive constituents of A. manihot include flavonoids such as hyperoside, isoquercitrin, quercetin, myricetin, quercetin-3′-O-glucoside, and rutin, which possess anti-inflammatory, antioxidant, and renoprotective activities. According to TCM theory, A. manihot clears heat, eliminates dampness, and relieves toxicity, and has long been prescribed for edema and kidney-related disorders. Previous studies have demonstrated that Huangkui capsule improves renal microcirculation, attenuates oxidative stress and inflammation, and reduces proteinuria in several experimental models of kidney disease, particularly diabetic nephropathy13.
Despite these encouraging findings, the therapeutic mechanisms of the Huangkui capsule in IgAN remain insufficiently understood. Most previous experimental studies have focused on diabetic nephropathy or other chronic kidney diseases, whereas relatively few have investigated its efficacy in IgAN. More importantly, previous studies have generally evaluated either inflammatory signaling or podocyte injury independently. To our knowledge, few experimental studies have simultaneously examined the TLR4/MyD88/NF-κB inflammatory signaling pathway alongside multiple podocyte-associated proteins, including nephrin, CD2-associated protein (CD2AP), and Wilms' tumor protein 1 (WT-1), within the same IgAN model. Consequently, whether Huangkui capsule ameliorates IgAN by coordinating the suppression of inflammatory signaling with the preservation of podocyte integrity remains unclear. Addressing this knowledge gap may improve our understanding of the molecular basis underlying the renoprotective effects of Huangkui capsule.
Therefore, the present study established an experimental IgAN rat model to systematically investigate the renoprotective effects of Huangkui capsule. Renal function, histopathological alterations, immune complex deposition, podocyte-associated proteins (nephrin, CD2AP, and WT-1), inflammatory cytokines, and activation of the TLR4/MyD88/NF-κB signaling pathway were comprehensively evaluated. We hypothesized that Huangkui capsule attenuates renal injury by suppressing TLR4/MyD88/NF-κB-mediated inflammatory responses while preserving podocyte integrity. This study aims to provide experimental evidence supporting the molecular mechanisms and potential therapeutic application of Huangkui capsule in IgAN.
البروتوكول
A total of 60 specific pathogen-free (SPF) male Sprague-Dawley (SD) rats, aged 8 weeks, weighing 180–220 g, were obtained from a commercial laboratory-animal supplier. Animals were housed at the Animal Experiment Center of Changchun University of Chinese Medicine (License No.: SYXK (Ji) 2023-0014) under standard SPF conditions (22 ± 2 °C, 50%–60% humidity, 12 h light/dark cycle) with free access to standard chow and water. Rats were acclimated for 1 week before the experiment. Twenty-four-hour urinary protein and urinary red blood cell counts were measured before modeling, and only animals with negative results for both parameters were included in the study. The experimental protocol was approved by the Ethics Committee of Changchun University of Chinese Medicine (Approval No. 202603255).
Establishment of the IgA nephropathy model
Rats received bovine serum albumin (BSA, 100 g/L, 4 mL/kg) by oral gavage every other day and subcutaneous injections of a carbon tetrachloride (CCl₄)/castor oil mixture (1:3, v/v; 0.4 mL/rat) once weekly for 8 weeks. In addition, lipopolysaccharide (LPS, 0.25 g/L, 0.2 mL/rat) was administered via the tail vein during week 6. After completion of the modeling procedure, 12 rats were randomly selected and euthanized to validate the model. Successful IgAN model establishment was confirmed by immunofluorescence detection of prominent granular IgA deposition in the glomerular mesangium, whereas no IgA deposition was observed in the normal control rats.
Drug preparation
Huangkui capsule suspensions were prepared in normal saline at final concentrations of 0.034, 0.068, and 0.136 g/mL for the low-, medium-, and high-dose groups, respectively. The suspensions were thoroughly mixed until homogeneous. Valsartan was dissolved in polyethylene glycol 300 (PEG300) and subsequently diluted with an equal volume of normal saline to a final concentration of 1 mg/mL. The valsartan suspension was thoroughly mixed until homogeneous.
Drug treatments
After successful establishment of the IgAN model, the rats were randomly assigned to six groups (n = 8 per group): normal control (CON), model (MOD), valsartan positive control (POS), Huangkui capsule low-dose (HK-L), medium-dose (HK-M), and high-dose (HK-H) groups. Randomization was performed using a random number table. Outcome assessment, including histopathological evaluation and image quantification, was conducted by investigators blinded to the group allocation. No animals or samples were excluded from the analysis unless death occurred during the experimental period or samples were unsuitable for analysis because of technical failure.
All treatments were administered by oral gavage once daily for 8 weeks at a volume of 10 mL/kg. During gavage, each rat was gently restrained by grasping the loose skin of the neck and back with the left hand while slightly extending the head backward. The tail was stabilized with the ring and the little fingers to keep the animal upright. A syringe fitted with a gavage needle was held in the right hand, and the needle was carefully inserted through one side of the mouth while avoiding the incisors. The needle was advanced gently along the upper palate into the esophagus without excessive force. The suspension was administered slowly over 3–5 s, followed by a 1–2 s pause before the gavage needle was carefully withdrawn.
The CON and MOD groups received normal saline (10 mL∙kg-1∙day-1). The POS group received valsartan suspension (10 mg∙kg-1∙day-1). The HK-L, HK-M, and HK-H groups received Huangkui capsule suspension at doses of 0.34, 0.68, and 1.36 g∙kg-1∙day-1, respectively.
Biochemical analysis
At the end of the 8-week intervention, each rat was housed separately in a metabolic cage for 24 h urine collection. The urine was centrifuged at 6,660 × g for 10 min. Urinary protein in the resulting supernatant was measured with a commercial assay kit following the manufacturer’s protocol, and aliquots of the remaining sample were frozen at −80 °C for subsequent analyses. The rats were then anesthetized by intraperitoneal administration of pentobarbital sodium (30–50 mg/kg), and blood was drawn from the abdominal aorta. After clotting for 30 min at room temperature, the blood was centrifuged at 3,996 × g for 15 min. The separated serum was stored at −80 °C and subsequently assayed using commercial kits for creatinine (Scr), blood urea nitrogen (BUN), albumin (ALB), alanine aminotransferase (ALT), aspartate aminotransferase (AST), triglycerides (TG), total cholesterol (TC), low-density lipoprotein cholesterol (LDL-C), and high-density lipoprotein cholesterol (HDL-C), in accordance with the respective manufacturers’ protocols.
Kidney tissue collection and processing
Following blood collection, both kidneys were rapidly excised, rinsed with pre-cooled phosphate-buffered saline (PBS) to remove residual blood, and carefully decapsulated. Each kidney was sectioned longitudinally and processed according to the subsequent experimental procedures. Tissue samples designated for western blot (WB) analysis were immediately snap-frozen in liquid nitrogen and stored at −80 °C. Samples for histological staining, immunohistochemistry (IHC), and immunofluorescence (IF) analyses were fixed in 4% paraformaldehyde, whereas samples for transmission electron microscopy (TEM) were cut into approximately 1 mm3 pieces and fixed in 2.5% glutaraldehyde.
Histopathological and immunohistochemical analyses
For histological assessment, renal specimens were immersed in 4% paraformaldehyde for 24 h and subsequently processed for paraffin embedding. Sections cut at a thickness of 3–4 µm were stained with hematoxylin and eosin (H&E), periodic acid–Schiff (PAS), or Masson’s trichrome using the protocols supplied with the respective staining kits. H&E staining was used to evaluate glomerular and tubular morphology, PAS staining was used to assess mesangial matrix expansion and glomerular basement membrane alterations, and Masson's trichrome staining was used to evaluate renal fibrosis. Bright-field images were acquired with identical microscope settings at ×200 or ×400 magnification, and quantitative analysis was performed with image-analysis software.
For immunohistochemical detection, heat-mediated antigen retrieval was carried out by heating the sections in citrate buffer (pH 6.0) at 95–100 °C for 15 min. Endogenous peroxidase activity was quenched with 3% H₂O₂ for 10 min, and nonspecific binding sites were blocked with 5% bovine serum albumin (BSA) for 30 min. The sections were exposed overnight at 4 °C to antibodies against collagen I (Col I), alpha-smooth muscle actin (α-SMA), and fibronectin (FN), each diluted 1:100, or against CD2AP, WT-1, and nephrin, each diluted 1:200. A horseradish peroxidase (HRP)-conjugated secondary antibody diluted 1:500 was then applied for 1 h at room temperature. Antibody binding was developed with 3,3′-diaminobenzidine (DAB), followed by hematoxylin counterstaining. All images were captured under fixed exposure settings and evaluated with image-analysis software.
Immunofluorescence and transmission electron microscopy
Paraffin-embedded renal sections measuring 3–4 µm were heated in citrate buffer (pH 6.0) for 15 min to retrieve antigens and subsequently blocked with 5% BSA for 30 min. Immunoglobulin A (IgA) and complement component 3 (C3) were detected by applying the respective primary antibodies at 1:100 overnight at 4 °C. Fluorophore-labeled secondary antibodies diluted 1:100 were added for 1 h at room temperature under light-protected conditions. After nuclear staining with 4′,6-diamidino-2-phenylindole (DAPI) for 5 min, fluorescence micrographs were collected using uniform acquisition settings and analyzed with image-analysis software.
For ultrastructural examination, freshly collected renal cortex was divided into blocks of approximately 1 mm3. The tissue was initially fixed in 2.5% glutaraldehyde at 4 °C for 24 h and then post-fixed in 1% osmium tetroxide for 2 h. Following dehydration and epoxy-resin embedding, ultrathin sections of 70–90 nm were prepared and contrasted with uranyl acetate and lead citrate. The sections were examined by transmission electron microscopy, with the same acquisition parameters applied when obtaining representative images.
Western blot analysis
Total protein was extracted from kidney tissue using radioimmunoprecipitation assay (RIPA) buffer supplemented with protease and phosphatase inhibitors. Protein content was measured by bicinchoninic acid (BCA) assay, and 30 µg from each sample was resolved on a 10% sodium dodecyl sulfate–polyacrylamide gel. After electrophoresis, the proteins were transferred to polyvinylidene fluoride (PVDF) membranes. The membranes were blocked in 5% non-fat milk for 1 h at room temperature and then maintained at 4 °C overnight with primary antibodies against TLR4, MyD88, phosphorylated inhibitor of NF-κB (p-IκB), phosphorylated NF-κB p65 (p-NF-κB p65), Col I, α-SMA, FN, nephrin, CD2AP, and WT-1 at 1:800 or β-actin at 1:1,000. After incubation with HRP-linked secondary antibodies at 1:5,000 for 1 h at room temperature, the bands were detected using enhanced chemiluminescence (ECL). Band intensities were measured with image-analysis software, using β-actin as the loading control.
Enzyme-linked immunosorbent assay (ELISA)
Renal cortex samples weighing approximately 100 mg were homogenized in 1 mL of ice-cold phosphate-buffered saline (PBS) supplemented with protease inhibitors. After centrifugation at 6,660 × g for 10 min at 4 °C, the clarified supernatants were retained. Tumor necrosis factor alpha (TNF-α), interleukin 1 beta (IL-1β), and interleukin 6 (IL-6) concentrations were measured with commercial enzyme-linked immunosorbent assay (ELISA) kits following the respective manufacturers’ protocols. Optical density was recorded at 450 nm with a microplate reader. Cytokine concentrations were derived from the corresponding standard curves and adjusted for the total protein content of each sample.
Statistical analysis
Statistical software was used for all calculations. Results are reported as the mean ± standard deviation. Group-level differences were evaluated by one-way analysis of variance (ANOVA), followed by Tukey’s multiple-comparisons test. Statistical significance was defined as p < 0.05.
النتائج
Renal function effects of Huangkui capsule in IgAN rats
After 8 weeks of administration, high–dose Huangkui capsule significantly reduced 24 h urinary protein and urinary red blood cell count, whereas low– and medium–dose treatments showed no significant effects (Figure 1A,B). High–dose Huangkui capsule also markedly decreased Scr and BUN levels, while low– and medium–dose treatments had no obvious effect (Figure 1C,D). These results indicate that Huangkui capsule exerts a protective effect on renal function in IgAN rats.
Liver function and lipid metabolism effects of Huangkui capsule in IgAN rats
After 8 weeks of administration, Huangkui capsule significantly increased serum ALB levels, while showing no obvious effect on ALT or AST levels (Figure 2A–C). It also markedly decreased serum TC, TG, and LDL–C levels, while increasing HDL–C levels (Figure 2D–G). These results indicate that Huangkui capsule can improve liver function and regulate lipid metabolism in IgAN rats.
Renal histopathological effects of Huangkui capsule in IgAN rats
H&E and PAS staining showed that, in the MOD group, mesangial cells were markedly increased, the mesangial area was widened, local collapse of glomerular capillary loops occurred, interstitial inflammatory cell infiltration was observed, mesangial matrix was abnormally deposited, focal glomerular basement membrane thickening was present, and the contour of the capillary loops was irregular (Figure 3A,B). Masson’s staining revealed a significant increase in blue–stained collagen fibers and pronounced fibrosis in the MOD group compared with the CON group (Figure 3C,D). After treatment with Huangkui capsule, the widening of the mesangial area, local collapse of capillary loops, interstitial inflammatory cell infiltration, abnormal mesangial matrix deposition, focal glomerular basement membrane thickening, and irregular loop contours were markedly alleviated, and the area of blue collagen fibers was significantly reduced with obvious improvement in fibrosis. These results indicate that Huangkui capsule can mitigate renal histopathological damage in IgAN rats.
Renal immunoglobulin A and complement component 3 deposition following Huangkui capsule treatment
Immunofluorescence analysis showed that the relative fluorescence intensity of IgA and complement component 3 (C3) was significantly higher in the MOD group compared with the CON group (Figure 4A–D). TEM revealed increased mesangial matrix and electron–dense deposits in the glomerular mesangium of the MOD group, along with diffuse podocyte foot process effacement, loss of normal filtration slit structure, podocyte cell body swelling, cytoplasmic vacuolization, and mitochondrial swelling (Figure 4E). Following treatment with Huangkui capsule, the relative fluorescence intensity of IgA and C3 was markedly reduced, mesangial matrix and electron–dense deposits were decreased, and pathological alterations in podocytes–including foot process effacement, filtration slit loss, cell body swelling, cytoplasmic vacuolization, and mitochondrial swelling–were substantially ameliorated. These findings indicate that Huangkui capsule attenuates IgA and C3 deposition as well as mesangial cell and podocyte injury in IgAN rats.
Renal fibrosis following Huangkui capsule treatment in IgAN rats
IHC analysis showed that the percentage of Col I-, α–SMA-, and FN-positive areas was significantly higher in the MOD group than in the CON group (Figure 5A–D). Following treatment with Huangkui capsule, the positive area percentages of Col I, α–SMA, and FN were markedly reduced. These results indicate that Huangkui capsule can improve renal fibrosis in IgAN rats.
Podocyte injury following Huangkui capsule treatment in IgAN rats
The extent of podocyte damage was assessed by IHC and WB. IHC results showed that, compared with the CON group, the MOD group exhibited significantly decreased expression of podocyte–specific and functional marker proteins CD2AP, WT–1, and Nephrin, indicating podocyte injury. Following Huangkui capsule treatment, the expression levels of these markers were markedly increased, suggesting alleviation of podocyte damage (Figure 6A–F). WB analysis similarly demonstrated that the relative protein expression levels of CD2AP, WT–1, and Nephrin were significantly reduced in the MOD group compared with the CON group, whereas Huangkui capsule administration significantly restored their expression (Figure 6G–J). These findings indicate that Huangkui capsule can mitigate podocyte injury in IgAN rats.
Podocyte injury and TLR4/MyD88/NF-κB signaling following Huangkui capsule treatment
Expression levels of this pathway were further analyzed using enzyme-linked immunosorbent assay (ELISA) and WB. ELISA results showed that, compared with the CON group, the MOD group exhibited significantly elevated levels of TNF–α, IL–1β, and IL–6 in renal tissue, whereas Huangkui capsule treatment markedly reduced their expression (Figure 7A–C). WB analysis demonstrated that the relative protein expression levels of TLR4, MyD88, phosphorylated IκBα (P–IκBα), and phosphorylated NF–κB (P–NF–κB) were significantly increased in the MOD group compared with the CON group, and were markedly decreased following Huangkui capsule administration (Figure 7D–H). These findings further indicate that Huangkui capsule may mitigate podocyte injury in IgAN rats by modulating the TLR4/MyD88/NF–κB signaling pathway.
Data Availability:
Data are available at 10.6084/m9.figshare.33012005.
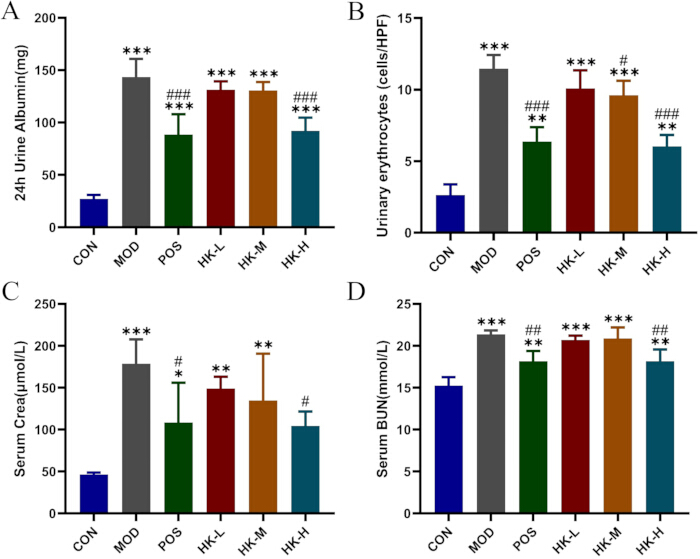
Figure 1. Renal function effects of Huangkui capsule in rats with immunoglobulin A nephropathy. (A) Effect of Huangkui capsule on 24 h urinary protein; (B) Effect of Huangkui capsule on urinary red blood cell count; (C) Effect of Huangkui capsule on Scr; (D) Effect of Huangkui capsule on BUN. Data are presented as mean ± SD (n = 3 per group). Compared with the normal control group, *p < 0.05, **p < 0.01, *** p < 0.001; compared with the model group, # p < 0.05, ## p < 0.01, ### p < 0.001. Abbreviations: CON = normal control; MOD = model; POS = valsartan positive control; HK-L = low-dose Huangkui capsule; HK-M = medium-dose Huangkui capsule; HK-H = high-dose Huangkui capsule; HPF = high-power field; Cre = creatinine; Scr = serum creatinine; BUN = blood urea nitrogen. Please click here to view a larger version of this figure.
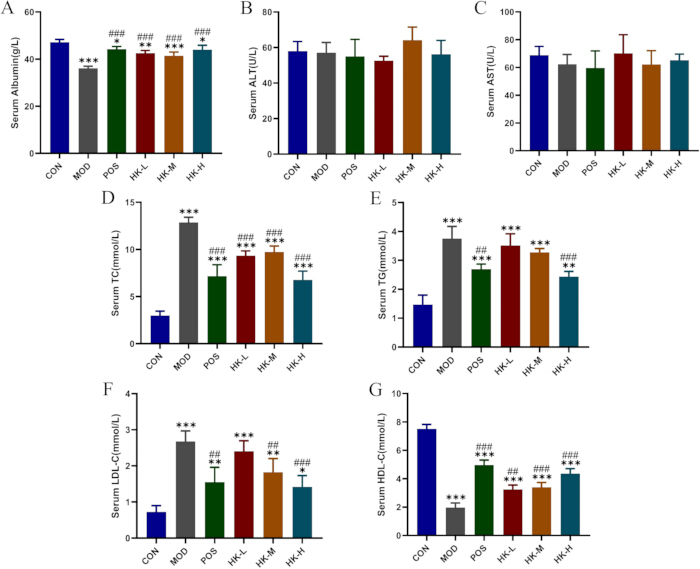
Figure 2. Liver function and lipid metabolism effects of Huangkui capsule in rats with immunoglobulin A nephropathy. (A–C) Effects of Huangkui capsule on ALB, AST, and ALT; (D–G) Effects of Huangkui capsule on TC, TG, LDL–C, and HDL–C. Data are presented as mean ± SD (n = 3 per group). Compared with the normal control group, *p < 0.05, **p < 0.01, *** p < 0.001; compared with the model group, # p < 0.05, ## p < 0.01, ### p < 0.001. Abbreviations: CON = normal control; MOD = model; POS = valsartan positive control; HK-L = low-dose Huangkui capsule; HK-M = medium-dose Huangkui capsule; HK-H = high-dose Huangkui capsule; ALB = albumin; AST = aspartate aminotransferase; ALT = alanine aminotransferase; TC = total cholesterol; TG = triglycerides; LDL-C = low-density lipoprotein cholesterol; HDL-C = high-density lipoprotein cholesterol. Please click here to view a larger version of this figure.
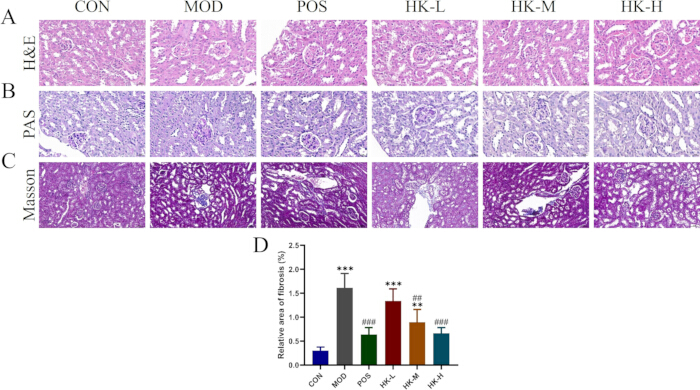
Figure 3. Renal histopathological effects of Huangkui capsule in rats with immunoglobulin A nephropathy. (A,B) Renal histology, including H&E and PAS; (C,D) Masson staining to assess renal fibrosis, with semi–quantitative analysis performed using image-analysis software. Scale bars = 20 µm (H&E), 20 µm (PAS), and 50 µm (Masson). Data are presented as mean ± SD (n = 3 per group). Compared with the normal control group, *p < 0.05, **p < 0.01, *** p < 0.001; compared with the model group, # p < 0.05, ## p < 0.01, ### p < 0.001. Abbreviations: CON = normal control; MOD = model; POS = valsartan positive control; HK-L = low-dose Huangkui capsule; HK-M = medium-dose Huangkui capsule; HK-H = high-dose Huangkui capsule; H&E = hematoxylin and eosin; PAS = periodic acid–Schiff. Please click here to view a larger version of this figure.
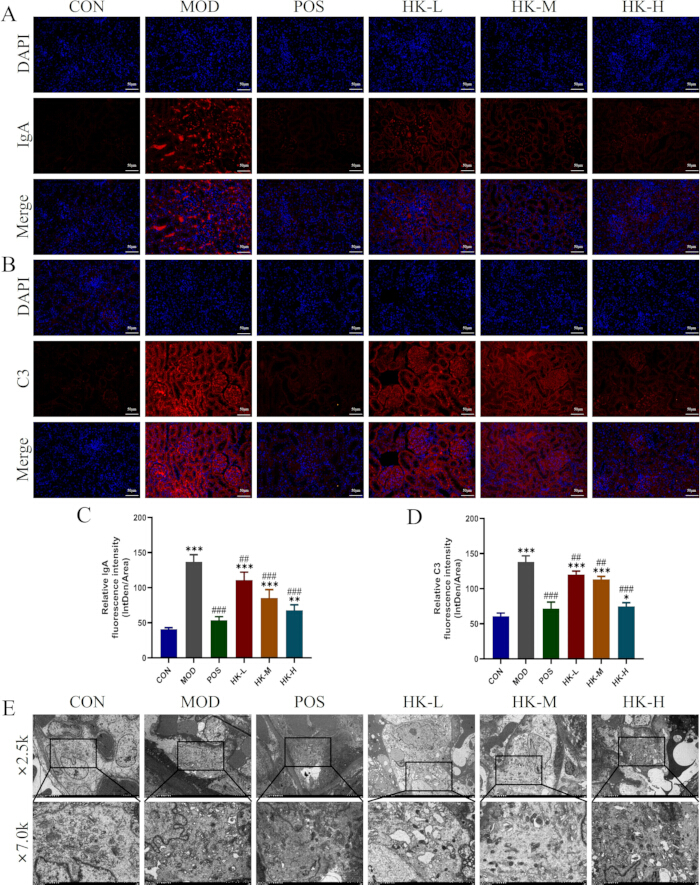
Figure 4. Renal immunoglobulin A and complement component 3 deposition following Huangkui capsule treatment. (A–D) IF analysis of relative fluorescence intensity (integrated density/area) of IgA and C3 in renal tissue; (E) TEM observation of glomerular mesangial cells and podocyte ultrastructure (2.5k, scale bar = 5 µm; 7.0k, scale bar = 2 µm). Data are presented as mean ± SD (n = 3 per group). Compared with the normal control group, *p < 0.05, **p < 0.01, *** p < 0.001; compared with the model group, # p < 0.05, ## p < 0.01, ### p < 0.001. Abbreviations: CON = normal control; MOD = model; POS = valsartan positive control; HK-L = low-dose Huangkui capsule; HK-M = medium-dose Huangkui capsule; HK-H = high-dose Huangkui capsule; DAPI = 4′,6-diamidino-2-phenylindole; IgA = immunoglobulin A; C3 = complement component 3; IF = immunofluorescence; TEM = transmission electron microscopy. Please click here to view a larger version of this figure.
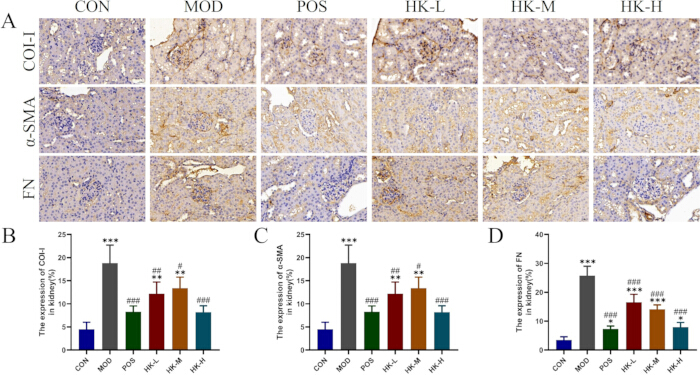
Figure 5. Renal fibrosis following Huangkui capsule treatment in rats with immunoglobulin A nephropathy. (A–D) Semi–quantitative analysis of relative expression levels of Col I, α–SMA, and FN in renal tissue using IHC and image-analysis software. Data are presented as mean ± SD (n = 3 per group). Compared with the normal control group, *p < 0.05, **p < 0.01, *** p < 0.001; compared with the model group, # p < 0.05, ## p < 0.01, ### p < 0.001. Abbreviations: CON = normal control; MOD = model; POS = valsartan positive control; HK-L = low-dose Huangkui capsule; HK-M = medium-dose Huangkui capsule; HK-H = high-dose Huangkui capsule; Col I = collagen I; α-SMA = alpha-smooth muscle actin; FN = fibronectin; IHC = immunohistochemistry. Please click here to view a larger version of this figure.
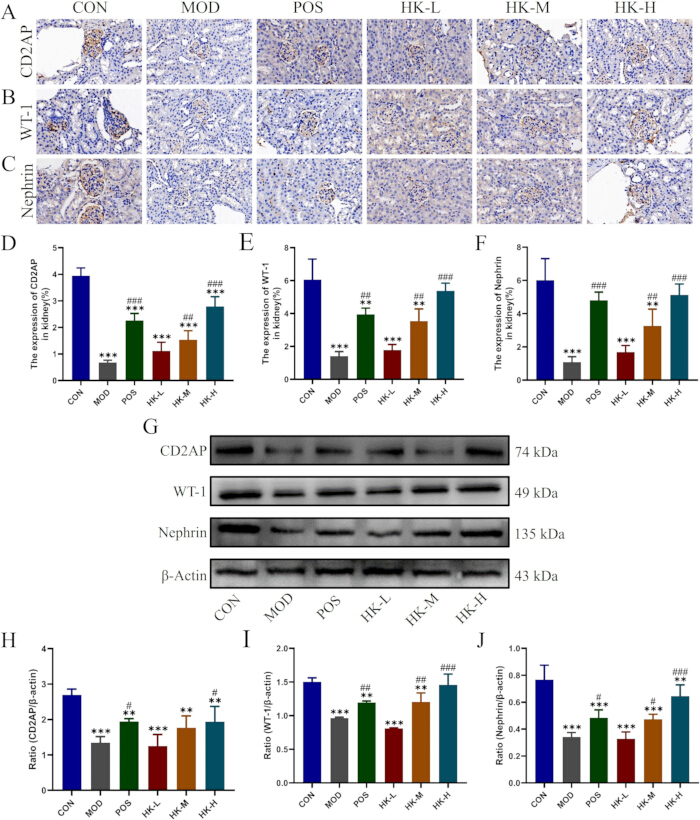
Figure 6. Podocyte injury following Huangkui capsule treatment in rats with immunoglobulin A nephropathy. (A–F) IHC analysis of relative expression levels of CD2AP, WT–1, and Nephrin in renal tissue, with semi–quantitative analysis using image-analysis software; (G–J) WB analysis of relative protein expression levels of CD2AP, WT–1, and Nephrin in renal tissue, with semi–quantitative analysis using image-analysis software. Data are presented as mean ± SD (n = 3 per group). Compared with the normal control group, *p < 0.05, **p < 0.01, *** p < 0.001; compared with the model group, # p < 0.05, ## p < 0.01, ### p < 0.001. Abbreviations: CON = normal control; MOD = model; POS = valsartan positive control; HK-L = low-dose Huangkui capsule; HK-M = medium-dose Huangkui capsule; HK-H = high-dose Huangkui capsule; IHC = immunohistochemistry; CD2AP = CD2-associated protein; WT-1 = Wilms' tumor protein 1; WB = western blot; β-actin = beta-actin. Please click here to view a larger version of this figure.
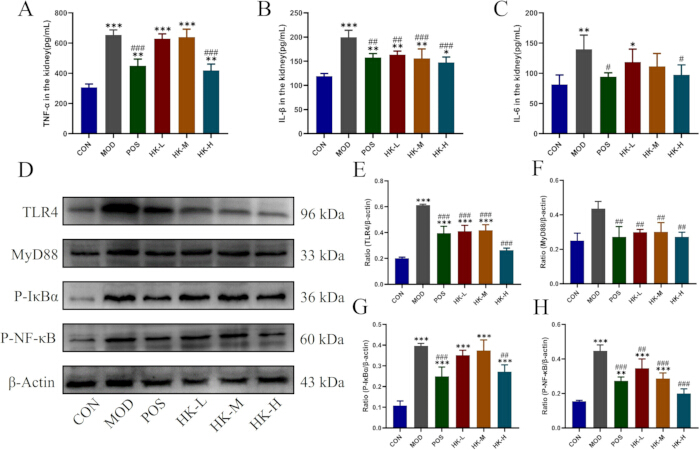
Figure 7. Podocyte injury and TLR4/MyD88/NF-κB signaling following Huangkui capsule treatment. (A–C) ELISA analysis of TNF–α, IL–1β, and IL–6 levels in renal tissue; (D–H) WB analysis of relative protein expression levels of TLR4, MyD88, P–IκBα, and P–NF–κB in renal tissue, with semi–quantitative analysis using image-analysis software. Data are presented as mean ± SD (n = 3 per group). Compared with the normal control group, *p < 0.05, **p < 0.01, *** p < 0.001; compared with the model group, # p < 0.05, ## p < 0.01, ### p < 0.001. Abbreviations: CON = normal control; MOD = model; POS = valsartan positive control; HK-L = low-dose Huangkui capsule; HK-M = medium-dose Huangkui capsule; HK-H = high-dose Huangkui capsule; ELISA = enzyme-linked immunosorbent assay; TNF-α = tumor necrosis factor alpha; IL-1β = interleukin 1 beta; IL-6 = interleukin 6; WB = western blot; TLR4 = Toll-like receptor 4; MyD88 = myeloid differentiation primary response protein 88; NF-κB = nuclear factor kappa B; P-IκBα = phosphorylated inhibitor of NF-κB alpha; P-NF-κB = phosphorylated nuclear factor kappa B; β-actin = beta-actin. Please click here to view a larger version of this figure.
المناقشة
The present study systematically evaluated the therapeutic effects and potential mechanisms of Huangkui capsule in an experimental rat model of IgA nephropathy. Our results demonstrated that Huangkui capsule significantly improved renal injury, as evidenced by reductions in hematuria, 24-h urinary protein excretion, serum creatinine, and blood urea nitrogen levels, together with marked attenuation of glomerular pathological injury, mesangial matrix expansion, fibrosis, and IgA/C3 immune complex deposition. Mechanistically, Huangkui capsule suppressed activation of the TLR4/MyD88/NF-κB signaling pathway, reduced renal inflammatory cytokine production, restored the expression of podocyte-associated proteins, and preserved the integrity of the glomerular filtration barrier. Collectively, these findings suggest that Huangkui capsule exerts renoprotective effects through coordinated regulation of inflammatory signaling and podocyte injury in IgAN.
A major finding of the present study is the establishment of a mechanistic cascade linking inflammatory signaling to structural renal protection. Activation of the TLR4/MyD88/NF-κB pathway in IgAN promoted the production of the pro-inflammatory cytokines TNF-α, IL-1β, and IL-6, thereby amplifying local renal inflammation and contributing to mesangial proliferation and immune complex deposition. Persistent inflammatory injury subsequently disrupted podocyte homeostasis, resulting in decreased expression of nephrin, CD2AP, and WT-1, impairment of the slit diaphragm, and dysfunction of the glomerular filtration barrier. Huangkui capsule effectively interrupted this pathological cascade by suppressing activation of the TLR4/MyD88/NF-κB pathway, reducing inflammatory cytokine secretion, alleviating mesangial injury and immune deposition, restoring podocyte-associated protein expression, and ultimately reducing proteinuria and hematuria. These sequential changes indicate that suppression of inflammation and preservation of podocyte integrity jointly contribute to the renoprotective effects of Huangkui capsule.
Podocyte injury is increasingly recognized as a critical determinant of disease progression in IgAN14. Nephrin is the principal structural protein of the slit diaphragm and is indispensable for maintaining the selectivity of the glomerular filtration barrier. CD2AP functions as an adaptor protein linking nephrin to the actin cytoskeleton, whereas WT-1 is a podocyte-specific transcription factor that regulates the expression of nephrin and other differentiation-related proteins. Downregulation of these proteins results in foot process effacement, disruption of slit diaphragm integrity, and progressive proteinuria. Consistent with previous studies, our results demonstrated significant reductions in nephrin, CD2AP, and WT-1 expression in IgAN rats, accompanied by severe podocyte injury15,16,17. Huangkui capsule markedly restored the expression of these proteins, suggesting that preservation of podocyte structural integrity is an important mechanism underlying its antiproteinuric effects.
Accumulating evidence indicates that the TLR4/MyD88/NF-κB signaling pathway plays a central role in mediating renal inflammation during IgAN progression. Aberrantly glycosylated IgA-containing immune complexes activate TLR4 on mesangial cells and podocytes, initiating MyD88-dependent signaling and subsequent phosphorylation of IκBα and NF-κB. Activated NF-κB translocates into the nucleus and induces transcription of multiple pro-inflammatory cytokines, including TNF-α, IL-1β, and IL-6, thereby amplifying immune-inflammatory responses and promoting mesangial proliferation, podocyte injury, and extracellular matrix accumulation18,19,20. In the present study, expression of TLR4, MyD88, phosphorylated IκB, phosphorylated NF-κB, TNF-α, IL-1β, and IL-6 was significantly increased in IgAN rats, indicating activation of this inflammatory cascade. Treatment with Huangkui capsule markedly suppressed these changes, suggesting that inhibition of TLR4/MyD88/NF-κB-mediated inflammatory signaling contributes substantially to its renoprotective effects. However, because our findings are based primarily on expression analyses, they should be interpreted as evidence of pathway modulation rather than definitive proof of causality. Additional functional studies using specific inhibitors or genetic intervention models are required to confirm the direct involvement of this pathway.
Notably, Huangkui capsule exhibited an apparent dose-dependent therapeutic effect. Among the three treatment groups, the high-dose group consistently produced the greatest improvements in urinary protein excretion, renal histopathology, inflammatory cytokine levels, and expression of TLR4/MyD88/NF-κB pathway-related proteins. Although the low- and medium-dose groups also demonstrated protective effects, these improvements were comparatively less pronounced. These findings suggest that sufficient exposure to the active constituents of Huangkui capsule may be required to effectively suppress inflammatory signaling and preserve podocyte function. Nevertheless, additional pharmacokinetic studies and dose-optimization experiments are necessary to determine the optimal therapeutic dosage and evaluate its long-term safety.
In addition to renal function, liver function and lipid metabolism were evaluated because metabolic disturbances frequently accompany chronic kidney disease and may contribute to renal injury. Previous studies have reported that Huangkui capsule possesses anti-inflammatory and metabolic regulatory activities in addition to its renoprotective effects. Although these biochemical indices were not the primary mechanistic outcomes of the present study, partial improvement in lipid metabolism further supports the systemic pharmacological activity of Huangkui capsule.
Compared with valsartan, which primarily reduces proteinuria by inhibiting the renin-angiotensin system and improving intraglomerular hemodynamics, Huangkui capsule demonstrated broader pharmacological activity. In addition to improving renal function and reducing proteinuria, Huangkui capsule suppressed inflammatory signaling, restored podocyte-associated proteins, attenuated immune complex deposition, and partially improved lipid metabolism. These findings suggest that the multi-component and multi-target characteristics of Huangkui capsule provide complementary therapeutic advantages beyond the conventional antiproteinuric effects of angiotensin receptor blockers. Nevertheless, additional comparative and combination studies are warranted to further evaluate the relative efficacy and potential synergistic effects of these therapeutic strategies.
Several limitations of the present study should be acknowledged. First, the protective effects of Huangkui capsule were evaluated only in vivo, and the underlying mechanisms were not validated using cultured podocytes or mesangial cells. Second, although Huangkui capsule contains multiple flavonoid constituents with potential anti-inflammatory activities, the specific bioactive compounds responsible for suppressing TLR4/MyD88/NF-κB signaling remain unidentified. Third, direct causal relationships between pathway inhibition and renal protection were not confirmed using pharmacological inhibitors or gene knockdown approaches. Finally, our findings were not validated using renal biopsy specimens from patients with IgAN; therefore, the clinical relevance of the observed molecular alterations requires further confirmation. Future studies should integrate podocyte and mesangial cell experiments, genetic or pharmacological intervention strategies, active flavonoid component screening, multi-omics analyses, and validation using clinical renal biopsy specimens to further elucidate the molecular mechanisms underlying Huangkui capsule treatment. Such investigations will facilitate translation of these experimental findings into clinical practice and provide stronger evidence supporting Huangkui capsule as a multi-target therapeutic strategy for IgA nephropathy.
In conclusion, Huangkui capsule effectively attenuated renal injury in experimental IgAN, possibly by suppressing activation of the TLR4/MyD88/NF-κB signaling pathway, reducing inflammatory cytokine production, preserving podocyte integrity, and restoring glomerular filtration barrier function. These findings provide experimental evidence supporting the potential application of Huangkui capsule as a multi-target therapeutic agent for IgAN, although further mechanistic and clinical studies are required to validate these observations.
الإفصاحات
The authors have no conflicts of interest to declare.
شكر وتقدير
The authors would like to thank all members of the research team for their technical assistance and support during this study. This work was supported by the Jilin Provincial Natural Science Foundation (No. YDZJ202301ZYTS208).
المواد
| الاسم | الشركة | رقم فهرسي | التعليقات |
|---|---|---|---|
| 30% H2O2 | China National Pharmaceutical Group Chemical Reagent Co., Ltd | 10011218 | |
| 812 embedding agent | SPI | 90529-77-4 | |
| Acetone | China National Pharmaceutical Group Chemical Reagent Co., Ltd | 10000418 | |
| Acetonitrile | Thermo | 75-05-8 | |
| Ammonia | China National Pharmaceutical Group Chemical Reagent Co., Ltd | 10002118 | |
| Ammonium formate | Sigma | 540-69-2 | |
| Analytical balance | Changzhou Lucky Electronic Equipment Co., Ltd | FA | |
| Anhydrous ethanol | China National Pharmaceutical Group Chemical Reagent Co., Ltd | 10009218 | |
| Anti fluorescence quenching and sealing agent | southernbiotech | 0100-01 | |
| BCA Protein Assay Kit | Solarbio | PC0020 | |
| Blender | Kylin-Bell | BE-2600 | |
| Brick and stone cutting blade | Daitome | Ultra45 | |
| BSA | ZSGB-BIO | ZLI-9027 | |
| Buffer RW | Beijing Baiao Leibo | WK191 | |
| Carbodiimide hydrochloride | Hubei Xinghengye Technology | 25952-53-8 | |
| Cell apoptosis detection kit | Elabscience | E-CK-A322 | |
| Chemiluminescence imaging system | Hangzhou Shenhua Technology Co., Ltd | SH-523 | |
| Constant temperature drying oven | Thermo Fisher | Heto PowerDiy LL3000 | |
| Cover glass slide | Jiangsu Shitai Experimental Equipment Co., Ltd | 10212450C | |
| CY3 Conjugated AffiniPure Goat Anti-rabbit IgG (H+L) | BOSTER | BA1032 | 1:100 (IF) |
| DAB reagent kit | Servicebio | G1212-200T | |
| DAPI | Blue Cloud Sky | C1002 | |
| Decolorization shaker | Wuhan Lingsi Biotechnology Co., Ltd | TSY-B | |
| Dehydration machine | Wuhan Junjie Electronics Co., Ltd | JJ-12J | |
| ECL substrate solution | affinity | KF8003 | |
| Electric constant temperature water bath pot | Fisaff Instrument (Hebei) Co., Ltd | DK-20000-IIIL | |
| Electrophoresis instrument power supply | Beijing Longfang Technology Co., Ltd | LF-600S | |
| Embedding machine | Wuhan Junjie Electronics Co., Ltd | JB-P5 | |
| FA series multifunctional analytical electronic balance | Changzhou Lucky Electronic Equipment Game Company | FA1204 | |
| Filter membrane | Jinteng | Nylon6-0.22μm | |
| Formaldehyde solution | China National Pharmaceutical Group Chemical Reagent Co., Ltd | 10010018 | |
| Formic acid | TCI | 64-18-6 | |
| Freezing centrifuge | Xiangyi | H1850-R | |
| Frozen platform | Wuhan Junjie Electronics Co., Ltd | JB-L5 | |
| Glacial acetic acid | China National Pharmaceutical Group Chemical Reagent Co., Ltd | 10000218 | |
| Glass bead | Sigma | G8772-500G | |
| Glass slide | Nantong Meiweide Life Science Co., Ltd | PC2-301 | |
| glycine | Biofroxx | 30166428 | |
| Goat Anti-Rabbit IgG (H+L), HRP | AFFINITY Biosciences, Cincinnati, OH, USA | S0001 | 1:500 (IHC) |
| Goat Anti-Rabbit IgG, Cy3 Conjugated | Boster Biological Technology Co., Ltd., Wuhan, China | BA1032 | 1:100 (IF) |
| Hematoxylin | Wuhan Lingsi Biotechnology Co., Ltd | G1140 | |
| High speed refrigerated centrifuge | Hunan Kecheng Instrument Equipment Co., Ltd | H1-16KR | |
| Hitachi HT7800 | HITACHI | HT7800/HT7700 | Transmission electron microscope |
| Horizontal agarose electrophoresis tank | Long Fang | LF-31DS | |
| Horizontal shaker | Jiangsu Haimen Qilin Bell Instrument Manufacturing Co., Ltd | TS-1 | |
| HRP Conjugated AffiniPure Goat Anti-rabbit IgG (H+L) | BOSTER | BA1054 | 1:5,000 (WB) |
| Huangkui Capsule | Jiangsu Suzhong Pharmaceutical Group Co., Ltd., Taizhou, China | Z19990040 | |
| hydrochloric acid | China National Pharmaceutical Group Chemical Reagent Co., Ltd | 10011028 | |
| ImageJ | Image-analysis software | ||
| Imaging system | Nikon | Nikon DS-U3 | |
| Intelligent digital magnetic heating stirrer | Hangzhou Miou Instrument Co., Ltd | TP-350E+ | |
| Isopropanol | China National Pharmaceutical Group Chemical Reagent Co., Ltd | 80109218 | |
| KCl | China National Pharmaceutical Group Chemical Reagent Co., Ltd | 10020318 | |
| Liquid chromatograph | Thermo | IQLAAAGABHFAPUMBJC | |
| marker(10-250 kD) | Mei5bio | MF028-plus-01 | |
| marker(20-120 kD) | GenScript | M00521 | |
| Masson staining kit | BASO | BA4079B | |
| Methanol | Thermo | 67-56-1 | |
| microscope | Nikon | ECLIPSE Ci | |
| microwave oven | Galanz Microwave Oven Electrical Appliance Co., Ltd | P70D20TL-P4 | |
| Multi sample tissue grinder | Shanghai Jingxin Industrial Development Co., Ltd | Tissuelyser-24L | |
| Multifunctional analytical electronic balance | Changzhou Lucky Electronic Equipment Game Company | FA1204 | |
| Multiskan FC ELISA reader | Thermo scientific | 1410101 | |
| Neutral resin | Wuhan Lingsi Biotechnology Co., Ltd | G8590 | |
| Normal Goat Serum | Solarbio | SL038 | |
| Organizational spreading machine | Zhejiang Jinhua Kedi Instrument Equipment Co., Ltd | KD-P | |
| Osmic acid | Ted Pella Inc | 18450 | |
| oven | Shanghai Huitai Instrument Manufacturing Co., Ltd | DHG-9140A | |
| Palm centrifuge | Wuhan Lingsi Biotechnology Co., Ltd | D1008E | |
| Paraformaldehyde | Solarbio | P1110 | |
| PAS staining kit | BASO | BA4114B | |
| Pathological slicer | Shanghai Leica Instrument Co., Ltd | RM2016 | |
| PBS | Solarbio | P1020 | |
| Pipette gun | Dragon | KE0003087/KA0056573 | |
| Protein phosphatase inhibitor complex | Meilunbio | MB12707-1 | |
| PVDF membrane (0.22 μm) | Solarbio | ISEQ00010 | |
| PVDF membrane (0.45 μm) | Solarbio | YA1701 | |
| Quick primary/secondary antibody diluent | Solarbio | A1811 | |
| Rabbit anti-C3 | Affinity | DF13224 | 1:100 (IF) |
| Rabbit anti-CD2AP | Affinity | DF2298 | 1:200 (IHC), 1:800 (WB) |
| Rabbit anti-Col I | Affinity | DF12149 | 1:100 (IHC), 1:800 (WB) |
| Rabbit anti-FN | Affinity | AF5335 | 1:100 (IHC), 1:800 (WB) |
| Rabbit anti-IgA | Affinity | DF8563 | 1:100 (IF) |
| Rabbit anti-MyD88 | Affinity | AF5195 | 1:800 |
| Rabbit anti-Nephrin | Affinity | DF7501 | 1:200 (IHC), 1:800 (WB) |
| Rabbit anti-P-IκBα | Affinity | AF2002 | 1:800 |
| Rabbit anti-P-NF-κB | Affinity | AF3219 | 1:800 |
| Rabbit anti-TLR4 | Affinity | AF7017 | 1:800 |
| Rabbit anti-WT-1 | Affinity | DF6331 | 1:200 (IHC), 1:800 (WB) |
| Rabbit anti-α-SMA | Affinity | AF1032 | 1:100 (IHC), 1:800 (WB) |
| Rabbit anti-β-Actin | Affinity | AF7018 | 1:1000 |
| Rat IL-1β ELISA Kit | Wuhan Saipei Biotechnology Co., Ltd., Wuhan, China | SP12225 | |
| Rat IL-6 ELISA Kit | Wuhan Saipei Biotechnology Co., Ltd., Wuhan, China | SP12279 | |
| Rat TNF-α ELISA Kit | Wuhan Saipei Biotechnology Co., Ltd., Wuhan, China | SP12250 | |
| RIPA Lysis Buffer | Meilunbio | MA0151 | |
| SDS | China National Pharmaceutical Group Chemical Reagent Co., Ltd | 10019318 | |
| Slide and cover glass | Jiangsu Shitai Experimental Equipment Co., Ltd | 10212432C | |
| Sprague-Dawley rats | Liaoning Changsheng Biotechnology Co., Ltd. | SCXK (Liao) 2020-0001 | |
| SPSS version 26.0 (IBM Corp.). | IBM | Version 26.0 | Statistical software |
| Super pure water instrument | Zhiang Instrument (Shanghai) Co., Ltd | Clever-S15 | |
| Tissue grinder | Beautiful Wall | MB-96 | |
| TUNEL Cell Apoptosis Detection Kit (FITC) | Beijing Baiao Leibo | SY0475 | |
| Tween 20 | China National Pharmaceutical Group Chemical Reagent Co., Ltd | 30189328 | |
| Ultra micro UV visible spectrophotometer | Hangzhou Miou Instrument Co., Ltd | ND-100 | |
| Ultra thin slicer | Leica | Leica UC7 | |
| Ultrasonic cleaner | shumei | KQ- 800DE | |
| Upright optical microscope | Nikon | Nikon Eclipse CI | |
| Urinary Protein Test Kit | Nanjing Jiancheng Bioengineering Research Institute | C035-2 | |
| valsartan | MedChemExpress (MCE) | HY-18204 | |
| Vertical electrophoresis tank | Beijing 61 Instrument Factory | DYCZ-24DN | |
| Vortex mixer | Wuhan Lingsi Biotechnology Co., Ltd | MX-F | |
| Western Blocking Buffer | Solarbio | SW3010 | |
| xylene | China National Pharmaceutical Group Chemical Reagent Co., Ltd | 10023418 |
المراجع
- Stamellou E et al. IgA nephropathy. Nat Rev Dis Primers. 2023;9(1):67.
- Stoneman S, Teh JW, O’Shaughnessy MM. IgA nephropathy in adults: a review. JAMA. 2026;335(9):799-813.
- Fan Y, Wang Y, Xiao H, Sun H. Advancements in understanding the role of intestinal dysbacteriosis-mediated mucosal immunity in IgA nephropathy. BMC Nephrol. 2024;25(1):203.
- Roberts LE et al. IgA nephropathy: emerging mechanisms of disease. Indian J Nephrol. 2024;34(4):297-309.
- Su L et al. Epidemiology and outcomes of post-AKI proteinuria. Clin Kidney J. 2023;16(11):2262-70.
- Zhang J et al. The TLR4-MyD88-NF-κB pathway is involved in sIgA-mediated IgA nephropathy. J Nephrol. 2020;33(6):1251-61.
- Villain C, Wagner S, Koppe L. Elderly patients with chronic kidney disease: towards a better control of protein intake. Nephrol Dial Transplant. 2023;38(11):2420-2.
- Tan J et al. The efficacy and safety of immunosuppressive therapies in the treatment of IgA nephropathy: a network meta-analysis. Sci Rep. 2020;10(1):6062.
- Noor SM et al. IgA nephropathy: a review of existing and emerging therapies. Front Nephrol (Lausanne). 2023;3:1175088.
- Kidney Disease: Improving Global Outcomes (KDIGO) IgAN and IgAV Work Group. KDIGO 2025 clinical practice guideline for the management of immunoglobulin A nephropathy (IgAN) and immunoglobulin A vasculitis (IgAV). Kidney Int. 2025;108(4S):S1-71.
- Ding Z et al. Total extract of Abelmoschus manihot L. alleviates uric acid-induced renal tubular epithelial injury via inhibition of caspase-8/caspase-3/NLRP3/GSDME signaling. Front Pharmacol. 2022;13:907980.
- Yu H et al. Effects of Abelmoschus manihot (L.) and its combination with irbesartan in the treatment of diabetic nephropathy via the gut-kidney axis. Front Pharmacol. 2024;15:1424968.
- Ge J, Miao JJ, Sun XY, Yu JY. Huangkui capsule, an extract from Abelmoschus manihot (L.) medic, improves diabetic nephropathy via activating peroxisome proliferator-activated receptor (PPAR)-α/γ and attenuating endoplasmic reticulum stress in rats. J Ethnopharmacol. 2016;189:238-49.
- Filippone EJ, Gulati R, Farber JL. Contemporary review of IgA nephropathy. Front Immunol. 2024;15:1436923.
- Gagliardini E et al. Targeted downregulation of extracellular nephrin in human IgA nephropathy. Am J Nephrol. 2003;23(4):277-86.
- Coppo R, Fervenza FC. Dendrin in IgA nephropathy: protective or marker of early disease? Nephrol Dial Transplant. 2023;38(2):261-3.
- Wang G et al. Kidney organoid modeling of WT1 mutations reveals key regulatory paths underlying podocyte development. Adv Sci (Weinh). 2024;11(29):e2308556.
- Zhu Y et al. IgA nephropathy: gut microbiome regulates the production of galactose-deficient IgA1 via the TLR4 signaling pathway. Nephrol Dial Transplant. 2024;39(10):1624-41.
- Li L et al. Protective effect of modified Huangqi Chifeng decoction on immunoglobulin A nephropathy through toll-like receptor 4/myeloid differentiation factor 88/nuclear factor-kappa B signaling pathway. J Tradit Chin Med. 2024;44(2):324-33.
- Sun J et al. TACI Ig fusion protein inhibits TLR4/MyD88/NF-κB pathway alleviates renal injury in IgA nephropathy rats. Iran J Kidney Dis. 2024;18(6):326-36.
إعادة الطباعة والأذونات
تم نشر هذه المقالة
الفيديو قريباً