To address cumulative subtask delays and multi-user resource competition in smart education platforms, a MEC- and MADDPG-based multi-delay multi-agent task offloading scheme was proposed and validated through simulations and scenario tests. The completion time was only 16.2 s for 50 tasks, while the completion rate remained 96.8% for 60 users.
مقالة بحثية
Multi-Latency Multi-Agent Task Offloading Strategy for Smart Education Platforms Based on Edge Computing
في هذه المقالة
ملخص
الملخص
In smart education platforms, large-scale real-time interactive tasks usually involve complex subtask dependencies. The transmission, computation, and queuing delays generated by different subtasks are coupled with each other, making it difficult for traditional task offloading methods to achieve efficient scheduling. Meanwhile, multi-user concurrent requests further intensify edge computing resource competition. To address these challenges, this study proposes a task offloading scheme based on mobile edge computing (MEC) and multi-agent deep deterministic policy gradient (MADDPG). First, a smart education platform architecture including cloud nodes, edge nodes, and terminal devices is constructed to achieve cloud-edge-device collaborative computing. Second, addressing the shortcomings of existing task offloading methods that primarily focus on single latency metrics, ignore task dependencies, and lack flexibility in discrete offloading decisions, a MADDPG model is designed that integrates multi-latency perception, directed acyclic graph (DAG) task constraints, and continuous offloading ratio decision-making. This model incorporates task state, network state, and edge resource state into the agent decision-making process, achieving dynamic task offloading and resource optimization under multi-objective conditions. To validate the effectiveness of the proposed method, 19,200 task instances are generated using a DAG generator, and comparative experiments are conducted against ACO, GWO, DDPG, PPO, DQN, and Greedy Offloading methods. The results demonstrate that the proposed method outperforms all comparison approaches in terms of task completion time, energy consumption, task completion rate, and network adaptability. When the number of tasks reaches 50, the task completion time is reduced to 16.2 s, and the total energy consumption decreases to 0.95 J. When the number of users increases to 60, the task completion rate remains at 96.8%. The proposed scheme effectively addresses edge computing offloading problems under multi-task, multi-user, and multi-latency coupling conditions, providing a solution for intelligent resource scheduling in complex edge environments.
المقدمة
Education is the foundation of national development, and it is undergoing profound changes. The technologies related to computer information construction are also becoming more and more mature1. The Ministry of Education’s “Action Plan for Educational Informatization 2.0”, issued in April 2018, clearly proposed to implement the “Smart Education Innovation and Development Action”. It emphasizes the use of information technology to promote the transformation of educational concepts, teaching models, and management methods to promote educational equity and quality2. Intelligent education emphasizes real-time interaction between teachers and students, which differs from passive learning in traditional education. The computational tasks generated by this interaction have time delay constraints and are highly time-sensitive3,4,5. With the continuous advancement of information technology, MEC has provided a new approach to real-time data processing in systems. For example, a research group6 proposed an intelligent processing architecture based on MEC, which reduced cloud dependence and transmission latency by pushing computing tasks to edge nodes. A research group7 proposed an intelligent device-aware edge computing system. The results show that MEC can distribute infrastructure across multiple edge data centers in the access network, thereby effectively reducing latency and network congestion. MEC meets the high bandwidth and low latency requirements of mobile networks and enables flexible allocation of computing and storage resources, but it only has limited edge node computing resources. In multi-user scenarios, the simultaneous operation of multiple intelligent sensing applications leads to resource contention8,9. This reduces application operating efficiency, increases system response time, and interferes with teaching activities. Therefore, it is necessary to introduce a suitable task offloading scheme to ensure system real-time performance and service quality10,11.
In the field of task offloading, existing research mainly follows three technical routes. The first route is the heuristic optimization method. For example, a study12 proposed a cloud-edge collaborative vehicle task offloading method. This uses the ACO algorithm for multi-objective optimization to determine the optimal offloading position for load balancing. It also combines a simple weighted method with a multi-criteria decision optimization objective function. This effectively alleviates system congestion and latency in data processing. Another study13 integrated GWO and cellular automata to achieve dynamic task scheduling, and introduced a low-complexity algorithm based on Nawas-Enscore-Ham to improve scheduling efficiency and reduce system latency. The second route is the single agent deep reinforcement learning method. For example, a research group14 combines the low-latency processing advantage of fog computing with the adaptive decision-making capability of single-agent deep reinforcement learning to realize dynamic resource state perception and task optimization, thereby improving service quality while increasing system benefits. The third route is multi-agent reinforcement learning. For example, a research group15 prioritized tasks according to fault tolerance time and proposed a priority-driven collaborative offloading algorithm based on multi-agent deep reinforcement learning, which effectively reduced task processing latency and improved edge computing resource utilization. A research group16 applied multi-agent deep reinforcement learning to edge cache optimization, verifying the effectiveness of the multi-agent collaborative mechanism in dynamic network environments.
In summary, with the rapid development of smart education platforms, the amount of data that Internet of Things (IoT) terminals need to process is increasing dramatically, and they also have high real-time requirements. MEC provides a new technological path for the deployment of intelligent services in educational scenarios. The introduction of heuristic algorithms, game theory, and deep reinforcement learning methods, among others, provides important support for the efficient allocation and utilization of computing resources. However, existing research mostly focuses on minimizing latency, paying less attention to the multi-task offloading problem under various latency constraints. To address these shortcomings, this study designs a multi-latency, multi-agent task offloading scheme based on MEC and MADDPG.
While the MADDPG algorithm has been applied in some edge computing task offloading research, existing work mainly focuses on Vehicle-to-Everything (V2X), smart cities, or general MEC scenarios. Its optimization objectives are typically single-system latency or energy consumption, neglecting the multi-latency coupling characteristics of multiple subtasks within the same task in smart education scenarios, where transmission latency, computation latency, and queuing latency are superimposed due to dependencies. Furthermore, most existing MADDPG offloading schemes assume that tasks are independent of each other, failing to consider the constraints of the directed acyclic graph structure of subtasks on the offloading decision order. Their action space typically employs discrete offloading decisions (i.e., tasks are either completely executed locally or completely offloaded), making it difficult to achieve fine-grained task decomposition between local and edge environments. Unlike the aforementioned studies, this paper's innovation lies in three aspects: First, it is the first to explicitly model the multi-delay coupling characteristics into the state space of MADDPG. It enables each agent to simultaneously perceive the transmission delay, computation delay, and queue delay information of subtasks, thus comprehensively weighing the superimposed effects of the three types of delays during decision-making. Second, for the inherent directed acyclic graph dependency structure of teaching tasks in smart education platforms, a ready state judgment mechanism based on task topology sequences is designed. It is to ensure that the current subtask can only enter the unloading decision queue after the predecessor subtask is completed, filling the gap in existing MADDPG unloading models that cannot handle task dependencies. Third, a continuous action space is used to replace the traditional discrete unloading decision, enabling agents to output a continuous unloading ratio between 0 and 1, realizing partial unloading of subtasks between local and edge environments, which has higher scheduling flexibility than the complete unloading schemes in existing studies.
البروتوكول
The MADDPG model training and main performance tests were based on a simulated task dataset generated from a directed acyclic graph, completed on the WANem network simulation platform and MEC test platform, and do not involve human experiments or biomedical research. To verify the solution's effectiveness in practical applications, the study used historical operational logs from the fall semester of 2024 of a university's online teaching platform for backtracking testing. The data only contains system information such as task requests, network status, resource utilization, and task execution results, and does not contain any personally identifiable information. All data was anonymized and desensitized before analysis and is used solely for algorithm performance evaluation and system verification. Therefore, this study is not a human subject study, and no ethical review or informed consent is required. All experiments comply with data security and privacy protection requirements and are used solely for scientific research. All the materials used in this study are listed in the Table of Materials.
MEC-based smart education platform
Teachers generate a large amount of real-time data (such as videos, interactive task feedback, etc.) during teaching17. MEC provides low-latency, high-bandwidth real-time services by processing data locally18,19. To improve teaching effectiveness and help teachers understand students' learning situations, a smart education platform based on MEC is proposed, as shown in Figure 1.
Overall architecture of the smart education platform
In Figure 1, the platform mainly consists of cloud nodes, edge nodes, and terminal devices. The cloud node architecture includes an AI training platform, a private image repository, a data repository, and a knowledge recommendation engine, as shown in Figure 2.
Cloud node architecture
As shown in Figure 2, to achieve rapid portability and efficient deployment of intelligent applications, Docker technology is introduced into cloud nodes. Docker is an open-source project that simplifies application deployment and management through lightweight containerization technology20,21. The system first packages the trained model and its running environment into a Docker image and uploads it to a private image repository for centralized management. To meet different task requirements, the cloud nodes regularly update the images to ensure that the application and model versions are up-to-date. Considering the limited storage capacity of edge nodes, the system adopts distributed storage and data backup technology to store resources such as teaching videos, e-textbooks, and exercise sets in the database. The Docker Engine version is v20.10, using the overlay2 storage driver.
The container runtime uses runc, and each container's CPU quota is limited to 2 cores, memory is limited to 4GB, and the log driver is json-file. The maximum size of a single container log file is limited to 100MB, and a maximum of 3 log files are retained. The Docker image is built on an Ubuntu 20.04 LTS base image and comes pre-installed with TensorFlow 2.0 and PyTorch 1.7 inference environments. The private image repository is deployed using Harbor v2.5 in a high-availability cluster (3 replicas). The storage backend uses MinIO distributed object storage, with security authentication via TLS-encrypted communication and Role-Based Access Control (RBAC). The use of MinIO distributed object storage ensures high availability of image data. Edge nodes establish a secure connection to the repository via Docker Engine v20.10 and periodically pull the latest model images using the “docker pull” command. The image pull policy is set to “IfNotPresent”, and the garbage collection cycle is set to execute every 72h. Cloud nodes automatically build and push updated images to the private repository every 24h via a CI/CD pipeline (Jenkins), ensuring image version consistency. The knowledge recommendation engine intelligently recommends resources based on user behavior and learning needs to enhance the teaching experience and learning efficiency. The edge node architecture mainly includes data middleware and the edge service layer, as shown in Figure 3.
Edge node architecture
As shown in Figure 3, after the device connects to the edge node, the data middleware first performs authentication to prevent attacks from malicious devices. The authentication mechanism uses JSON Web Token (JWT) verification, with a token validity period of 24 hours. The data middleware is deployed based on EMQX v5.0, supporting the MQTT protocol and WebSocket connections. The message queue is configured with QoS level 1, message retention enabled, message persistent storage to local SSD, and a maximum queue depth of 10,000 messages/second. After successful authentication, the middleware verifies the received data to ensure its legality and integrity. The validation rules include: data format validation (JSON Schema validation), integrity validation (MD5 hash comparison), and timestamp freshness validation (deviation less than 5 s). If the data is illegal, the data source will be blacklisted, preventing subsequent interactions. If the data is legal, it will be cleaned to remove invalid information and noise, improving processing efficiency and accuracy. The cleaned data is then transmitted to the edge service layer, which includes business management, data storage and visualization, collaborative computing services, and message queues. The business management module uses Docker to uniformly manage various business functions of the platform. Each edge node pre-deploys Docker containers, including: a data middleware container (EMQX), a message queue container (RabbitMQ), a collaborative computing service container (gRPC Server), and a resource monitoring agent container (Prometheus Node Exporter). All containers are orchestrated and managed using Docker Compose v2.20, the container network uses bridge mode, and inter-container communication is isolated through a custom network (edge_network, subnet 172.20.0.0/16).
The data storage and visualization module is primarily responsible for data storage, caching, and visualization. This module uses Redis v6.2 as the caching middleware, configured with an LRU eviction policy, a maximum memory limit of 4GB, and a cache expiration time of 300 s. The storage module reduces system response time by caching hot resources and duplicate computation results. Through a graphical interface, the visualization module displays system status, task progress, and resource usage in real time, allowing users to quickly grasp the overall picture and make decisions. The collaborative computing service enables interaction among the cloud, the edge, and devices, enabling collaborative task allocation and execution. The collaborative computing service is implemented based on the gRPC protocol, using port 50051 and TLS 1.3 encryption. The maximum gRPC message size is set to 50MB, the connection timeout is 10s, the keepalive interval is 30s, the keepalive timeout threshold is 10s, and the TLS encryption suite uses TLS_ECDHE_RSA_WITH_AES_128_GCM_SHA256. The heartbeat detection interval is 5s, the timeout threshold is 30s, and the retry mechanism uses an exponential backoff strategy (initial interval 1s, maximum interval 60s).
The message queue module, responsible for asynchronous communication between components, alleviates multi-task concurrency conflicts, ensuring tasks are processed according to priority and time order, improving system response speed and operational stability. The message queue is deployed using RabbitMQ v3.9, configured as a persistent queue with an acknowledgment mechanism. RabbitMQ listens on ports 5672 (AMQP) and 15672 (management interface). The queue persistence policy is set to “durable = true”, the dead-letter exchange is set to “dlx.exchange”, and the message unacknowledged timeout is set to 30 s. The exchange type is “topic”, the queue binding keys are set to “task.#” and “resource.#”, the message acknowledgment mode is manual ack, and the prefetch count is 100. For EMQX configuration, it listens on ports 1883 (MQTT), 8083 (WebSocket), and 8883 (MQTT over TLS). The maximum concurrent connections are set to 10,000, the heartbeat interval is set to 60 s, and the maximum message ordering queue depth is set to 100. The MQTT protocol supports QoS levels 0, 1, and 2, with QoS 1 used by default. Reserved messages are enabled, and the maximum message packet size is set to 256MB. For resource monitoring, each edge node deploys Prometheus Node Exporter v1.3, collecting CPU utilization, memory usage, network I/O, and disk read/write metrics at 15-second intervals. Data is aggregated to a central Prometheus server via Pushgateway, with Grafana v9.0 providing a real-time monitoring dashboard. Alarm rules are set as follows: CPU utilization exceeding 85% for 5 minutes triggers an alert, exceeding 95% triggers an emergency alert. Memory utilization exceeding 90% for 5 minutes triggers an alert. Disk utilization exceeding 85% triggers an alert, and network packet loss exceeding 1% triggers an alert. The terminal device architecture is shown in Figure 4.
Terminal device architecture
In Figure 4, the terminal device architecture is broken into a hardware layer, a business support layer, and a presentation layer. The hardware layer includes a CPU and communication modules such as WiFi and Bluetooth, providing underlying support for data acquisition, communication, and basic computing. The business support layer provides edge-end collaboration and supports task offloading decisions. The presentation layer is responsible for the visual interface and improves the user experience. The sub-task attributes of devices of the same type are usually consistent22. It assumes that the edge node computing power is 16 cores and the main frequency is 3.6 GHz. During the data acquisition phase, the study conducts multiple rounds of testing on the intelligent sensing application within the platform by accessing the /proc file system, recording the attribute values of the subtasks during each round of runtime. Simultaneously, to adapt to different types of directed acyclic graph structures, a directed acyclic graph generator is designed to control the number of nodes, the maximum in-degree, and the maximum out-degree based on user input. The dataset construction process is as follows:
The study first uses Python 3.8 to implement a directed acyclic graph generator, and then randomly generates task topologies based on the number of nodes, the maximum in-degree, and the maximum out-degree. The number of nodes is set to 5–20, the maximum in-degree to 3, and the maximum out-degree to 4. Each directed acyclic graph corresponds to a complete teaching task, with nodes representing executable subtasks and edges representing dependencies between tasks. Subsequently, computational and communication attributes are assigned to each subtask. The task data size is randomly set to 1–3MB, the computational requirement to 500–6,000 Mcycles, the task deadline to 5–25s, and the task arrival interval to 2–10s. To simulate scenarios such as real-time video analysis, classroom interaction feedback, and online assessment in a smart education platform, the system further randomly generates user request intensity, task priority, and resource requirement levels. The task priority is divided into three levels: high, medium, and low, with corresponding weights of 1.0, 0.7, and 0.4, respectively. The network environment is built using WANem. Communication bandwidth between terminal devices and edge nodes is randomly set to 10–100 Mbps, link latency to 5–50 ms, packet jitter to 1–10 ms, and packet loss rate to 0.1%. Six edge nodes are deployed in the edge computing layer, each configured with a 16-core 3.6 GHz processor and 64 GB of memory. Terminal device CPU frequencies are set to 1.8–2.4 GHz, and memory capacity to 4–8GB. During task generation, task status, network status, and edge resource usage are recorded in real time. Task status includes task data volume, computational requirements, and remaining deadline; network status includes available bandwidth and link latency. Resource status includes CPU utilization, memory utilization, and task queue length. A total of 19,200 task instances are generated, with 80% used for environment interaction and policy learning during model training, and 20% used for model testing and performance evaluation. To reduce the impact of random initialization on experimental results, all experiments are run independently using five different random seeds, and the final result is the average of the five experiments.
Multi-delay multi-agent task offloading model based on MADDPG
In edge computing environments, the efficiency of task offloading directly affects the overall performance of MEC smart education platforms. The offloading process is constrained by various latency factors, mainly including transmission latency, computation latency, and queuing latency23,24. Among them, transmission latency is mainly affected by transmission distance and bandwidth; computation latency depends on the resource load and processing capacity of edge nodes. Computational latency depends on the resource load and processing capacity of edge nodes, while queuing latency stems from the system's task scheduling and resource allocation mechanisms. Various types of latency overlap during the offloading, increasing the complexity of task offloading. In multi-agent scenarios, multiple users run multiple intelligent applications simultaneously, and each user may initiate multiple computationally intensive tasks at the same time, with varying resource requirements and priorities, further exacerbating the difficulty of computing resource scheduling and allocation25,26.
MADDPG adopts a "centralized training, distributed execution" architecture, which is suitable for multi-user offloading scenarios27. In this model, each computational task corresponds to an agent, and decision optimization is performed based on the Actor-Critic architecture. This study models the multi-latency task offloading problem as a partially observable Markov decision process (POMDP). For any agent, its state space consists of the task data volume, task computation requirements, current network bandwidth, link latency, and edge node queue length. The observation space is defined as the local information that each agent can acquire, including the local state of the corresponding task (task data volume, computation requirements, remaining deadline) and the available bandwidth and queue length of the currently connected edge nodes. The action space is defined as continuous offloading decision variables, with values ranging from [0,1], where 0 indicates that the task is executed entirely locally, 1 indicates that the task is completely offloaded to the edge node, and intermediate values indicate partial offloading. The offloading decision encoding uses a direct continuous-valued output without discretization.
The core idea of the Actor-Critic architecture is to improve the efficiency and performance of the decision-making process through cooperation and optimization between Actor networks and Critic networks28,29. The structure of the Actor is denoted in Figure 5.
Actor network structure
In Figure 5, the Actor consists of two fully connected layers: the first layer contains 1024 neurons and uses the ReLU activation function to enhance nonlinear expressive power. The second layer contains 500 neurons and is used for high-dimensional abstraction and mapping of features. The output layer generates continuous action values based on the agent's action dimensions, realizing forward propagation of the optimal policy's action decisions. The Critic structure is denoted in Figure 6.
Critic network structure
In Figure 6, the Critic contains three fully connected layers. The input layer is first mapped to a 500-dimensional feature representation through the first fully connected layer. Then, it is further compressed into a 128-dimensional feature space through the second fully connected layer. Finally, the Q-value estimate corresponding to the action space dimension is output through the third fully connected layer. Information is passed layer by layer through forward connections. Each agent stores its observations, actions, rewards, and next state in a local experience pool. The experience data of all agents are periodically merged to form a shared experience pool for all agents to learn from. In this way, each agent can learn not only from its own experience but also from the experience of other agents, reducing inefficient decisions caused by insufficient information. During training, the platform randomly selects a batch of data from the merged experience pool to update each agent's decision network. The agent uses the policy gradient of the current state to calculate the loss, updates the evaluation network, and thus optimizes the policy. This entire process uses gradient ascent to maximize the system's long-term reward. During the update process, the parameters of the evaluation and decision networks are updated softly, so that the agent's decision strategy can gradually approach the optimum.
In addition, the reasonable design of the reward function is the key prerequisite for the multi-agent deep reinforcement learning algorithm to maximize long-term rewards30. Considering that the task offloading objective in the smart education platform not only needs to reduce system energy consumption, but also needs to ensure that the task can be completed within the deadline. The reward function ri designed in the study mainly consists of two parts: energy consumption reward and task completion rate reward, as shown in Equation (1).
 (1)
(1)
In Equation (1), Δfnorm (ei) represents the normalized increase in system energy consumption after completing the current subtask,  is the reward coefficient for task completion rate, α and β represent the energy consumption increment and the weight coefficient for task completion, respectively. Task completion rate reflects the platform's Quality of Service (QoS), while system energy consumption reflects the efficiency of edge computing resource utilization, both jointly determine the effectiveness of the task offloading strategy. To avoid imbalances caused by different metric dimensions during training, the energy consumption metric is first normalized. The task completion reward is defined in binary form: 1 for completion within the deadline, 0 otherwise. To ensure the reward value remains stable within the [-1, 1] interval, linear normalization is further applied during training. The weight parameters α and β are determined using a validation set search. The study sets α ∈ {0.2, 0.4, 0.6, 0.8} and β = 1 − α, and runs five experiments independently under the same training environment. The comprehensive evaluation index of task completion time, task completion rate, and system energy consumption is used as the optimization objective for parameter selection. Experimental results show that when α = 0.6 and β = 0.4, the model achieves the best balance between task completion rate and system energy consumption. If is too small, the model tends to frequently unload tasks to pursue higher task completion rates, leading to increased overall energy consumption. If is too large, the model focuses excessively on energy optimization, and some high-priority tasks cannot be completed in time. Therefore, α = 0.6 and β = 0.4 are ultimately chosen. Furthermore, to improve training stability, all reward values are smoothed using a sliding window mean, with a window length of 100 steps. During the experiment, it is observed that the average reward stabilizes after approximately 7.8 × 10⁴ steps, indicating that the designed reward function can effectively guide MADDPG to learn a reasonable task offloading strategy and promote model convergence. Based on the above design, the multi-latency, multi-agent task offloading process is shown in Figure 7.
Task offloading process
As shown in Figure 7, the terminal device first generates a batch of new computing tasks. The system then determines the dependencies and execution order between each task and its subtasks, clarifying the requirements for serial and parallel processing. Based on a preset task priority model, the platform parses the computing tasks and generates corresponding topology sequences. After task parsing, an unloading decision is made for each task, determining whether it should be executed locally or unloaded to the edge server. If a subtask needs to be unloaded, it is added to the local transmission queue, waiting to be uploaded to the edge node. Each terminal device directly connected to the edge node independently formulates an unloading strategy for each subtask through the task offloading module (using the MADDPG algorithm). After the decision is made, the terminal device executes the corresponding operation according to the unloading command. The platform then transmits the subtask data (including the task topology sequence and all data of ready subtasks) in the local transmission queue to the designated edge node according to the decision result. The edge node executes the subtasks in the computing queue in a first-in-first-out order. This process realizes dynamic scheduling and collaborative computing in multi-latency and multi-agent environments, effectively ensuring the real-time performance and stability of the MEC smart education platform in complex scenarios. The training process for the MADDPG model is as follows:
First, the study initializes the parameters of the Actor network, Critic network, and corresponding target network, and establishes an experience replay pool with a capacity of 1,000,000. The system generates unloading actions based on the current state information (using an ε-greedy strategy, with an initial exploration noise standard deviation of 0.2, a noise attenuation coefficient of 0.995, and a minimum noise standard deviation of 0.01). After executing task scheduling, it obtains the immediate reward and the state at the next time step, and stores the state transition samples in the experience pool. When the number of samples in the experience pool reaches the batch update condition, 64 samples are randomly selected for training. The Critic network uses gradient descent to minimize the temporal difference error to improve the accuracy of the value function estimation. The Actor network updates its parameters according to a deterministic strategy gradient, continuously optimizing the task offloading strategy by maximizing the long-term cumulative reward. To ensure training stability, a soft update mechanism is used to synchronize the target network parameters, with the soft update coefficient set to 0.005. The total number of training steps is set to 100,000. The network parameters are updated every 10 steps. The model is considered to have converged, and training is stopped when the maximum number of training steps of 100,000 is reached, or when the average reward change is less than 1% within 5,000 consecutive steps.
The study primarily uses task completion time, task completion rate, task failure rate, system energy consumption, and resource utilization as evaluation metrics. Task completion time is defined as the total time elapsed from task generation to completion. Task completion rate is defined as the percentage of tasks successfully completed within the deadline. Task failure rate is defined as the percentage of tasks failing to complete within the specified time. System energy consumption includes local computing energy consumption and transmission energy consumption, and resource utilization is defined as the ratio of the actual resource usage of edge nodes to the total resource capacity.
Theoretical analysis and theorem proof
To further verify the effectiveness and theoretical feasibility of the proposed multi-delay multi-agent task offloading model, the study conducted a theoretical analysis from two aspects: task delay characteristics and MADDPG policy optimization characteristics. Assumed that there are agents in the smart education platform, and each agent corresponds to a task. The total delay Di of task i consists of data transmission delay  , queuing, waiting, delay
  and calculation execution delay
  , as shown in Equation (2).
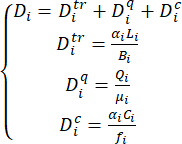 (2)
(2)
In Equation (2), Li represents the amount of input data for the task i, Bi represents the current available communication bandwidth for the task i, Qi represents the queue length of the task i in the edge node, μi represents the average service rate of the edge server for the task i, Ci represents the number of CPU computation cycles required for the task i, fi represents the edge computing resources allocated to the task i, αi and represents the task offloading ratio. Therefore, the system optimization objective can be expressed as:
 (3)
(3)
In Equation (3), Ei represents the total energy consumption of the task,  represents the latency weighting coefficient, and
  represents the energy consumption weighting coefficient.
Lemma 1: Under the condition of fixed computing resources at edge nodes, the total latency Di of task i is a convex function of its offloading ratio αi.
Proof: From equation (2), the study can obtain:
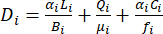 (4)
(4)
The first derivative is taken with respect to αi:
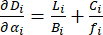 (5)
(5)
The study continues to find the second derivative:
 (6)
(6)
Since linear functions are convex functions, the total delay Di of task i is a convex function of its unloading ratio αi. Lemma 1 is thus proved.
Theorem 1: For a POMDP task offloading model with a finite state space and a finite reward function, there exists at least one optimal policy π* that maximizes the long-term cumulative reward.
Proof: Assume that the long-term cumulative discounted return of the agent is as shown in Equation (7).
 (7)
(7)
In Equation (7), Gt represents the cumulative discount reward at time t, k represents the future time step index, γ represents the discount factor, and rt+k represents the instant reward obtained at time t + k. The Bellman optimal equation is shown in Equation (8).
 (8)
(8)
In Equation (8),  represents the optimal action value function, s represents the current system state, a represents the current action,
  represents the immediate reward, s' represents the state at the next moment, a' represents the action at the next moment, and
  represents the state transition probability. The Bellman operator T(Q) is shown in Equation (9).
 (9)
(9)
In Equation (9), Q represents the action value function, represents the reward function, and represents the state transition matrix. For any two Q functions:
 (10)
(10)
Since 0 < γ < 1, the Bellman operator is a contraction mapping. According to Banach's fixed-point theorem, there exists a unique fixed point:
 (11)
(11)
Corresponding to the unique optimal strategy:
 (12)
(12)
Therefore, the optimal unloading strategy exists. Theorem 1 is proved.
Theorem 2: Under the conditions that the experience replay pool is sufficiently large, the learning rate satisfies the Robbins-Monro condition, and the target network adopts a soft update mechanism, the MADDPG policy parameters can converge to a local stable equilibrium point.
Proof: The Actor update process is shown in Equation (13).
 (13)
(13)
In Equation (13),  represents the Actor network parameters at the k-th iteration,
  represents the updated parameters, η represents the learning rate, J(θ) represents the policy objective function, and
  represents the gradient of the objective function with respect to the parameters. According to the deterministic policy gradient theorem:
 (14)
(14)
In Equation (14),  represents the mathematical expectation,
  represents the policy function with a parameter
  ,
,  represents the policy gradient,
  represents the action value function, and
  represents the gradient of the Q function with respect to the action. The target network uses soft updates:
 (15)
(15)
In Equation (15), θ represents the current network parameters, θ' represents the target network parameters, represents the soft update coefficient. According to the theory of stochastic approximation, when  and
and  , the parameter update sequence converges to the neighborhood of the stable equilibrium point. Therefore, MADDPG can gradually approximate the local optimal policy and achieve a stable task offloading decision. Theorem 2 is proved.
Model complexity analysis
The study analyzes the proposed MADDPG model from two aspects: time complexity and space complexity. Assume the number of agents is N, the number of parameters in the Actor network is PA, the number of parameters in the Critic network is PC, the number of training steps is T. For a single agent, the forward propagation complexity of the Actor network is  . The forward and backward propagation complexity of the Critic network is
  . Since there are agents in the system, the computational complexity of a single parameter update is
  . The training process involves iterations, so the overall training time complexity is
  . The study employs a fixed network structure, with the network size remaining constant during training. Therefore,
  , where c is a constant. The overall training time complexity can be further simplified to
  .
.
Assume the experience pool capacity is  , and the storage overhead of the experience pool is
  . The storage complexity of the Actor network parameters is
  , and
, and  the storage complexity of the Critic network parameters is
  . Therefore, the total space complexity is . Since the size of the experience pool is much larger than the size of the network parameters, the space complexity can be approximated as .
Therefore, the time complexity increases linearly with the number of agents N. The space complexity is mainly affected by the capacity of the experience replay pool. When training with an Intel Xeon 16-Core 3.6GHz CPU and a Tesla V100 GPU, a single complete training session takes approximately 2.4 hours, with peak memory usage of approximately 7.8GB, both below the upper limit of available resources on the experimental platform. Thus, as the number of users and the scale of tasks increase, the computational cost of the proposed model scales linearly, demonstrating good scalability and engineering-deployment feasibility, and meeting the computational needs of multi-user, multi-task, real-time offloading scenarios in smart education platforms.
While the theoretical analysis above validated the rationality of the proposed method from aspects such as task latency modeling and reinforcement learning policy optimization, certain limitations still exist. Due to the nonlinear function approximation characteristics of deep reinforcement learning models and the complex policy interactions among multiple agents, rigorously proving the global convergence and theoretical optimality of the MADDPG policy in dynamic edge computing environments remains a significant challenge. Furthermore, as the task scale and the number of agents increase, the computational complexity and scalability of the algorithm still require further systematic theoretical derivation. Therefore, this paper primarily analyzed the effectiveness of the proposed multi-latency, multi-agent task offloading strategy through mathematical modeling and experimental verification. Future research will further delve into the convergence boundary of reinforcement learning policies, theoretical analysis of complexity, and scalability in large-scale edge computing scenarios.
النتائج
Effectiveness analysis of a multi-latency multi-agent task offloading model
To verify the model's performance, a corresponding experimental environment was set up. The dataset was generated using a directed acyclic graph generator and broken into training and test sets in an 8:2 ratio. A discount factor of 0.95, a learning rate of 0.0001, and a target network update rate of 0.005 were set. A priority experience replay mechanism was adopted, with an experience pool size of 1,000,000. Training used a mini-batch approach with a batch size of 64, optimizing every 10 steps. The total number of steps was 100,000, and the experience pool sampling frequency was once per step. This study employed one-way ANOVA to compare the performance differences among different task offloading methods, and used Tukey's post-hoc test for multiple comparisons. The significance level was set at α = 0.05. A p < 0.05 was considered statistically significant. Simultaneously, 95% confidence intervals (95% CI) were calculated for the main evaluation indicators to assess the stability of the estimated results. All experiments were independently repeated 5 times, with each run using a different random seed. The final results were presented in the form of "mean ± standard deviation". The experimental hardware and software configuration is shown in Table 1.
Hardware and software environment settings
PyTorch 1.7 was used as the deep learning framework in this study. Keras 2.4.3 was used only as an auxiliary tool in the ACO and GWO baseline comparison experiments and was not involved in the training and inference of the MADDPG model. TensorFlow 2.0 was only used as a pre-installed component in the cloud node Docker image for the inference environment and was not used for the decision model implementation. All Python dependency library versions were locked using pip freeze, and the experimental environment was managed using conda 4.10.3. A complete list of all materials, tools, software, and hardware used in this study is provided in the Table of Materials.
The study first introduced ACO, GWO, DDPG, PPO, DQN, and Greedy Offloading models as comparative models and conducted tests. All comparative models were run under the same dataset, network environment, and hardware conditions. The ACO algorithm parameters were set as follows: 50 ants, pheromone evaporation coefficient of 0.3, pheromone enhancement coefficient of 1.0, heuristic factor weight of 1.0, expected heuristic factor weight of 2.0, and maximum number of iterations of 500. The optimization process used a grid search method, optimizing the combination of pheromone evaporation coefficient {0.1, 0.2, 0.3, 0.4, 0.5} and ant number {20, 30, 50, 80, 100} on the validation set, ultimately selecting the parameter combination that maximized the task completion rate. The stopping criterion was reaching the maximum number of iterations of 500, or no improvement in the optimal solution after 50 consecutive iterations. The GWO algorithm parameters were set as follows: wolf pack size of 50, maximum number of iterations of 500, and convergence parameter linearly decreasing from 2 to 0. The optimization process employed a random search method, seeking optimal wolf pack sizes {20, 30, 50, 80, 100} and initial convergence parameters {1.5, 2.0, 2.5} to minimize task completion time. The stopping criterion was reaching the maximum number of iterations (500) or the global optimum changing less than 1e-6 times over 30 consecutive iterations. The PPO used an Actor-Critic structure, with both the policy and value networks being two-layer fully connected networks (64 neurons per layer), using ReLU activation, a learning rate of 0.0003, a discount factor of 0.99, a pruning parameter of 0.2, an experience replay pool capacity of 100,000, a training batch size of 64, a maximum training step count of 50,000, and a stopping criterion of no significant improvement in the policy objective after 1000 consecutive steps. DQN employed a two-layer fully connected network with an experience replay pool capacity of 100,000, a learning rate of 0.001, a discount factor of 0.99, and an ε-greedy policy with an initial ε of 1.0 linearly decreasing to 0.1.
The minimum batch size was 64, the maximum training steps were 50,000, and the stopping criterion was training convergence or the task completion rate no longer improving. Greedy Offloading selected the offloading node with the highest immediate benefit based on available computing resources and link status, without long-term policy optimization. When node resources were insufficient or network bandwidth limitations prevented the task from being met, the task was placed in a waiting queue for continued round-robin scheduling. The DDPG algorithm used the same parameter settings as MADDPG, but retained only the single-agent structure. Each experiment was run independently 5 times, and the average result was used as the performance metric. The test results of task completion time and energy consumption for different models are shown in Figure 8.
Task completion time and energy consumption test results
The compared methods include MADDPG (This work), PPO, DQN, DDPG, ACO, GWO, and Greedy Offloading. The number of tasks varies from 10 to 50. Experimental conditions are identical for all methods: 6 edge nodes, bandwidth of 10–100 Mbps, network latency of 5–50 ms, and identical hardware configurations.
In Figure 8A, the differences in completion time were minimal under low task loads. However, as the number of tasks gradually increased, the time efficiency of the model was improved, and the resource contention and uneven load in ACO and GWO under a multi-task concurrent environment were alleviated. DDPG improved learning through experience replay, but its single-agent architecture struggled to handle complex concurrent scheduling, leading to longer completion times. When the number of tasks reached 50, the research model's task completion time was 16.2 ± 0.4s; the PPO, DQN, DDPG, ACO, GWO, and Greedy Offloading models were 18.3 ± 0.5s, 20.1 ± 0.7s, 22.4 ± 0.8s, 23.8 ± 0.9s, 25.5 ± 1.1s, and 27.2 ± 1.3s, respectively. The results of one-way ANOVA showed that the differences between the models were statistically significant (p < 0.05). Figure 8B shows that the energy consumption of the research model increased more gradually with the number of tasks. When the number of tasks reached 50, the energy consumption of the research model was 0.95 ± 0.03 J; the energy consumption of PPO, DQN, DDPG, ACO, GWO, and Greedy Offloading models was 1.03 ± 0.03 J, 1.08 ± 0.02 J, 1.12 ± 0.01 J, 1.24 ± 0.04 J, 1.36 ± 0.03 J, and 1.42 ± 0.02 J, respectively. The results of one-way ANOVA showed that the differences between the models were statistically significant (p < 0.05). This indicated that the research model maintained low energy consumption by reducing redundant computation and transmission.
The number of edge nodes was set to 6, and tests were conducted with 10 and 60 users to further validate the effectiveness of the developed model. The evaluation metric was the task completion rate, and the results are shown in Figure 9.
Task completion rate test results
The task completion rate is defined as the percentage of tasks completed before their deadlines. All methods are tested using the same dataset and network environment. Six edge nodes are deployed in all experiments. Figure 9A–B shows a comparison of task completion rates for different models with varying numbers of users. In a lightly-loaded scenario with 10 users, the task completion rate of the research model was 99.2% ± 0.3%, outperforming PPO (98.1% ± 0.4%), DQN (97.2% ± 0.6%), DDPG (96.5% ± 0.7%), ACO (94.7% ± 0.9%), GWO (91.8% ± 1.1%) and Greedy Offloading models (88.9% ± 1.3%), p < 0.05. This was attributed to the efficient scheduling of edge computing resources by the centralized training-distributed execution architecture. Through the priority experience replay mechanism, task conflicts and queuing delays were reduced, and scheduling stability was improved. With 60 users, the system load and scheduling complexity increased significantly. The task completion rate of the research model remained at 96.8% ± 0.7%, while the completion rates of the comparison models dropped to 94.9% ± 0.7%, 92.7% ± 0.9%, 90.1% ± 0.5%, 88.6% ± 1.0%, 84.3 ± 0.8%, and 81.5 ± 0.6%, respectively, p < 0.05, showing a more significant downward trend. The research model could adapt to the needs of users of different sizes and had strong scalability.
The robustness of the model under different network conditions was validated by a network latency sensitivity experiment. The experiment was set with a bandwidth of 50 Mbps, latencies of 5, 10, 25, and 50 ms, 20 users, and 6 edge nodes. The task execution failure rate and resource utilization were used for evaluation, and the results are shown in Figure 10.
Network latency sensitivity test results
Network latency varies from 5 ms to 50 ms while bandwidth is fixed at 50 Mbps. The number of users is 20, and the number of edge nodes is 6. Task failure rate refers to the percentage of tasks that fail to meet deadline requirements. Resource utilization denotes the ratio of occupied edge resources to total available resources. Figure 10 shows the task execution failure rate (Figure 10A) and resource utilization (Figure 10B) under different network latencies. As latency increased, the failure rate of all models rose, but the research model consistently performed best. At latencies of 5ms, 25ms, and 50ms, the failure rates of the research model were 2.4% ± 0.2%, 4.7% ± 0.5%, and 6.8% ± 0.4%, respectively. In contrast, at a 50 ms latency, the failure rates of the PPO, DQN, DDPG, ACO, GWO, and Greedy Offloading models were as high as 7.9% ± 0.1%, 8.8% ± 0.5%, 10.2% ± 0.2%, 12.1% ± 0.3%, 13.4% ± 0.2%, and 15.2% ± 0.6%, respectively. In Figure 10B, the resource utilization of all models decreased with increasing network latency, but the research model consistently outperformed the other comparative models. When the network latency was 50ms, the resource utilization rate of the proposed model reached 89.2%, which was significantly higher than that of PPO (86.5% ± 0.6%), DQN (84.1% ± 1.1%), DDPG (82.3% ± 1.5%), ACO (75.4% ± 0.8%), GWO (71.2% ± 1.4%) and Greedy Offloading (68.7% ± 0.7%). The experimental results showed that, under the set network latency range (5–50 ms), bandwidth range (10–100 Mbps), and edge computing configuration conditions, the proposed model exhibited relatively stable performance in multi-latency task offloading scenarios and had a certain degree of adaptability to network changes within the tested range.
Performance analysis of MEC-Based smart education platform
This study conducted simulation tests on the smart education platform to verify its performance in real-world teaching scenarios. The experimental configuration consisted of 10 terminal devices, 1 cloud node, and 6 edge nodes. Six Nvidia Jetson Xavier NX processors served as the primary computing units, and four Raspberry Pi 5 processors served as auxiliary terminals. Real-time video analytics, interactive feedback processing, and task offloading decisions were the test scenarios. Task offloading was simulated under different network loads and device performance conditions to verify the accuracy and effectiveness of the platform in task allocation and offloading decisions. Low, medium, and high load conditions were set, and offloading tests were conducted in conjunction with video stream processing and real-time interactive feedback tasks. In the experimental setup, the specific parameters for the load conditions were defined as follows: Low-load scenario: 10 system users, 10 terminal devices, and 6 edge nodes. With a low task arrival rate (average 2–3 tasks/s), task types mainly consisted of single video stream processing and basic question-and-answer. Network bandwidth was set at 20 Mbps, link latency was at 5 ms, packet loss rate at 0.1%, with average task computation requirement at 500–2000 Mcycles. Medium-load scenario: System users expanded to 30, with 15 terminal devices. Task arrival rate increased to 5-8 tasks/s, mixed task types (video analysis, real-time question-and-answer, and classroom interaction coexist). network bandwidth was set at 50 Mbps, link latency at 10 ms, packet loss rate at 0.3%, and task computation requirement at 1000–4000 Mcycles. High-load scenario: The number of system users increased to 60, with 20 terminal devices. The task arrival rate reached 10–15 tasks/s. The task types included a high proportion of video analysis and concurrent interactive tasks. The network bandwidth was set to 100 Mbps, the link latency was 25 ms, the packet loss rate was 0.5%, the task computation requirement was 2,000–6,000 Mcycles, and there was a significant queuing effect. All of the above load conditions were constructed by controlling the task generator parameters (number of nodes, dependency density, task arrival interval, and resource requirement distribution) to ensure the repeatability and controllability of the system state under different load levels. Each load condition (low/medium/high) was independently repeated 5 times, and the results were averaged, and the standard deviation was reported. The results are shown in Figure 11.
Effectiveness test of task allocation and unloading decisions
Low-load condition: 10 users, 10 terminal devices, 6 edge nodes, task arrival rate 2–3 tasks/s, bandwidth 20 Mbps, latency 5 ms. Medium-load condition: 30 users, 15 terminal devices, task arrival rate 5–8 tasks/s, bandwidth 50 Mbps, latency 10 ms. High-load condition: 60 users, 20 terminal devices, task arrival rate 10–15 tasks/s, bandwidth 100 Mbps, latency 25 ms. Results are averaged over five independent experiments.
In Figure 11A–C, under low load, with a network bandwidth of 20 Mbps and a latency of 5 ms, the offloading success rate reached 99.0% ± 0.2%. Under medium load, with bandwidth increasing to 50 Mbps and latency of 10 ms, the success rate was 95.0% ± 0.5%. Under high load, with bandwidth reaching 100 Mbps, latency increased to 25 ms, and the success rate dropped to 85.0% ± 0.8%. Under low and medium load conditions, the platform exhibited a high offloading success rate, low latency, and stable bandwidth consumption, effectively ensuring the real-time performance and accuracy of teaching tasks. Performance decreased under high load, but the decrease in offloading success rate was relatively slow, indicating that the platform had a certain degree of scalability and robustness.
Subsequently, to test the scalability of the platform, the number of edge nodes was increased from 6 to 12, and the number of terminal devices was increased to 20. Different user needs and task types were simulated to test the response capability and task scheduling effect when faced with a large number of concurrent requests, as shown in Table 2.
Extensibility test results
Edge nodes: The number of edge computing servers deployed in the system. Terminal devices: The number of terminal devices connected to the system. Users: The number of concurrent users online in the system. Task scheduling delay: The average time a task takes from entering the system to being assigned to a specific execution node. Task execution priority processing time: The average time required for the system to make scheduling and execution decisions for high-priority tasks.
System throughput: The number of tasks successfully completed by the system per unit time. Network traffic distribution balance: Measures the balance of task and network traffic distribution among edge nodes; a higher value indicates a more even load distribution. High-priority task completion rate: The percentage of high-priority tasks successfully completed within the deadline. Task migration success rate: The percentage of tasks successfully migrated from terminals or edge nodes and completed scheduling and execution on the target node; used to measure the reliability of cross-node offloading and scheduling.
Table 2 shows how adding edge nodes and terminal devices alters the platform's Task Scheduling Latency (TSL), task execution priority processing time, and system throughput. When the number of edge nodes was fixed at 6, and the number of terminal devices increased from 10 to 20, the TSL increased from 75 ms to 110 ms, the task execution priority processing time increased from 30 ms to 45 ms, and the system throughput decreased from 5.2 tasks/s to 4.5 tasks/s. This trend indicates that the platform's processing capacity decreased to some extent when the terminal load increased. Network traffic distribution balance decreased with the increase in the number of terminal devices (from 92% to 83%), but when the number of edge nodes increased from 6 to 12, even under a high load of 20 terminal devices, the TSL still improved from 110 ms to 95 ms. The system throughput recovered from 4.5 tasks/s to 5.2 tasks/s, and the network traffic distribution balance also increased from 83% to 85%. This demonstrated that increasing the number of edge nodes could effectively mitigate the performance degradation caused by the increase in terminal devices. Overall, the platform maintained basic performance and stability during expansion, but key metrics such as TSL and throughput showed a declining trend as terminal load increased. Therefore, further optimization of task scheduling and resource allocation strategies was needed to handle higher concurrent loads during larger-scale deployments.
To evaluate the platform's optimization capabilities during resource scheduling, multiple educational applications (such as video analytics, real-time question answering, and interactive assessment) were simulated to observe how edge computing and cloud computing resources were effectively allocated. The test results are shown in Table 3.
Resource scheduling and optimization test results
Concurrent tasks: The number of tasks executed simultaneously by the system within the same time period. Edge computing resource allocation ratio: The percentage of computing resources allocated to edge nodes. Cloud computing resource allocation ratio: The percentage of computing resources allocated to the cloud. Average task completion time: The average time from task submission to completion. CPU utilization: The average utilization rate of computing resources on edge nodes. Task drop rate: The percentage of tasks that are not completed due to insufficient resources, queuing timeouts, or scheduling failures.
In Table 3, the system dynamically coordinated edge and cloud resources based on task type. For latency-sensitive tasks, the edge resource allocation was increased to 70%-90%, with the average task completion time controlled between 65ms and 80ms. For computationally intensive tasks, edge allocation could reach 85% when resources were sufficient. When concurrent tasks increased to 20, this was reduced to 80%, alleviating edge pressure through cloud-based load balancing. At this point, the task completion time increased from 120ms to 150ms, but the drop rate remained below 1.5%. Furthermore, in most test scenarios, the platform's CPU utilization remained within a reasonable and efficient range of 60% to 80%, indicating that the resource scheduling strategy could make full use of edge computing resources while avoiding performance degradation caused by node overload. This demonstrated that the platform could flexibly allocate resources based on task characteristics, load, and network status, ensuring both low latency and high success rate for core teaching tasks while achieving overall resource balance.
To verify the effectiveness of the proposed multi-latency, multi-agent task offloading scheme based on MEC and MADDPG in real-world smart education scenarios, this study used real classroom data from the fall semester of 2024 on an online teaching platform of a university for backtesting. Test scenarios included: a live-streamed class with 300 students participating simultaneously (including real-time interactive comments and in-class quizzes), a recorded course with 200 students watching (including knowledge point retrieval and exercise push), and classroom analysis tasks for 100 teachers (including student attention recognition and classroom quality assessment). Task types covered video stream processing, natural language question answering, image recognition, and database queries. Reported results were aggregated as mean values across all runs. The results are shown in Figure 12.
Real education platform deployment test results
The proposed MADDPG-based task offloading method is compared with the university platform's original round-robin scheduling scheme. The experiment is based on five days of historical operational logs containing approximately 187,000 task requests. Task categories include video streaming, question answering, image recognition, database queries, and mixed workloads. Response latency is measured in milliseconds (ms), and completion rate is reported as a percentage (%).
As shown in Figure 12A, the task response latency of the research method was concentrated in the 50–100 ms range, with very few outliers. In contrast, the original scheme's latency distribution was more dispersed, with a large number of sampling points in the 100–200 ms range, and significant outliers exceeding 250 ms, indicating a serious task backlog problem during high-concurrency periods. Figure 12B shows that the overall success rate of the research method was 96.7%, with 94.2% for video stream tasks, 98.5% for question-answering tasks, 95.1% for image recognition, 97.3% for database queries, and 95.8% for mixed tasks. The original scheme's overall success rate was only 81.3%, with a lower rate of 73.6% in video stream processing tasks. Practical application experiments showed that the research method could effectively address high concurrency and multi-type task offloading requirements in real smart education scenarios and was significantly better than the original solution in both latency control and task completion rate.
DATA AVAILABILITY:
The raw simulation datasets, experimental configuration files, and source code used in this study are provided as supplementary materials. All the files are included in the folder called “Raw data”
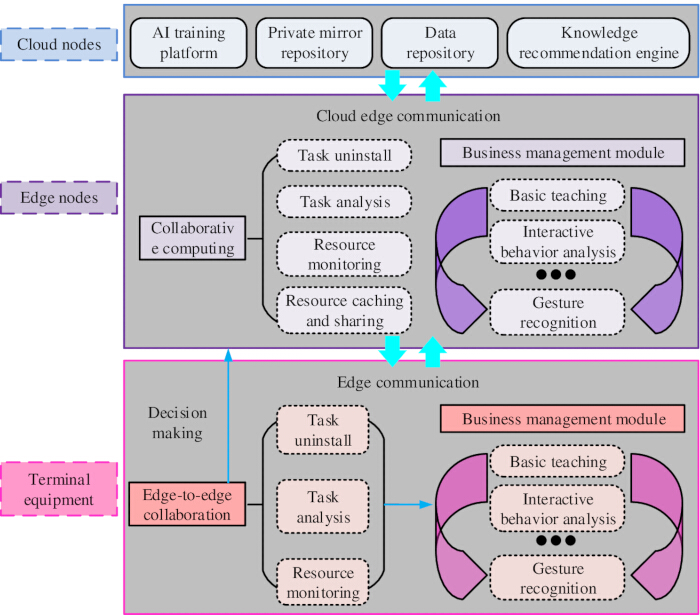
Figure 1: Overall architecture of the smart education platform. The architecture consists of cloud nodes, edge nodes, and terminal devices, enabling cloud-edge-terminal collaborative computing for real-time educational applications. Please click here to view a larger version of this figure.
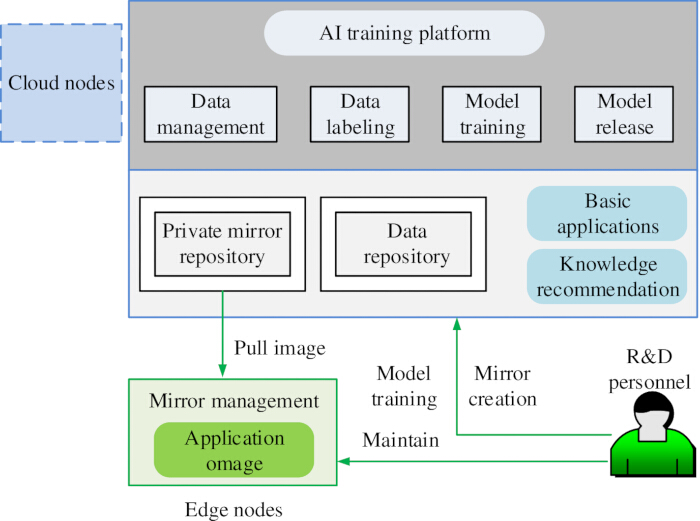
Figure 2: Cloud node architecture. The cloud layer integrates AI training platforms, private image repositories, data storage systems, and knowledge recommendation engines to support model deployment, resource management, and intelligent educational services. Please click here to view a larger version of this figure.
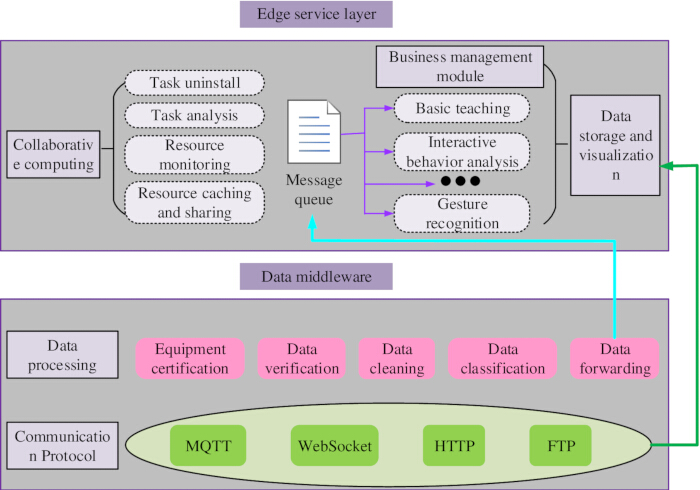
Figure 3: Edge node architecture. The edge layer contains data middleware and edge service modules, including authentication, data processing, collaborative computing, messaging, resource monitoring, and visualization. Please click here to view a larger version of this figure.
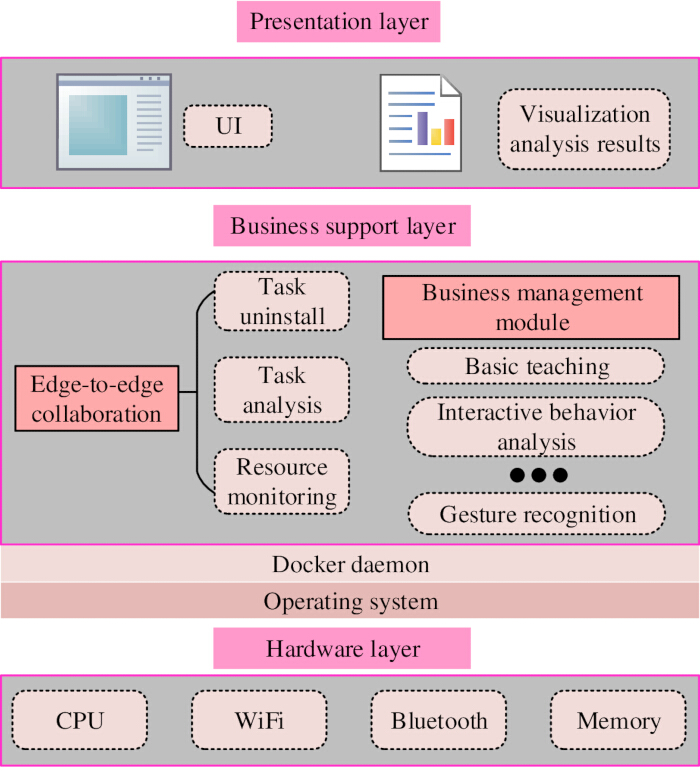
Figure 4: Terminal device architecture. The terminal layer consists of hardware, service support, and user interaction modules, providing local computation, communication, and task offloading interfaces. Please click here to view a larger version of this figure.
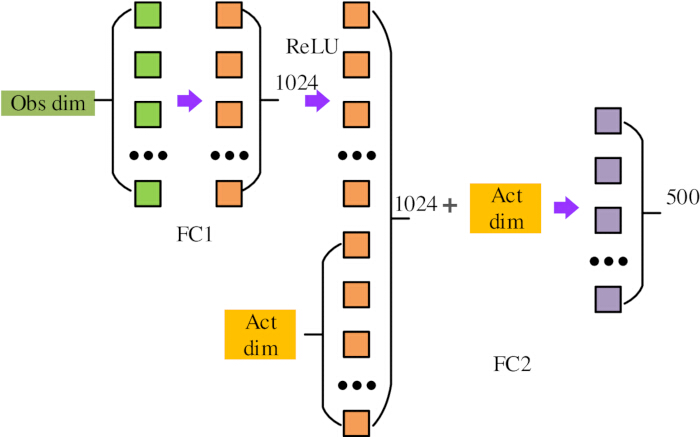
Figure 5: Actor network structure. The Actor network adopts a fully connected architecture to process local observations and generate continuous offloading actions within the range of [0,1]. Please click here to view a larger version of this figure.
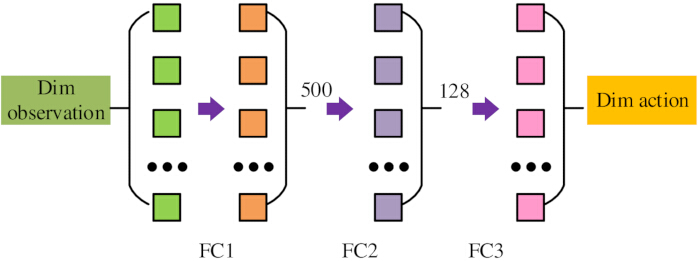
Figure 6: Critic network structure. The Critic network evaluates joint states and actions from multiple agents and estimates the global Q-value to guide policy optimization during centralized training. Please click here to view a larger version of this figure.
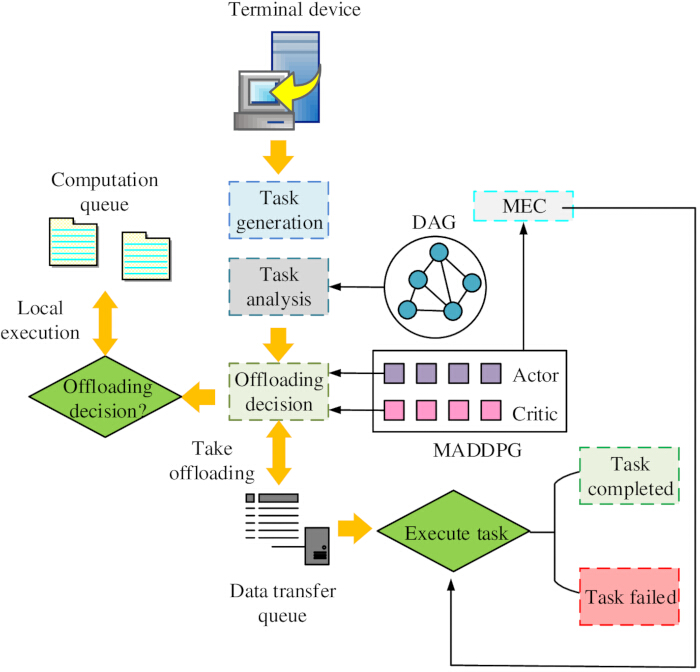
Figure 7: Task offloading process. The workflow includes task generation, DAG dependency analysis, ready-task identification, continuous offloading decision, data transmission, edge execution, and MADDPG policy optimization. Please click here to view a larger version of this figure.
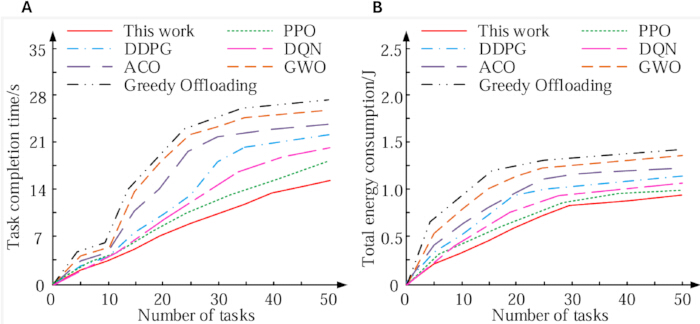
Figure 8: Task completion time and energy consumption test results. (A) Average task completion time versus number of tasks. (B) Average system energy consumption versus number of tasks. The compared methods include MADDPG (This work), PPO, DQN, DDPG, ACO, GWO, and Greedy Offloading. The number of tasks varies from 10 to 50. Experimental conditions are identical for all methods: 6 edge nodes, bandwidth of 10–100 Mbps, network latency of 5–50 ms, and identical hardware configurations. Please click here to view a larger version of this figure.
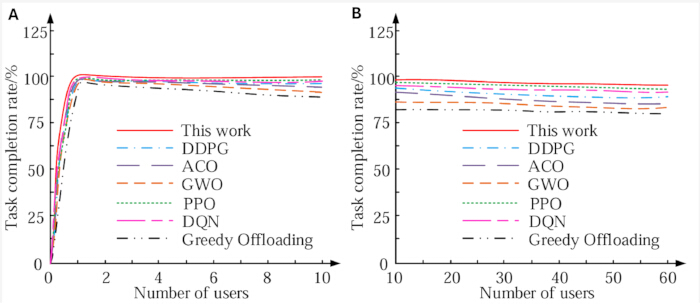
Figure 9: Task completion rate test results. (A) Task completion rate when the number of users is 10. (B) Task completion rate when the number of users is 60. The task completion rate is defined as the percentage of tasks completed before their deadlines. All methods are tested using the same dataset and network environment. Six edge nodes are deployed in all experiments. Please click here to view a larger version of this figure.
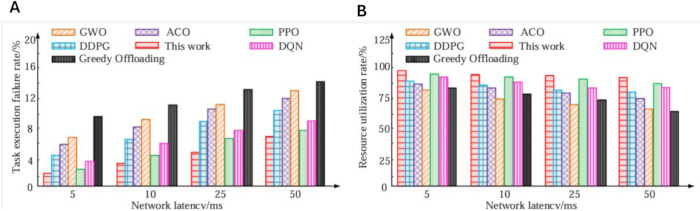
Figure 10: Network latency sensitivity test results. (A) Task failure rate under different network latency conditions. (B) Resource utilization under different network latency conditions. Network latency varies from 5 ms to 50 ms while bandwidth is fixed at 50 Mbps. The number of users is 20, and the number of edge nodes is 6. Task failure rate refers to the percentage of tasks that fail to meet deadline requirements. Resource utilization denotes the ratio of occupied edge resources to total available resources. Please click here to view a larger version of this figure.
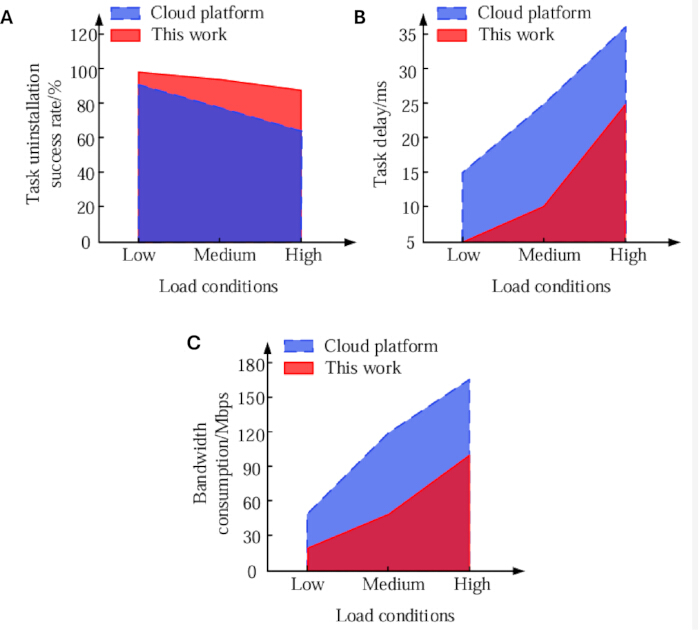
Figure 11: Effectiveness test of task allocation and unloading decisions. (A) Task offloading success rate. (B) Average task latency. (C) Bandwidth consumption. Low-load condition: 10 users, 10 terminal devices, 6 edge nodes, task arrival rate 2–3 tasks/s, bandwidth 20 Mbps, latency 5 ms. Medium-load condition: 30 users, 15 terminal devices, task arrival rate 5–8 tasks/s, bandwidth 50 Mbps, latency 10 ms. High-load condition: 60 users, 20 terminal devices, task arrival rate 10–15 tasks/s, bandwidth 100 Mbps, latency 25 ms. Results are averaged over five independent experiments. Please click here to view a larger version of this figure.
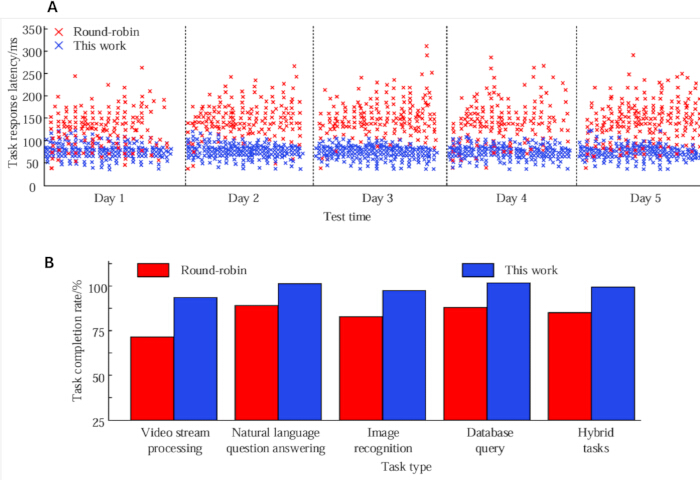
Figure 12: Real education platform deployment test results. (A) Distribution of task response latency. (B) Comparison of task completion rates for different task categories. The proposed MADDPG-based task offloading method is compared with the original round-robin scheduling scheme used by the university platform. The experiment is based on five days of historical operational logs containing approximately 187,000 task requests. Task categories include video streaming, question answering, image recognition, database queries, and mixed workloads. Response latency is measured in milliseconds (ms), and completion rate is reported as a percentage (%). Please click here to view a larger version of this figure.
| Environment | Settings |
| Processor | Intel Xeon 16-Core 3.6GHz CPU |
| RAM | 64GB DDR4 |
| Storage | 2TB SSD (Samsung 970 Evo Plus) |
| GPU | NVIDIA Tesla V100 32GB |
| Operating System | Ubuntu 20.04 LTS |
| Framework | PyTorch 1.7 |
| Python Version | Python 3.8 |
| Libraries | NumPy 1.19.5, SciPy 1.5.4, Keras 2.4.3, Matplotlib 3.3.4, OpenAI Gym 0.18.0 |
| Network Simulation | WANem Network Emulator |
| Network Bandwidth | 10–100 Mbps |
| Network Latency | 5–50 ms (variable latency) |
Table 1: Hardware and software environment settings. The experimental platform consists of an Intel Xeon 16-Core 3.6 GHz CPU, 64 GB DDR4 RAM, NVIDIA Tesla V100 32 GB GPU, Ubuntu 20.04 LTS operating system, and PyTorch 1.7 framework. The network simulation environment is constructed using WANem 3.0 with bandwidth ranging from 10 to 100 Mbps and latency varying from 5 to 50 ms.
| Number of edge nodes | Number of terminal devices | Number of users | TSL/ms | Task execution priority processing time/ms | System throughput/tasks/s | Network traffic distribution balance/% | High priority task completion rate/% | Task migration success rate/% |
| 6 | 10 | 20 | 75 | 30 | 5.2 | 92 | 97 | 99 |
| 6 | 15 | 20 | 95 | 40 | 4.8 | 87 | 94 | 97 |
| 6 | 20 | 20 | 110 | 45 | 4.5 | 83 | 90 | 94 |
| 8 | 10 | 20 | 70 | 28 | 5.5 | 94 | 98 | 99 |
| 8 | 15 | 20 | 85 | 38 | 5 | 89 | 95 | 97 |
| 8 | 20 | 20 | 100 | 42 | 4.7 | 85 | 92 | 94 |
| 10 | 10 | 20 | 60 | 25 | 5.8 | 91 | 99 | 99 |
| 10 | 15 | 20 | 80 | 35 | 5.4 | 86 | 96 | 97 |
| 10 | 20 | 20 | 100 | 45 | 4.8 | 83 | 93 | 94 |
| 12 | 10 | 20 | 55 | 22 | 6 | 95 | 99 | 99 |
| 12 | 15 | 20 | 75 | 32 | 5.7 | 90 | 97 | 98 |
| 12 | 20 | 20 | 95 | 42 | 5.2 | 85 | 94 | 96 |
Table 2: Extensibility test results. The experiment evaluates system performance with different numbers of edge nodes and terminal devices. Metrics include task scheduling delay, task execution priority processing time, system throughput, network traffic distribution balance, high-priority task completion rate, and task migration success rate. The results demonstrate the platform’s scalability under different user and resource configurations.
| Task types | Number of concurrent tasks | Edge computing resource allocation ratio/% | Cloud computing resource allocation ratio/% | Average task completion time/ms | CPU utilization/% | Task drop rate/% |
| Video analysis | 10 | 85 | 15 | 120 | 65 | 0.5 |
| Real-time Q&A | 20 | 70 | 30 | 65 | 60 | 0.3 |
| Interactive assessment | 15 | 80 | 20 | 90 | 62 | 0.4 |
| Video analysis | 20 | 80 | 20 | 150 | 70 | 1.2 |
| Real-time Q&A | 30 | 65 | 35 | 80 | 68 | 0.8 |
| Interactive assessment | 25 | 75 | 25 | 110 | 72 | 1 |
| Mixed tasks (balanced) | 40 | 75 | 25 | 95 | 68 | 0.6 |
| Hybrid tasks (video-intensive) | 35 | 82 | 18 | 130 | 75 | 1.5 |
| Hybrid tasks (interaction-intensive) | 45 | 68 | 32 | 85 | 65 | 0.7 |
| Peak load scenarios | 60 | 72 | 28 | 115 | 80 | 2 |
| High-priority task assurance | 15 | 90 | 10 | 70 | 70 | 0.2 |
| Low priority background tasks | 25 | 60 | 40 | 200 | 60 | 3 |
Table 3: Resource scheduling and optimization test results. The experiment evaluates resource allocation performance for video analysis, real-time question answering, interactive assessment, mixed workloads, and peak-load scenarios. The table reports concurrent task numbers, edge/cloud resource allocation ratios, average task completion time, CPU utilization, and task drop rate to demonstrate adaptive resource scheduling capability.
المناقشة
To verify the effectiveness and advancement of the proposed multi-latency multi-agent task offloading scheme based on MEC and MADDPG, the study analyzed and discussed it from three aspects: task execution efficiency, resource allocation capability, and network environment adaptability. In terms of task execution efficiency, traditional heuristic algorithms (such as ACO) could guarantee a certain task completion rate, but as the task scale increased, their search efficiency and global optimization ability would gradually decrease, and resource competition would intensify, and task scheduling imbalance would easily occur. In contrast, the proposed model effectively reduced task conflicts and resource contention and improved scheduling and offloading efficiency through centralized training and distributed execution. When the number of tasks increased to 50, the task completion time of the research model was only 16.2 s, which further verified the view proposed by research4: In the multi-agent collaborative environment with uneven resource allocation, deep reinforcement learning could significantly improve the efficiency of the platform in multi-task scheduling.
In terms of resource allocation, the deep reinforcement learning resource allocation method proposed by research14 mainly adopted a single agent architecture for resource scheduling. Although this method could optimize resource utilization, it was difficult to fully describe the dynamic interaction relationship between different tasks when multiple users competed for edge resources at the same time. The method in this paper adopted a multi-agent architecture, with each computing task corresponding to one agent, which could capture the resource competition relationship between different tasks more precisely. Experimental results showed that when the number of users increased from 10 to 60, the task completion rate of the model in this paper only decreased from 99.2% to 96.8%, and the performance decline was significantly smaller than that of the DDPG model, indicating that the multi-agent collaborative mechanism could effectively improve the stability of the system in a high-concurrency environment. In addition, a research group31 proposed a multi-user computation unloading method of edge computing based on improved Pelican optimization control strategy for smart city scenarios. Although this method was also aimed at the multi-user task offloading problem, its optimization process mainly relied on the metaheuristic search mechanism, which made it difficult to update the decision strategy in real time according to the changes in the environmental state. The proposed method utilized feedback information from the MADDPG continuous learning environment and supported offloading ratio decisions in a continuous action space, enabling tasks to be executed entirely locally or partially offloaded to edge nodes, thus achieving more granular resource scheduling and task splitting.
Regarding system energy consumption and network adaptability, the model in this paper effectively reduced unnecessary data transmission and redundant computation by rationally allocating resources and optimizing offloading decisions. When the number of tasks reached 50, the total system energy consumption was only 0.95 J. The network latency sensitivity test showed that as the latency increased, the task failure rate of each model increased, but the failure rate of the research model was only 6.8% when the latency was 50 ms, which showed strong robustness and could adapt to the task offloading requirements under different network environments.
Existing research shows that the performance of edge computing systems is not only limited by computing resources but also affected by network transmission and service coordination capabilities. A research group32 combines edge caching with optimization strategies for the content distribution scenario of vehicle networking, and enhances the reliability of network services by improving content distribution efficiency, indicating that edge resource coordination plays an important role in improving dynamic network service capabilities. A research group33 further utilizes reinforcement learning strategies to optimize UAV-assisted vehicle networking edge routing and improve the data transmission adaptability in complex network environments by dynamically adjusting routing decisions. Unlike the above studies that mainly focus on edge caching and network routing optimization, this paper further focuses on the intelligent education computing task offloading scenario, and incorporates transmission latency, computing latency and queuing latency into the decision-making process, and realizes collaborative optimization among multi-task agents through MADDPG, so that the system can not only adapt to changes in network state, but also dynamically adjust the offloading strategy according to the task computing requirements.
From a practical deployment perspective, the multi-latency, multi-agent task offloading solution based on MEC and MADDPG has good engineering application potential. In smart education platforms, online live classes, virtual experiments, real-time quizzes, and multimedia resource distribution all generate a large number of concurrent computing tasks. Since MEC nodes are deployed on the campus edge network, they can complete some computing tasks closer to users, effectively reducing the pressure on cloud servers and reducing task response latency. For smart teaching scenarios in universities, this solution can be directly deployed on campus edge servers, teaching resource centers, or regional education cloud platforms. By collecting user terminal status, network status, and edge node load information in real time, it dynamically generates task offloading decisions, thereby improving the service quality of teaching services. In addition, the system still has good scalability in larger-scale edge computing environments. MADDPG adopts a centralized training and distributed execution mechanism. During the training phase, it uses a central Critic network to learn global environmental information, while during the execution phase, each agent can make decisions based only on local observations. Therefore, the online inference overhead does not significantly increase with the number of edge nodes. When the system expands from a single campus to a multi-campus collaborative scenario, or the user base grows from dozens to hundreds or even thousands, training complexity can be reduced by increasing the number of edge nodes, building a hierarchical MEC architecture, and adopting a parameter sharing mechanism. Meanwhile, since task offloading decisions are primarily made at the edge, the cloud only handles model updates and global management, which helps improve the system's horizontal scalability.
However, the research still had certain limitations. Although the experiments combined simulation data and real smart education platform data for verification, the model training was mainly based on datasets generated from directed acyclic graphs, which still differed from the bursty and periodic task traffic in actual teaching scenarios and required further verification. Secondly, the task parameters used in the study mainly covered typical application scenarios in smart education platforms such as video stream processing, real-time question answering, classroom analysis, and database querying. Its applicability to ultra-high computational load scenarios such as virtual reality teaching, digital twin laboratories, and large-scale programming training still needed further investigation. Finally, the study conducted multi-user tests in both simulation environments and real teaching platform scenarios, verifying the system's performance under conditions of hundreds of users online simultaneously. However, as smart education platforms expanded to cross-campus, cross-regional, and massively open online courses (MOOCs), the user scale might reach thousands or even tens of thousands. Although the time complexity of the proposed MADDPG task offloading model was linearly related to the number of agents and had good theoretical scalability, under ultra-large-scale deployment conditions, experience replay pool management, model training overhead, and edge node collaborative scheduling mechanisms might still become system performance bottlenecks. Therefore, in the future, federated learning, hierarchical reinforcement learning, and model lightweighting techniques could be combined to further improve the system's deployment capabilities and operational efficiency in ultra-large-scale edge computing environments.
الإفصاحات
The authors declare no conflicts of interest.
شكر وتقدير
The research is supported by: Jilin province higher education scientific research topic, Research on the construction of quality assurance system for innovative talents training in colleges and universities, (NO. JGJX24D1060); Scientific Research Project of Jilin Provincial Department of Education, "Research on the Evaluation of Teacher Ethics Cultivation for Students Majoring in Preschool Education in Applied Undergraduate Programs", (NO. JJKH20260718SK); A project of the "14th Five-Year Plan" of Jilin Provincial Education Science in 2025. Research on the Cultivation Model of Top-notch Innovative Skilled Talents in Vocational Undergraduate Colleges, (NO. GH25712); Jilin Provincial Primary and Secondary School Teaching Research Association, "15th Five-Year Plan" 2026 Annual Project, Research on the Integration of Study Travel, School Curriculum and Labor Education in Primary and Secondary Schools from the Perspective of Jilin Regional Culture, (NO. YJKT2026-0913), funded June 2026; Jilin Provincial Vocational and Adult Education Teaching Reform Research Project, Research on the Comprehensive Education Model of "Post-Course-Competition-Certificate" Integrating Intangible Cultural Heritage Skills into Vocational Colleges, funded April 2026.
المواد
| الاسم | الشركة | رقم فهرسي | التعليقات |
|---|---|---|---|
| Conda | 4.10.3 | Anaconda Inc. | Python environment management |
| CUDA | 11 | NVIDIA Corporation | GPU acceleration for model training |
| DAG Generator | Custom implementation | Developed in this study | Generation of task topologies and task datasets |
| Docker Engine | 20.1 | Docker Inc. | Container deployment and service management |
| Docker Compose | 2.2 | Docker Inc. | Multi-container orchestration |
| EMQX | 5 | EMQ Technologies | MQTT message middleware |
| Grafana | 9 | Grafana Labs | System monitoring and visualization |
| Harbor | 2.5 | CNCF Project | Private container image repository |
| Jenkins | Latest stable release | Jenkins Project | CI/CD pipeline management |
| Keras | 2.4.3 | Auxiliary implementation of baseline algorithms | |
| Matplotlib | 3.3.4 | Matplotlib Development Team | Figure generation and visualization |
| MinIO | RELEASE version used during experiments | MinIO Inc. | Distributed object storage |
| NumPy | 1.19.5 | NumPy Developers | Numerical computation |
| OpenAI Gym | 0.18.0 | OpenAI | Reinforcement-learning environment construction |
| Prometheus | 2.x | Prometheus Authors | Resource monitoring and metric collection |
| Pushgateway | 1.x | Prometheus Authors | Metric aggregation |
| PyTorch | 1.7 | Meta AI | MADDPG model implementation and training |
| Python | 3.8 | Python Software Foundation | Development language |
| RabbitMQ | 3.9 | VMware | Message queue service |
| Redis | 6.2 | Redis Ltd. | Caching and data storage |
| Samsung 970 Evo Plus SSD | 2 TB | Samsung Electronics | Experimental data storage |
| SciPy | 1.5.4 | SciPy Community | Statistical analysis |
| TensorFlow | 2 | Cloud-side inference environment | |
| Tesla V100 GPU | 32 GB | NVIDIA Corporation | Deep-learning model training |
| Ubuntu Linux | 20.04 LTS | Canonical Ltd. | Operating system |
| WANem | 3 | IIT Bombay | Network emulation and latency simulation |
المراجع
- Badshah A et al. Towards smart education through internet of things: a survey. ACM Comput Surv. 2023;56(2):1-33.
- He W, Yan JL, Liu HX, Hu XY. Research on the rural teachers’ constant usage willingness toward the national smart education platform for primary and secondary schools from the perspective of digital transformation. Mod Educ Technol. 2024;34(8):59-68.
- Ma R, Chen X. Intelligent education evaluation mechanism on ideology and politics with 5G: PSO-driven edge computing approach. Wirel Netw. 2023;29(2):685-696.
- Wang Y, Wang W, Lau VK, Nakachi T, Zhang Z. Stochastic resource allocation and delay analysis for mobile edge computing systems. IEEE Trans Commun. 2023;71(7):4018-4033.
- Dai Z, Zhang Q, Zhao L, Zhu X, Zhou D. Cloud-edge computing technology-based internet of things system for smart classroom environment. Int J Emerg Technol Learn. 2023;18(8):79-96.
- Bing Z, Wang X, Dong Z, Dong L, He T. A novel edge computing architecture for intelligent coal mining system. Wirel Netw. 2023;29(4):1545-1554.
- Cárdenas R, Arroba P, Risco-Martín JL, Moya JM. Modeling and simulation of smart grid-aware edge computing federations. Cluster Comput. 2023;26(1):719-743.
- Xiao Y, Song Y, Liu J. Collaborative multi-agent deep reinforcement learning for energy-efficient resource allocation in heterogeneous mobile edge computing networks. IEEE Trans Wirel Commun. 2024;23(6):6653-6668.
- Mei J, Tong Z, Li K, Zhang L, Li K. Energy-efficient heuristic computation offloading with delay constraints in mobile edge computing. IEEE Trans Serv Comput. 2023;16(6):4404-4417.
- Acheampong A, Zhang Y, Xu X, Kumah DA. A review of the current task offloading algorithms, strategies and approach in edge computing systems. Comput Model Eng Sci. 2023;134(1):35-88.
- Cao H. The analysis of edge computing combined with cloud computing in strategy optimization of music educational resource scheduling. Int J Syst Assur Eng Manag. 2023;14(1):165-175.
- Sun Y, Wu Z, Meng K, Zheng Y. Vehicular task offloading and job scheduling method based on cloud-edge computing. IEEE Trans Intell Transp Syst. 2023;24(12):14651-14662.
- Zhao M, Zhang X, He Z, Chen Y, Zhang Y. Dependency-aware task scheduling and layer loading for mobile edge computing networks. IEEE Internet Things J. 2024;11(21):34364-34381.
- Zhang DG et al. Novel approach of computational resource allocation in fog computing based on deep reinforcement learning strategies. IEEE Internet Things J. 2025.
- Yang J et al. Cooperative task offloading for mobile edge computing based on multi-agent deep reinforcement learning. IEEE Trans Netw Serv Manag. 2023;20(3):3205-3219.
- Zhang D et al. Novel edge caching approach based on multi-agent deep reinforcement learning for internet of vehicles. IEEE Trans Intell Transp Syst. 2023;24(8):8324-8338.
- Hazra A, Kalita A, Gurusamy M. Meeting the requirements of Internet of Things: the promise of edge computing. IEEE Internet Things J. 2024;11(5):7474-7498.
- Zhang P, Wang G, Chen S, Yu Y, Chen L. The application of mobile edge computing in the space-air-ground integrated network. J Intell Comput Netw. 2025;1(1):71-97.
- Zhang DG et al. New method of edge computing-based data adaptive return in internet of vehicles. IEEE Trans Ind Inform. 2024;20(2):2042-2052.
- Vasireddy I, Ramya G, Kandi P. Kubernetes and docker load balancing: state-of-the-art techniques and challenges. Int J Innov Res Eng Manag. 2023;10(6):49-54.
- Rosa G, Scalabrino S, Bavota G, Oliveto R. What quality aspects influence the adoption of docker images? ACM Trans Softw Eng Methodol. 2023;32(6):1-30.
- Marella V. Comparative analysis of container orchestration platforms: Kubernetes vs. docker swarm. Int J Sci Res Sci Technol. 2024;11(5):526-543.
- Yang Y et al. Multi-agent reinforcement learning based file caching strategy in mobile edge computing. IEEE/ACM Trans Netw. 2023;31(6):3159-3174.
- Liu P et al. Computation rate maximization for SCMA-aided edge computing in IoT networks: a multi-agent reinforcement learning approach. IEEE Trans Wirel Commun. 2024;23(8):10414-10429.
- Tilahun FD, Abebe AT, Kang CG. Multi-agent reinforcement learning for distributed resource allocation in cell-free massive MIMO-enabled mobile edge computing network. IEEE Trans Veh Technol. 2023;72(12):16454-16468.
- Zhang X, Wang Y. DeepMECagent: multi-agent computing resource allocation for UAV-assisted mobile edge computing in distributed IoT system. Appl Intell. 2023;53(1):1180-1191.
- Jiang L, Wei R, Wang D. UAVs rounding up inspired by communication multi-agent depth deterministic policy gradient. Appl Intell. 2023;53(10):11474-11489.
- Lotfy A, Chaoui H, Kandidayeni M, Boulon L. Enhancing energy management strategy for battery electric vehicles: incorporating cell balancing and multi-agent twin delayed deep deterministic policy gradient architecture. IEEE Trans Veh Technol. 2024;73(11):16593-16607.
- Rajasekhar N, Radhakrishnan TK, Samsudeen N. Decentralized multi-agent control of a three-tank hybrid system based on twin delayed deep deterministic policy gradient reinforcement learning algorithm. Int J Dyn Control. 2024;12(4):1098-1115.
- Goto T, Kizumi Y, Iwasaki S. Design of reward function on reinforcement learning for automated driving. IFAC-PapersOnLine. 2023;56(2):7948-7953.
- Zhang J et al. New multi-user computation unloading method of edge computing based on improved pelican optimization control strategy for smart city. J Netw Comput Appl. 2026:104480.
- Zhang D et al. New method of vehicular network content distribution based on edge caching and catch fish optimization strategy. IEEE Trans Reliab. 2025.
- Zhang J, Zhang DG, Chen XB, Zhang T, Wang S. UAV-assisted geo-edge routing protocol for internet of vehicles based on reinforcement learning strategy. IEEE Trans Veh Technol. 2026.