This protocol presents an integrated bioinformatics workflow to identify immune-related biomarkers and develop an exploratory prognostic gene signature from public transcriptomic datasets of biliary tract and gallbladder cancer, using differential expression analysis, immune analysis, functional enrichment analysis, network construction, immune infiltration assessment, and Cox regression modeling.
مقالة بحثية
Immune-Related Biomarkers and an Exploratory Prognostic Signature in Biliary Tract and Gallbladder Cancer
في هذه المقالة
ملخص
الملخص
Gallbladder cancer is an aggressive biliary tract malignancy associated with poor prognosis and limited molecularly guided treatment options. Chronic inflammation and immune dysregulation play central roles in gallbladder carcinogenesis; however, reproducible computational workflows for identifying immune-related biomarkers remain limited. This study describes an integrated bioinformatic workflow for identifying immune-related differentially expressed genes (IRDEGs) and developing an exploratory prognostic gene signature. Differential expression analysis was performed using dataset-specific R-based workflows, and differentially expressed genes were intersected with immune-related gene sets obtained from ImmPort, InnateDB, and the Molecular Signatures Database (MSigDB). Gene Ontology, Kyoto Encyclopedia of Genes and Genomes, and gene set enrichment analyses were conducted to characterize biological functions and signaling pathways. Protein–protein interaction networks were constructed using STRING and Cytoscape; immune-cell infiltration was estimated using CIBERSORT; and prognostic genes were identified through sequential univariate, least absolute shrinkage and selection operator (LASSO) Cox, and multivariable Cox regression analyses. The analysis identified 824 consensus differentially expressed genes, including 312 IRDEGs. These genes were significantly enriched in inflammatory and immune-regulatory pathways, including IL6/JAK/STAT3, nuclear factor of kappa light chain enhancer (NF-κB), Toll-like receptor, and chemokine signaling pathways. CXCL8, IL1B, MMP9, TLR2, S100A8, and S100A9 were identified as key hub genes. Immune-cell infiltration analysis revealed a markedly altered tumor immune microenvironment. An exploratory five-gene prognostic signature comprising CXCL8, S100A9, IL16, MMP9, and CD36 successfully stratified patients according to overall survival risk. This integrated workflow provides a reproducible framework for identifying immune-related biomarkers and developing exploratory prognostic signatures in gallbladder cancer. However, independent clinical cohorts and experimental validation are required before these findings can be translated into clinical applications.
المقدمة
Gallbladder cancer (GBC) is an aggressive malignancy of the biliary tract characterized by marked geographical variation in incidence, with the highest disease burden reported in parts of South Asia, Latin America, and Eastern Europe1,2. Because early-stage GBC often presents with nonspecific symptoms and no widely accepted population-based screening strategy exists, most patients are diagnosed at locally advanced or metastatic stages, resulting in poor clinical outcomes3. Although advances in imaging, surgical techniques, chemotherapy, and immunotherapy have improved the management of biliary tract malignancies, the molecular and immunological mechanisms driving gallbladder carcinogenesis remain incompletely understood4,5.
Chronic inflammation, gallstones, genetic alterations, and dysregulated oncogenic signaling pathways are recognized contributors to GBC initiation and progression4,5. Interactions between tumor cells and the immune microenvironment influence tumor growth, invasion, metastasis, immune evasion, and therapeutic response. Previous studies have demonstrated aberrant cytokine expression, altered immune cell infiltration, immune checkpoint activation, and genomic changes associated with immune regulation in GBC6,7. These findings suggest that immune-related genes may serve as valuable biomarkers for disease progression, prognosis, and potential therapeutic targeting.
The increasing availability of public transcriptomic datasets and advanced bioinformatic approaches has enabled systematic investigation of molecular alterations in relatively rare malignancies such as GBC. The Cancer Genome Atlas (TCGA) and Gene Expression Omnibus (GEO) provide comprehensive gene expression and clinical datasets that can be analyzed using differential expression analysis, functional enrichment, protein–protein interaction network construction, immune cell infiltration analysis, and survival modeling. These resources enable systematic interrogation of the molecular hallmarks that sustain proliferative signaling, invasion, angiogenesis, and immune evasion in biliary tract malignancy8. Machine-learning approaches, including the least absolute shrinkage and selection operator (LASSO) regression combined with Cox proportional hazards regression, further facilitate the identification of candidate prognostic biomarkers9,10,11,12,13,14. Nevertheless, biomarkers identified through computational analyses require validation in independent patient cohorts and experimental models before their clinical significance can be established.
Previous integrative genomic analyses of gallbladder cancer have identified molecular subtypes associated with distinct immune microenvironmental features and patient survival outcomes.15. Altered inflammatory and immune-related marker profiles have been reported in gallbladder cancer, while changes in the tumor immune microenvironment have also been documented in biliary tract cancers16,17, and the prognostic impact of tumor-infiltrating immune-cell populations in biliary tract cancer has also been reported18.
Genomic and microenvironmental determinants of gallbladder cancer. Whole-exome and targeted sequencing studies have identified immune-related genomic alterations in gallbladder carcinoma19. Chemokine-mediated signaling contributes to tumor progression and metastasis in gastrointestinal malignancies20, and neutrophilic inflammation has been associated with poorer survival outcomes in patients with gallbladder carcinoma21. Tumor-associated macrophages are an important component of the biliary tract cancer microenvironment, with CD163+ macrophage infiltration showing prognostic relevance in extrahepatic bile duct cancer22, and single-cell transcriptomic analysis has revealed substantial cellular heterogeneity and immune-cell interactions within the gallbladder cancer tumor microenvironment, highlighting potential therapeutic targets23.
Molecular and genomic studies have characterized recurrent genetic alterations and potential therapeutic targets across biliary tract cancers, including gallbladder cancer24,25. Matrix metalloproteinases contribute to extracellular matrix remodeling and gallbladder cancer progression26, and S100 family proteins link inflammation to tumor development27. Several integrated bioinformatic analyses of gallbladder cancer have previously proposed prognostic gene signatures28. Established epidemiological risk factors, particularly gallstones, remain central to gallbladder carcinogenesis29, and gastrointestinal tumors evade immune surveillance through multiple converging mechanisms30.
Recent single-cell transcriptomic studies have further highlighted the complexity of the GBC tumor microenvironment. A 2024 single-cell analysis identified a progressively immunosuppressive microenvironment, distinct macrophage populations, heterogeneous T-cell states, and olfactomedin 4 (OLFM4) as a potential immune regulator associated with GBC progression31. Another study demonstrated dynamic alterations in epithelial and immune cell populations during the transition from normal gallbladder tissue to high-grade intraepithelial neoplasia and invasive carcinoma, identifying immunosuppressive macrophages and exhausted CD8⁺ T cells as key components of the malignant ecosystem32. These findings underscore the importance of integrating immune-related gene-expression profiles with cellular and clinical data to improve understanding of GBC biology.
Despite these advances, a standardized and reproducible computational workflow for identifying immune-related biomarkers and developing prognostic gene signatures in GBC remains lacking. The present study describes an integrated bioinformatic workflow for identifying immune-related differentially expressed genes, characterizing enriched biological pathways, constructing protein–protein interaction networks, estimating immune-cell infiltration, and developing an exploratory prognostic gene signature. This workflow is intended to prioritize candidate immune-related biomarkers and generate hypotheses for subsequent experimental and clinical validation rather than establish clinically validated prognostic markers.
البروتوكول
All transcriptomic and clinical datasets used in this study were obtained from publicly accessible databases, including The Cancer Genome Atlas (TCGA) and the Gene Expression Omnibus (GEO). Because all data were de-identified and publicly available, additional institutional ethics approval and informed consent were not required for this bioinformatic analysis.
Data acquisition and dataset selection
RNA-sequencing expression data and corresponding clinical information were obtained from the National Cancer Institute Genomic Data Commons under the TCGA Cholangiocarcinoma (TCGA-CHOL) project. The expression dataset comprised 36 primary tumor samples and 9 solid-tissue normal samples with available transcriptomic data. Because TCGA-CHOL represents cholangiocarcinoma rather than a dedicated gallbladder cancer cohort, it was used as a biliary tract cancer discovery dataset and exploratory survival-analysis cohort.
The independent gallbladder cancer dataset GSE139682 was downloaded from the Gene Expression Omnibus (GEO) database of the National Center for Biotechnology Information. GSE139682 was generated using high-throughput RNA sequencing on the GPL20795 HiSeq X Ten platform and included 10 gallbladder cancer tissues and 10 matched normal gallbladder tissues. The processed dataset contained reads per kilobase of transcript per million mapped reads (RPKM)-normalized expression values. GSE139682 was used to evaluate the reproducibility and direction of differential gene expression. It was not used as an external survival-validation cohort because complete survival outcomes and follow-up information were unavailable in the GEO series record.
TCGA-CHOL was selected as the discovery and exploratory survival-analysis cohort because it provides RNA-sequencing data together with overall-survival information for cholangiocarcinoma. TCGA-CHOL comprises cholangiocarcinoma cases and was used as a biliary tract cancer discovery and exploratory survival-analysis cohort. GSE139682 was used as a histologically confirmed gallbladder cancer dataset to assess the reproducibility and direction of differential expression, whereas survival modeling was restricted to TCGA-CHOL because complete survival outcomes were unavailable for GSE139682.
Primary human tumor and matched normal tissue transcriptomic samples with sufficient gene expression data were eligible for inclusion. Cell-line experiments, xenograft samples, animal studies, metastatic-lesion-only datasets, and inadequately annotated samples were excluded. Immune-related gene collections were obtained from ImmPort, InnateDB, and the Molecular Signatures Database (MSigDB). Dataset characteristics and their analytical roles are summarized in Table 1.
Data preprocessing and normalization
Expression matrices and corresponding clinical information were imported into R version 4.3.2 for preprocessing and downstream analyses. Gene identifiers were converted to official gene symbols using the annotation information associated with each sequencing platform. When multiple expression entries represented the same gene symbol, the entry with the highest mean expression was retained. Expression values were log₂-transformed, when required, to improve comparability and stabilize variance.
Low-expression filtering and quality control. Before differential expression analysis, low-expression genes were removed to reduce noise and limit the burden of multiple testing. For the TCGA-CHOL raw count matrix, genes with a total raw count below 10 across all samples were excluded; for GSE139682, genes with RPKM values below 0.1 in more than 90% of samples were excluded. Genes lacking a valid official gene symbol in the corresponding platform annotation were also removed. Sample-level quality control was performed before differential-expression testing by inspecting the per-sample library size, the number of detected genes, and the distribution of log₂-transformed expression values, and by using principal-component analysis and hierarchical clustering to flag outlier samples. Samples flagged by these checks were reviewed against their clinical annotation before any exclusion decision was taken, and exclusions were based on predefined annotation and quality criteria rather than on the magnitude of the resulting differential-expression statistics.
Raw RNA-sequencing count data were normalized using the DESeq2 package, which estimated size factors and gene-wise dispersion prior to differential expression analysis33. Processed normalized expression data were subsequently analyzed using the limma package, where appropriate34. Sample distributions and potential outliers were assessed using principal component analysis and hierarchical clustering.
Model specification for differential-expression testing. For the TCGA-CHOL count data, differential expression was assessed using a negative binomial generalized linear model fitted with the design formula ~ tissue_type, where tissue_type denoted primary tumor versus solid-tissue normal. No further covariates were included because complete clinical covariates were not available for all samples. Size factors were estimated by the median-of-ratios method, gene-wise dispersion estimates were shrunk toward the fitted dispersion trend, and independent filtering of low-count genes was applied using the DESeq2 defaults to optimize the number of rejections. Where processed, already-normalized expression matrices were analyzed with limma, a linear model was fitted for each gene, and empirical Bayes moderation was applied to the variance estimates before moderated t-statistics were computed. In both workflows, P values were adjusted for multiple testing with the Benjamini–Hochberg method, and genes with an adjusted P value < 0.05 and an absolute log₂ fold change > 1 were considered differentially expressed.
Assessment and adjustment of batch effects. Because the two datasets were generated on different platforms and in different laboratories, potential batch effects were considered explicitly. Batch-effect adjustment was performed with the ComBat function implemented in the sva package and was applied within each dataset rather than across datasets: the two cohorts were analyzed independently, and consensus genes were defined by concordant direction of change rather than by pooled effect sizes, so no cross-dataset batch correction was required for the consensus analysis. Within GSE139682, all samples were sequenced on a single platform within a single submission and were available as matched tumor-normal pairs, which limits the influence of technical batch on the within-dataset comparison. Within TCGA-CHOL, batch identifiers were not consistently available in the archived clinical annotation; principal component analysis and hierarchical clustering were therefore performed before and after adjustment to confirm that the dominant axis of variation corresponded to tissue type rather than to an identifiable technical factor. Residual, unmodeled batch effects cannot be excluded and are acknowledged as a limitation.
Differential gene-expression analysis
Differential expression analysis was performed separately for each dataset using methods appropriate to the underlying data structure. P values were adjusted for multiple comparisons using the Benjamini–Hochberg method. Genes with an adjusted P value <0.05 and an absolute log₂ fold change >1 were considered differentially expressed. Upregulated genes were defined as those with log₂ fold change >1, whereas downregulated genes were defined as those with log₂ fold change <-1.
Volcano plots and heatmaps were generated using the ggplot2 and pheatmap packages. Consensus differentially expressed genes (DEGs) were defined as genes that met the predefined significance criteria in both datasets and exhibited the same direction of differential expression.
Identification of immune-related differentially expressed genes
Immune-related gene lists obtained from ImmPort, InnateDB, and MSigDB were combined into a unified reference set after removing duplicate gene symbols. Consensus DEGs were intersected with the immune-related reference set to identify immune-related differentially expressed genes (IR-DEGs). The resulting genes were classified as upregulated or downregulated according to their log₂ fold-change values. Hierarchical clustering and heatmap visualization were used to evaluate IR-DEG expression patterns across tumor and normal tissue samples.
Functional enrichment analysis
Functional enrichment analysis was performed using the clusterProfiler package in R to investigate the biological significance of the identified IR-DEGs. Gene Ontology (GO) enrichment analysis was conducted to identify significantly enriched Biological Process, Cellular Component, and Molecular Function categories. Kyoto Encyclopedia of Genes and Genomes (KEGG) pathway analysis was performed to identify significantly enriched cancer-related and immune-related signaling pathways. An adjusted P value <0.05 was considered statistically significant.
Gene Set Enrichment Analysis (GSEA) was also performed using Hallmark and KEGG gene sets obtained from the Molecular Signatures Database (MSigDB). Normalized enrichment scores and false discovery rates (FDRs) were calculated for each pathway, and pathways with an FDR <0.25 were considered significantly enriched. Dot plots, bar plots, and enrichment curves were generated to visualize the enrichment results.
Protein–protein interaction network construction and hub-gene identification
The identified IR-DEGs were submitted to STRING version 11.5 to construct a protein–protein interaction (PPI) network using a minimum interaction confidence score >0.7. The interaction network was imported into Cytoscape version 3.9.1 for visualization and topological analysis.
Hub genes were ranked independently using degree centrality, maximal clique centrality, closeness centrality, and betweenness centrality within the cytoHubba plugin. The top 10 genes identified by each algorithm were retained. Genes that ranked among the top 10 in all four algorithms were defined as consensus hub genes. This integration strategy prioritized genes that were consistently central across complementary network-topology metrics. Densely connected functional modules were identified using the Molecular Complex Detection (MCODE) plugin.
Immune-cell infiltration analysis
Normalized expression data from the 10 gallbladder cancer tissues and 10 matched normal tissues in GSE139682 were analyzed using CIBERSORT with the LM22 immune-cell signature matrix. The relative proportions of 22 immune-cell types were estimated for each sample. Because the samples were obtained as matched tumor–normal pairs, between-group comparisons were performed using the paired Wilcoxon signed-rank test. P values for the 22 immune-cell comparisons were adjusted using the Benjamini–Hochberg method.
The archived analysis output did not retain the individual CIBERSORT deconvolution P-values needed to verify the exact number of samples that met the deconvolution threshold (P < 0.05). Therefore, the immune-cell infiltration analysis was reported as exploratory, and no inferential conclusions were drawn from an unverifiable filtered subset.
Construction of the prognostic gene signature
IR-DEGs were matched with the available overall-survival data in the TCGA-CHOL cohort. Univariate Cox proportional hazards regression was initially performed to identify genes associated with survival (P < 0.05). Candidate genes were subsequently entered into the least absolute shrinkage and selection operator (LASSO)-Cox regression using the glmnet package to reduce the number of predictors and minimize model overfitting. Genes retained after LASSO-Cox regression were entered into multivariable Cox regression to derive the final prognostic model.
A risk score was calculated for each patient as the sum of the expression levels of the selected genes, multiplied by their corresponding multivariable Cox regression coefficients. Patients were then categorized into high- and low-risk groups based on the median risk score.
The archived analysis files confirmed the use of glmnet-based LASSO-Cox regression but did not retain the fold assignments, random seed, or selected lambda value. Consequently, the prognostic model was described as exploratory, and unavailable parameters were not retrospectively inferred.
Validation of the prognostic model
The exploratory prognostic model was evaluated within the TCGA-CHOL development cohort using Kaplan–Meier survival analysis and the log-rank test. Time-dependent receiver operating characteristic (ROC) curves were generated using the survivalROC package to assess model discrimination at 1, 3, and 5 years. Principal component analysis and t-distributed stochastic neighbor embedding (t-SNE) were performed to visualize the distribution of patients in the high-risk and low-risk groups.
GSE139682 was not used for external survival validation because complete overall-survival and follow-up data were unavailable. Instead, the dataset was used solely for expression-level validation. Consequently, the prognostic model requires validation in an independent cohort of histologically confirmed gallbladder cancer.
Statistical analysis
All statistical analyses were performed using R version 4.3.2. Continuous variables were compared using Student's t-test when parametric assumptions were satisfied and the Wilcoxon rank-sum test or paired Wilcoxon signed-rank test when appropriate. Categorical variables were compared using the chi-square test or Fisher's exact test, as applicable. Correlations were evaluated using Spearman's rank-correlation coefficient when complete output data were available. P values from multiple comparisons were adjusted using the Benjamini–Hochberg method. Unless otherwise specified, all statistical tests were two-sided, and a P value <0.05 was considered statistically significant.
النتائج
Differentially expressed genes in biliary tract and gallbladder cancer datasets
Differential expression analysis was performed separately on the TCGA-CHOL and GSE139682 datasets. In the TCGA-CHOL dataset, 1,842 differentially expressed genes (DEGs) were identified, comprising 1,102 upregulated and 740 downregulated genes. In GSE139682, 1,215 DEGs were identified, including 712 upregulated and 503 downregulated genes. Intersection analysis identified 824 consensus DEGs that exhibited the same direction of change in expression across both datasets.
Volcano plots demonstrated marked transcriptional differences between tumor and normal tissues, whereas hierarchical clustering based on the most differentially expressed genes clearly separated tumor from normal samples. These findings indicated substantial molecular reprogramming in gallbladder cancer. Upregulated transcripts were predominantly associated with immune signaling, extracellular matrix remodeling, and cytokine-mediated pathways. The differential expression results are summarized in Table 1, and representative volcano plots and hierarchical clustering heatmaps are shown in Figure 1 and Figure 2, respectively.
Identification of immune-related differentially expressed genes
The unified immune-related gene reference set comprised 2,498 genes, obtained from ImmPort, InnateDB, and the Immune-Related Molecular Signatures Database (MSigDB). Intersecting this reference set with the 824 consensus DEGs identified 312 immune-related differentially expressed genes (IR-DEGs), including 187 upregulated and 125 downregulated genes.
Among the upregulated IR-DEGs were CXCL8, IL1B, TNFAIP3, and CCL20, whereas CXCL14 and CD36 were among the downregulated genes. Hierarchical clustering revealed distinct immune-related gene expression patterns between tumor and normal tissues, supporting the differential immune landscape observed in gallbladder cancer, as illustrated in Figure 3. A detailed list of the selected IR-DEGs, together with their fold changes and functional annotations, is presented in Table 2.
Functional enrichment analysis
Gene Ontology (GO) and Kyoto Encyclopedia of Genes and Genomes (KEGG) enrichment analyses demonstrated that the identified IR-DEGs were predominantly associated with immune activation and inflammatory signaling pathways. GO biological process analysis revealed significant enrichment in neutrophil activation (adjusted P = 1.2 × 10⁻6), cytokine-mediated signaling, innate immune response, and antigen presentation.
KEGG pathway analysis identified significant enrichment of the NF-κB signaling pathway (adjusted P = 3.6 × 10⁻5), IL-17 signaling, Toll-like receptor signaling, and chemokine signaling pathways. Gene Set Enrichment Analysis (GSEA) using Hallmark gene sets further demonstrated significant enrichment of inflammatory response, IL6/JAK/STAT3 signaling, TNF-α signaling through NF-κB, and epithelial–mesenchymal transition pathways in tumor tissues. Collectively, these findings indicated that gallbladder cancer tissues exhibited enhanced inflammatory signaling, dysregulated cytokine activity, and an immunosuppressive tumor microenvironment. A summary of the GO, KEGG, and GSEA results is presented in Table 3.
Protein–protein interaction network and hub-gene identification
The 312 IR-DEGs generated a protein–protein interaction (PPI) network comprising 286 nodes and 1,429 edges at a STRING interaction confidence score greater than 0.7. Hub genes were ranked using degree centrality, maximal clique centrality, closeness centrality, and betweenness centrality. Genes that ranked among the top 10 across all four algorithms were retained as consensus hub genes.
The final hub-gene set consisted of CXCL8, IL1B, MMP9, TLR2, CCL20, S100A9, S100A8, TNFAIP3, CXCL2, and CD36. Molecular Complex Detection analysis identified two densely connected functional modules. The first module was enriched for inflammatory cytokines and chemokines, whereas the second module was enriched for antimicrobial proteins and members of the S100 stress-response family. The PPI network is illustrated in Figure 4, and the hub-gene rankings are summarized in Table 4.
Immune-cell infiltration patterns
CIBERSORT analysis of 10 gallbladder cancer tissues and 10 matched normal tissues revealed differences in the estimated proportions of multiple immune-cell populations. Tumor tissues exhibited higher estimated proportions of M2 macrophages, regulatory T cells, neutrophils, and activated mast cells, whereas lower estimated proportions of CD8-positive T cells, resting dendritic cells, and memory B cells were observed. Comparisons were performed on matched tumor-normal pairs using the two-sided paired Wilcoxon signed-rank test, with Benjamini–Hochberg adjustment applied across the 22 immune-cell comparisons. The archived output did not retain the sample-level CIBERSORT deconvolution P values or the per-cell-type summary statistics needed to derive adjusted P values and confidence intervals; cell-type-specific effect estimates, adjusted P values, and 95% confidence intervals are consequently not reported, and the differences described here are presented as exploratory rather than as statistically confirmed differences. The estimated immune-cell composition is shown in Figure 5.
Construction of the prognostic immune-related gene signature
Cox proportional hazards regression identified CXCL8, S100A9, IL16, MMP9, and CD36 as genes associated with survival and included in the exploratory five-gene prognostic signature. CXCL8, S100A9, and MMP9 had positive regression coefficients and hazard ratios > 1, whereas IL16 and CD36 had negative regression coefficients and hazard ratios < 1. The regression coefficients, hazard ratios, 95% confidence intervals, and direction of regulation for the five genes included in the exploratory prognostic signature are summarized in Table 5. The detailed Cox proportional hazards regression results, including standard errors, Wald z statistics, and P values, are presented in Table 6.
The risk score was calculated as follows:
Risk score = (0.42 × CXCL8 expression) + (0.37 × S100A9 expression) − (0.29 × IL16 expression) + (0.33 × MMP9 expression) − (0.22 × CD36 expression).
Patients were stratified into high- and low-risk groups based on the median risk score. Within the TCGA-CHOL development cohort, the high-risk group exhibited significantly shorter median overall survival than the low-risk group (14.6 months versus 38.2 months; log-rank P = 0.003).
Exploratory model performance
Kaplan–Meier survival analysis demonstrated clear separation between the high-risk and low-risk groups within the TCGA-CHOL development cohort. The areas under the time-dependent receiver operating characteristic curves were 0.82 at 1 year, 0.79 at 3 years, and 0.76 at 5 years. Principal component analysis and t-distributed stochastic neighbor embedding further demonstrated distinct clustering of the two risk groups.
External validation was not performed because GSE139682 does not contain complete overall-survival and follow-up data. Consequently, the prognostic model should be considered exploratory and should be validated in an independent, histologically confirmed cohort of gallbladder cancer.
Association of the prognostic signature with clinicopathological characteristics
Associations between the prognostic risk score and clinicopathological characteristics were explored in the TCGA-CHOL cohort. However, because complete variable-specific sample sizes and archived outputs for the adjusted clinicopathological analyses were not available for verification, these exploratory associations are not reported as definitive findings.
DATA AVAILABILITY:
The transcriptomic and clinical data analyzed in this study are publicly available from the National Cancer Institute Genomic Data Commons under project TCGA-CHOL and from the National Center for Biotechnology Information Gene Expression Omnibus under accession GSE139682. The raw sequencing data associated with GSE139682 are available under BioProject PRJNA586879 and Sequence Read Archive accession SRP227857. Processed expression data are available from the GSE139682 series record. No new primary sequencing data were generated in this study.
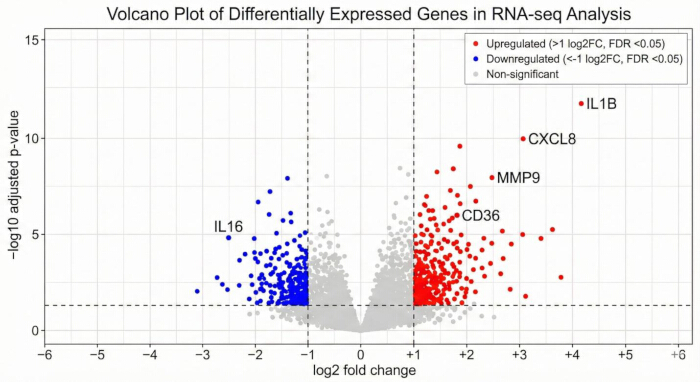
Figure 1: Volcano plot of differentially expressed genes in gallbladder cancer. Volcano plot showing differentially expressed genes identified between gallbladder cancer and normal tissues. Red dots represent significantly upregulated genes, blue dots represent significantly downregulated genes, and gray dots represent genes that did not meet the significance criteria. Differential expression was defined as an adjusted P value <0.05 and an absolute log₂ fold change >1. Representative genes with marked differential expression are annotated. Please click here to view a larger version of this figure.
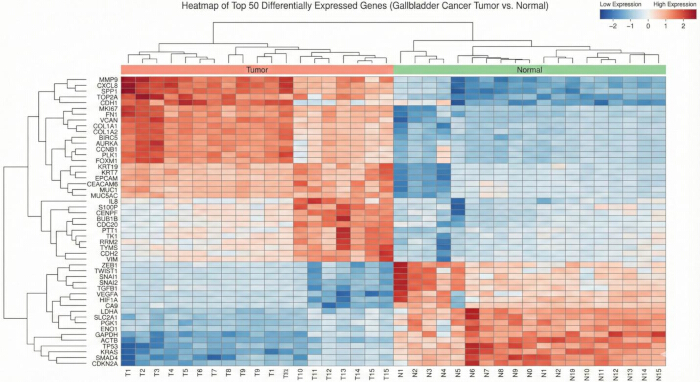
Figure 2: Heatmap of the top 50 differentially expressed genes. Hierarchical clustering heatmap showing the expression patterns of the top 50 differentially expressed genes in gallbladder cancer and normal tissue samples. Rows represent genes and columns represent individual samples. Red indicates relatively high expression, and blue indicates relatively low expression. The clustering demonstrates a clear separation between tumor and normal tissues based on gene expression profiles. Please click here to view a larger version of this figure.
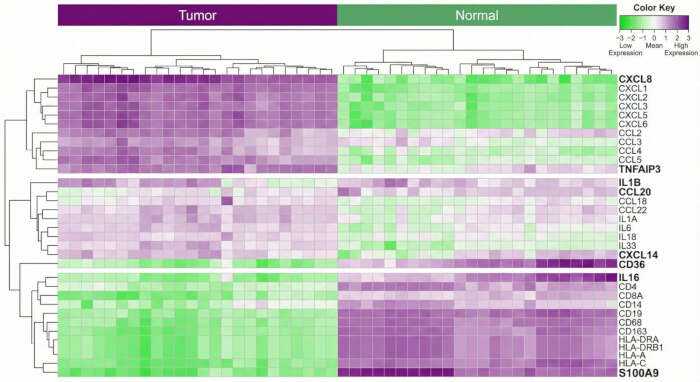
Figure 3: Heatmap of immune-related differentially expressed genes. Hierarchical clustering heatmap showing the expression profiles of representative immune-related differentially expressed genes identified by intersecting consensus differentially expressed genes with immune-related gene sets. Rows represent genes and columns represent individual samples. Purple indicates relatively high expression, and green indicates relatively low expression. Distinct clustering of tumor and normal samples demonstrates marked immune-related transcriptional alterations in gallbladder cancer. Please click here to view a larger version of this figure.
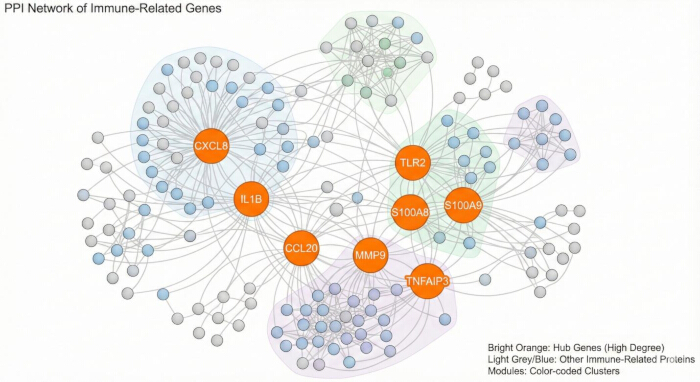
Figure 4: Protein–protein interaction network of immune-related differentially expressed genes. Protein–protein interaction network constructed using STRING (interaction confidence score >0.7) and visualized in Cytoscape. Orange nodes represent consensus hub genes identified using cytoHubba ranking algorithms, whereas gray and blue nodes represent interacting immune-related proteins. Shaded colored regions indicate densely connected functional modules identified using the Molecular Complex Detection (MCODE) algorithm. Please click here to view a larger version of this figure.
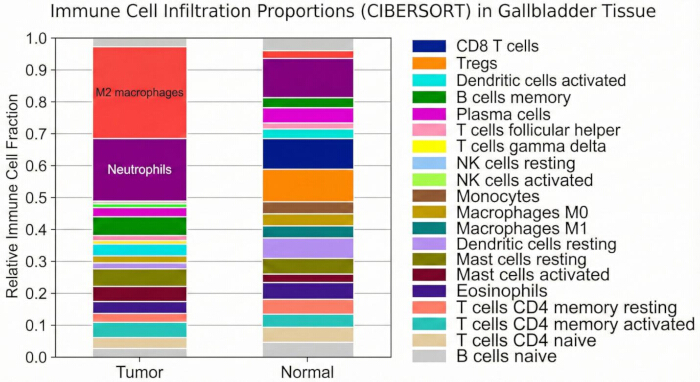
Figure 5: Immune-cell infiltration profiles in gallbladder cancer and normal tissues. Relative proportions of immune-cell populations estimated using the CIBERSORT algorithm in gallbladder cancer and matched normal tissues. Tumor samples demonstrated higher estimated proportions of M2 macrophages, neutrophils, regulatory T cells, and activated mast cells, whereas normal tissues showed relatively higher proportions of CD8-positive T cells, resting dendritic cells, and memory B cells. Because archived CIBERSORT deconvolution statistics were unavailable, these findings are presented as exploratory estimates of immune-cell composition. Please click here to view a larger version of this figure.
| Category | TCGA (n = 36 tumor vs. 10 normal) | GEO: GSE139682 (n = 30 tumor vs. 15 normal) | Overlapping DEGs |
| Total DEGs | 1,842 | 1,215 | 824 |
| Upregulated | 1,102 | 712 | 506 |
| Downregulated | 740 | 503 | 318 |
| Fold-Change Threshold | log₂FC | ≥ 1 | |
| Adjusted p-value (FDR) | < 0.05 | < 0.05 | — |
| Top Upregulated Genes | CXCL8, MMP9, IL1B | S100A8, CCL20, TLR2 | CXCL8, IL1B, MMP9 |
| Top Downregulated Genes | CXCL14, CD36, IL16 | CXCL14, KLF2, GREM1 | CXCL14, CD36 |
Table 1: Summary of differentially expressed genes identified in the TCGA-CHOL and GSE139682 datasets. Numbers of significantly upregulated, downregulated, and consensus differentially expressed genes identified in the TCGA-CHOL and GSE139682 datasets using an adjusted P value <0.05 and |log₂ fold change| >1. Representative highly dysregulated genes identified in each dataset and shared between them are also shown.
| Gene Symbol | log₂FC (TCGA) | log₂FC (GEO) | Adjusted p-value | Regulation | Immune Function |
| CXCL8 | 2.87 | 2.41 | 3.1 × 10⁻⁶ | Up | Neutrophil recruitment, inflammation |
| IL1B | 2.32 | 1.94 | 1.7 × 10⁻⁵ | Up | Pro-inflammatory cytokine |
| TNFAIP3 | 1.58 | 1.21 | 4.2 × 10⁻⁴ | Up | NF-κB pathway regulator |
| CCL20 | 2.01 | 1.76 | 2.9 × 10⁻⁵ | Up | T-cell trafficking |
| CXCL14 | −1.97 | −1.52 | 7.3 × 10⁻⁴ | Down | Immune surveillance, chemotaxis |
| CD36 | −1.43 | −1.12 | 2.1 × 10⁻³ | Down | Antigen uptake, lipid metabolism |
| IL16 | −1.21 | −0.98 | 3.9 × 10⁻³ | Down | T-cell activation |
| S100A9 | 2.51 | 2.03 | 1.2 × 10⁻⁴ | Up | Neutrophil function, inflammation |
Table 2: Representative immune-related differentially expressed genes identified in gallbladder cancer. Selected immune-related differentially expressed genes identified by intersecting consensus differentially expressed genes with immune-related gene sets obtained from ImmPort, InnateDB, and the Molecular Signatures Database (MSigDB). The table includes log₂ fold-change values from the TCGA-CHOL and GSE139682 datasets, adjusted P-values, direction of regulation, and the principal immune-related functions for each gene.
| Analysis Type | Top Enriched Terms/Pathways | Gene Count | Adjusted p-value / FDR |
| GO Biological Process | Neutrophil activation | 42 | 1.2 × 10⁻⁶ |
| Cytokine-mediated signaling | 57 | 3.4 × 10⁻⁵ | |
| Antigen processing/presentation | 29 | 6.1 × 10⁻⁴ | |
| KEGG Pathways | NF-κB signaling pathway | 28 | 3.6 × 10⁻⁵ |
| IL-17 signaling pathway | 31 | 4.7 × 10⁻⁴ | |
| Toll-like receptor signaling | 24 | 8.9 × 10⁻⁴ | |
| GSEA Hallmark Sets | Inflammatory response | NES = 2.34 | FDR = 0.012 |
| IL6/JAK/STAT3 signaling | NES = 2.01 | FDR = 0.028 | |
| TNF-α/NF-κB signaling | NES = 1.87 | FDR = 0.044 |
Table 3: Summary of Gene Ontology, KEGG pathway, and Gene Set Enrichment Analysis results.
Significantly enriched Gene Ontology (GO) biological processes, Kyoto Encyclopedia of Genes and Genomes (KEGG) pathways, and Hallmark Gene Set Enrichment Analysis (GSEA) pathways were identified for the immune-related differentially expressed genes. Representative enriched pathways, gene counts, or normalized enrichment scores, and adjusted P values or false discovery rates are presented.
| Rank | Gene | MCC Score | Degree | Biological Role |
| 1 | CXCL8 | 132.4 | 41 | Chemokine; promotes inflammation & tumor progression |
| 2 | IL1B | 127.9 | 38 | Cytokine; inflammatory mediator |
| 3 | MMP9 | 119.2 | 35 | ECM degradation; metastasis |
| 4 | TLR2 | 112.6 | 33 | Innate immune receptor |
| 5 | CCL20 | 107.4 | 29 | T-cell chemoattractant |
| 6 | S100A9 | 105.1 | 27 | Inflammation, neutrophil activation |
| 7 | S100A8 | 98.3 | 24 | Pro-inflammatory damage-associated protein |
| 8 | TNFAIP3 | 93.7 | 22 | NF-κB inhibitor |
| 9 | CXCL2 | 89.5 | 21 | Neutrophil recruitment |
| 10 | CD36 | 85.2 | 19 | Antigen uptake, lipid metabolism |
Table 4: Consensus hub genes identified from the protein–protein interaction network. Consensus hub genes identified from the protein–protein interaction network using cytoHubba ranking algorithms in Cytoscape. The table summarizes maximal clique centrality scores, degree values, and the reported biological functions of the identified hub genes.
| Gene | Coefficient (β) | Hazard Ratio (HR) | 95% Confidence Interval | Regulation | Known Role in Cancer |
| CXCL8 | 0.42 | 1.52 | 1.18–1.96 | Up | Promotes angiogenesis, metastasis |
| S100A9 | 0.37 | 1.41 | 1.11–1.77 | Up | Mediates inflammation, tumor growth |
| IL16 | −0.29 | 0.74 | 0.59–0.91 | Down | T-cell chemoattractant; tumor suppressive |
| MMP9 | 0.33 | 1.38 | 1.10–1.72 | Up | ECM remodeling; invasion & metastasis |
| CD36 | −0.22 | 0.81 | 0.66–0.99 | Down | Immune regulation, lipid metabolism |
Table 5: Exploratory five-gene prognostic signature and regression coefficients. Genes included in the exploratory prognostic signature derived from multivariable Cox regression analysis. The table presents regression coefficients, hazard ratios, 95% confidence intervals, direction of regulation, and the reported biological roles of each gene in gallbladder cancer or tumor-associated immune regulation. The prognostic model was developed using the TCGA-CHOL cohort and requires validation in independent gallbladder cancer cohorts.
| Gene | Coefficient (β) | Hazard ratio | 95% confidence interval | SE (log HR) | Wald z | P value |
| CXCL8 | 0.42 | 1.52 | 1.18–1.96 | 0.129 | 3.23 | 0.0012 |
| S100A9 | 0.37 | 1.41 | 1.11–1.77 | 0.119 | 2.89 | 0.0039 |
| IL16 | -0.29 | 0.74 | 0.59–0.91 | 0.111 | -2.72 | 0.0065 |
| MMP9 | 0.33 | 1.38 | 1.10–1.72 | 0.114 | 2.82 | 0.0047 |
| CD36 | -0.22 | 0.81 | 0.66–0.99 | 0.103 | -2.04 | 0.0416 |
Table 6: Multivariable Cox proportional hazards regression results for the exploratory five-gene prognostic signature. The table presents the regression coefficient (β), hazard ratio (HR), 95% confidence interval (CI), standard error (SE) of the log hazard ratio, Wald z statistic, and P value for each gene included in the exploratory five-gene prognostic signature. Positive regression coefficients and HR values >1 indicate associations with increased risk, whereas negative regression coefficients and HR values <1 indicate associations with decreased risk. The prognostic model was developed using the TCGA-CHOL cohort and has not been independently validated in a histologically confirmed cohort of gallbladder cancer. Abbreviations: β = regression coefficient; HR = hazard ratio; CI = confidence interval; SE = standard error.
المناقشة
The present study applied an integrated bioinformatic workflow to investigate immune-related transcriptional alterations in biliary tract and gallbladder cancer datasets. Enrichment of the IL-6/JAK/STAT3, nuclear factor-kappa B (NF-κB), Toll-like receptor, IL-17, and chemokine signaling pathways supports the contribution of chronic inflammation and immune dysregulation to biliary tract tumorigenesis. Previous studies have similarly demonstrated that inflammatory cytokines and immune-regulatory pathways promote tumor-cell proliferation, invasion, angiogenesis, immune evasion, and resistance to apoptosis in gallbladder and other biliary tract cancers.
Protein–protein interaction network analysis prioritized CXCL8, IL1B, MMP9, TLR2, CCL20, S100A8, S100A9, TNFAIP3, CXCL2, and CD36 as key hub genes. CXCL8 and IL1B are major inflammatory mediators that promote neutrophil recruitment and modulate communication between malignant and immune cells. MMP9 contributes to extracellular matrix degradation, tumor invasion, and metastatic dissemination, whereas S100A8 and S100A9 are inflammation-associated proteins involved in myeloid-cell recruitment and the establishment of an immunosuppressive tumor microenvironment. Previous molecular studies have likewise implicated inflammatory mediators, chemokines, extracellular matrix-remodeling genes, and immune-regulatory pathways in the progression of gallbladder cancer.
CIBERSORT analysis indicated altered proportions of macrophages, regulatory T cells, neutrophils, mast cells, dendritic cells, B cells, and CD8-positive T cells in tumor tissues. These findings are consistent with previous studies demonstrating marked cellular heterogeneity and immunosuppressive immune-cell populations in gallbladder cancer. Recent single-cell transcriptomic analyses have identified regulatory and exhausted T-cell populations, tumor-associated macrophages, and extensive interactions among malignant epithelial, immune, and stromal cells during gallbladder cancer progression. Nevertheless, immune-cell proportions inferred from bulk transcriptomic data cannot directly determine the spatial distribution, activation state, or functional activity of immune cells within the tumor microenvironment.
The exploratory five-gene prognostic model should be interpreted with caution because it was developed using a relatively small public biliary tract cancer cohort and was not validated in an independent cohort with complete survival information. Although the model successfully stratified patients into distinct risk groups in the development cohort, its prognostic performance and clinical utility require evaluation in larger, histologically confirmed cohorts of gallbladder cancer. Future studies should determine whether the identified gene signature provides prognostic information beyond established clinicopathological factors, including tumor stage, histological grade, lymph-node involvement, and surgical resection status. The model was neither externally validated in an independent cohort nor validated experimentally, and it was developed in a biliary tract cohort that is not specific to gallbladder cancer; it is therefore presented as exploratory and hypothesis-generating rather than as a clinically applicable tool.
A major strength of this study is the integration of differential expression analysis, immune gene screening, functional enrichment analysis, protein–protein interaction network analysis, immune cell infiltration estimation, and survival modeling into a single, reproducible bioinformatic workflow. However, the findings remain computational and hypothesis-generating. Experimental validation and independent clinical studies are required to confirm the biological functions, reproducibility, and potential clinical significance of the identified genes, pathways, and prognostic signatures.
This study has several limitations. First, the analyses were retrospective and relied on publicly available datasets with relatively small sample sizes. The TCGA-CHOL dataset represents cholangiocarcinoma rather than a dedicated gallbladder cancer cohort and was therefore used as a biliary tract cancer discovery and exploratory survival-analysis cohort. Consequently, findings derived from this dataset should not be interpreted as being specific to gallbladder cancer without independent validation.
Second, differences in sample collection, sequencing platforms, normalization methods, and clinical annotation across the included datasets may have introduced technical and biological heterogeneity. Third, immune cell proportions were estimated from bulk transcriptomic data and therefore cannot fully capture the spatial organization, activation status, or functional interactions of immune cells within the tumor microenvironment.
Fourth, the prognostic model was developed using a relatively small public cohort and could not be externally validated because no independent gallbladder cancer dataset with complete survival information was available. In addition, the archived analysis records did not retain all LASSO cross-validation parameters, sample-level CIBERSORT deconvolution statistics, or TIMER correlation outputs, limiting the complete reconstruction of these analyses.
Finally, the identified genes, signaling pathways, immune-cell infiltration patterns, and prognostic signature have not been experimentally validated. Quantitative polymerase chain reaction, immunohistochemistry, flow cytometry, spatial transcriptomics, functional studies, and validation in independent prospective clinical cohorts are required before these findings can be considered for clinical application. This absence of external validation is the principal limitation of the prognostic analysis. Because discrimination was estimated in the same samples used to develop the model, the values reported below represent apparent rather than validated performance and are likely to be optimistically biased. Internal validation by data splitting or bootstrapping was not performed because the number of events available in this cohort was too small to support a stable training-test partition, and no experimental validation of the five signature genes was undertaken.
This study presents an integrated bioinformatic workflow for identifying immune-related transcriptional alterations and exploratory prognostic biomarkers in biliary tract and gallbladder cancer datasets. The analysis identified significant enrichment of inflammatory and immune-regulatory pathways, including IL6/JAK/STAT3, nuclear factor kappa B, Toll-like receptor, IL-17, and chemokine signaling, and prioritized CXCL8, IL1B, MMP9, TLR2, S100A8, and S100A9 as key hub genes. Immune-cell infiltration analysis further suggested substantial alterations in the gallbladder cancer immune microenvironment.
The exploratory five-gene prognostic signature provides a framework for future research on prognostic biomarkers; however, its clinical utility has not yet been established. Independent validation in larger, histologically confirmed cohorts of gallbladder cancer, together with experimental confirmation of the identified genes and pathways, will be essential before these findings can be translated into clinical applications.
الإفصاحات
No conflicts of interest exist in relation to the submission of this manuscript. All authors have read and approved the submitted manuscript.
شكر وتقدير
This study was supported by the National Natural Science Foundation of China, No. 82172628, 81974371, and the Xinhua Hospital Funded Clinical Research (21XHDB10), and the Shanghai Key Laboratory of Biliary Tract Disease Research Foundation, No.17DZ2260200.
المواد
| الاسم | الشركة | رقم فهرسي | التعليقات |
|---|---|---|---|
| CIBERSORT / LM22 signature matrix | Stanford University | Online platform/signature matrix; https://cibersortx.stanford.edu/ | Estimation of the relative proportions of 22 immune-cell types from normalized expression data. |
| clusterProfiler | Bioconductor | R package; exact version not reported; https://bioconductor.org/packages/clusterProfiler/ | GO, KEGG, and gene set enrichment analysis and enrichment-result visualization. |
| ComplexHeatmap | Bioconductor | R package; exact version not reported; https://bioconductor.org/packages/ComplexHeatmap/ | Advanced heatmap visualization of gene-expression and analysis results. |
| cytoHubba | Cytoscape App Store / cytoHubba developers | Cytoscape app; exact version not reported; https://apps.cytoscape.org/apps/cytohubba | Hub-gene ranking by degree, maximal clique centrality, closeness, and betweenness centrality. |
| Cytoscape | Cytoscape Consortium | Version 3.9.1; https://cytoscape.org/ | Visualization and topological analysis of protein–protein interaction networks. |
| DESeq2 | Bioconductor | R package; exact version not reported; https://bioconductor.org/packages/DESeq2/ | Normalization and differential-expression analysis of RNA-sequencing count data. |
| Gene Expression Omnibus (GEO) | National Center for Biotechnology Information, NIH | GSE139682; https://www.ncbi.nlm.nih.gov/geo/query/acc.cgi?acc=GSE139682 | Source of the independent gallbladder-cancer expression dataset used for expression-level validation. |
| Gene Ontology (GO) | Gene Ontology Consortium | Online knowledgebase; https://geneontology.org/ | Biological Process, Cellular Component, and Molecular Function enrichment annotation. |
| Genomic Data Commons Data Portal (TCGA-CHOL) | National Cancer Institute, NIH | TCGA-CHOL; https://portal.gdc.cancer.gov/ | Source of RNA-sequencing expression data and clinical information for the exploratory discovery/prognostic cohort. |
| GEOquery | Bioconductor | R package; exact version not reported; https://bioconductor.org/packages/GEOquery/ | Retrieval and import of GEO expression datasets into R. |
| ggplot2 | CRAN / Posit, PBC | R package; exact version not reported; https://cran.r-project.org/package=ggplot2 | Volcano plots and other statistical graphics. |
| glmnet | CRAN; Friedman, Hastie, Tibshirani, and collaborators | R package; exact version not reported; https://cran.r-project.org/package=glmnet | Least absolute shrinkage and selection operator Cox regression for prognostic feature selection. |
| ImmPort | National Institute of Allergy and Infectious Diseases, NIH | Online database; https://www.immport.org/ | Source of curated immune-related gene lists. |
| InnateDB | InnateDB Consortium | Online database; https://www.innatedb.com/ | Source of curated innate-immunity and immune-related gene information. |
| Kyoto Encyclopedia of Genes and Genomes (KEGG) | Kanehisa Laboratories | Online database; https://www.genome.jp/kegg/ | Pathway annotation used for enrichment analysis and gene-set interpretation. |
| limma | Bioconductor | R package; exact version not reported; https://bioconductor.org/packages/limma/ | Analysis of processed/normalized expression data and differential-expression analysis where appropriate. |
| MCODE | Cytoscape App Store / Bader Laboratory | Cytoscape app; exact version not reported; https://apps.cytoscape.org/apps/mcode | Identification of densely connected functional modules in the interaction network. |
| Molecular Signatures Database (MSigDB) | Broad Institute and University of California San Diego | Online database; https://www.gsea-msigdb.org/gsea/msigdb/ | Source of immune-related, Hallmark, and KEGG gene sets used for enrichment analyses. |
| pheatmap | CRAN | R package; exact version not reported; https://cran.r-project.org/package=pheatmap | Heatmap generation and hierarchical-clustering visualization. |
| R statistical software | R Foundation for Statistical Computing | Version 4.3.2; https://www.r-project.org/ | Data preprocessing, statistical analysis, modeling, and visualization. |
| Rtsne | CRAN | R package; exact version not reported; https://cran.r-project.org/package=Rtsne | t-distributed stochastic neighbor embedding for visualization of high- and low-risk groups. |
| STRING | STRING Consortium | Version 11.5; https://string-db.org/ | Construction of the protein–protein interaction network using a minimum interaction confidence score greater than 0.7. |
| survival | CRAN; Terry M. Therneau and collaborators | R package; exact version not reported; https://cran.r-project.org/package=survival | Cox proportional-hazards regression, Kaplan–Meier analysis, and survival-model procedures. |
| survivalROC | CRAN | R package; exact version not reported; https://cran.r-project.org/package=survivalROC | Generation of time-dependent receiver operating characteristic curves at 1, 3, and 5 years. |
| survminer | CRAN | R package; exact version not reported; https://cran.r-project.org/package=survminer | Visualization of Kaplan–Meier survival curves and survival-analysis outputs. |
| sva / ComBat | Bioconductor | R package; exact version not reported; https://bioconductor.org/packages/sva/ | Batch-effect adjustment using the ComBat function when datasets were combined. |
| TIMER 2.0 | TIMER / Cistrome computational biology team | Version 2.0; https://compbio.cn/timer2/ | Assessment of associations between hub-gene expression and immune-cell infiltration. |
المراجع
- Hundal R, Shaffer EA. Gallbladder cancer: epidemiology and outcome. Clin Epidemiol. 2014;6:99-109.
- Sung H, et al. Global cancer statistics 2020: GLOBOCAN estimates of incidence and mortality worldwide for 36 cancers in 185 countries. CA Cancer J Clin. 2021;71(3):209–249. doi:10.3322/caac.21660.
- Dwivedi AND, Jain S, Dixit R. Gall bladder carcinoma: Aggressive malignancy with protean loco-regional and distant spread. World J Clin Cases. 2015;3(3):231–244. doi:10.12998/wjcc.v3.i3.231.
- Sharma A, Sharma KL, Gupta A, Yadav A, Kumar A. Gallbladder cancer epidemiology, pathogenesis and molecular genetics: Recent update. World J Gastroenterol. 2017;23(22):3978-3998.
- Valle JW, Kelley RK, Nervi B, Oh DY, Zhu AX. Biliary tract cancer. Lancet. 2021;397(10272):428-44.
- Rizvi S, Khan SA, Hallemeier CL, Kelley RK, Gores GJ. Cholangiocarcinoma and gallbladder cancer: immunobiology and potential immunotherapy. Nat Rev Gastroenterol Hepatol. 2018;15(3):138-50.
- Nan L, et al. ARID1A downregulation predicts high PD-L1 expression and worse clinical outcome in patients with gallbladder cancer. Front Oncol. 2022;12:787897.
- Hanahan D, Weinberg RA. Hallmarks of cancer: the next generation. Cell. 2011;144(5):646-74.
- Newman AM, et al. Robust enumeration of cell subsets from tissue expression profiles. Nat Methods. 2015;12(5):453-7.
- Tang Z, Kang B, Li C, Chen T, Zhang Z. GEPIA2: enhanced web server for large-scale expression profiling and analysis. Nucleic Acids Res. 2019;47(W1):W556-60.
- Szklarczyk D, et al. STRING v11: protein–protein association networks with increased coverage, supporting functional discovery in genome-wide experimental datasets. Nucleic Acids Res. 2019;47(D1):D607-13.
- Yu G, Wang LG, Han Y, He QY. ClusterProfiler: an R package for comparing biological themes among gene clusters. OMICS. 2012;16(5):284-7.
- Tibshirani R. Regression shrinkage and selection via the Lasso. J R Stat Soc Series B. 1996;58(1):267-88.
- Cox DR. Regression models and life tables. J R Stat Soc Series B. 1972;34(2):187-220.
- Nepal C, et al. Integrative molecular characterisation of gallbladder cancer reveals micro-environment-associated subtypes. J Hepatol. 2021;74(5):1132-1144.
- Koshiol J, et al. Association of inflammatory and other immune markers with gallbladder cancer: Results from two independent case-control studies. Cytokine. 2016;83:217–225.
- Boilève A, et al. Immunotherapy in Advanced Biliary Tract Cancers. Cancers (Basel). 2021;13(7):1569.
- Goeppert B, et al. Prognostic impact of tumour-infiltrating immune cells on biliary tract cancer. Br J Cancer. 2013;109(10):2665-74.
- Li M, et al. Genomic ERBB2/ERBB3 mutations promote PD-L1-mediated immune escape in gallbladder cancer: a whole-exome sequencing analysis. Gut. 2019;68(6):1024–1033.
- Hussain S, et al. The roles of stroma-derived chemokine in different stages of cancer metastases. Front Immunol. 2020;11:598532.
- Bosch DE, et al. Neutrophilic inflammation in gallbladder carcinoma correlates with patient survival: A case-control study. Ann Diagn Pathol. 2022;56:151845.
- Miura T, et al. Prognostic impact of CD163+ macrophages in tumor stroma and CD8+ T-cells in cancer cell nests in invasive extrahepatic bile duct cancer. Anticancer Res. 2017;37(1):183–190.
- Chen P, et al. Diversity and intratumoral heterogeneity in human gallbladder cancer progression revealed by single-cell RNA sequencing. Clin Transl Med. 2021;11(6):e462.
- Marin JJG, et al. Current and novel therapeutic opportunities for systemic therapy in biliary cancer. Br J Cancer. 2020;123(7):1047–1059.
- Nakamura H, et al. Genomic spectra of biliary tract cancer. Nat Genet. 2015;47(9):1003–1010.
- Du X, et al. Correlation between MMP1-PAR1 axis and clinical outcome of primary gallbladder carcinoma. Jpn J Clin Oncol. 2011;41(9):1086–1093
- Sreejit G, et al. S100 family proteins in inflammation and beyond. Adv Clin Chem. 2020;98:173–231.
- Zhao X,et al. Identification of LIFR, PIK3R1, and MMP12 as novel prognostic signatures in gallbladder cancer using network-based module analysis. Front Oncol. 2019;9:325.
- Huang D, et al. Association between gallstones and the risk of biliary tract cancer: a systematic review and meta-analysis. Epidemiol Health. 2021;43.
- Du XZ, Wen B, Liu L, Wei YT, Zhao K. Role of immune escape in different digestive tumours. World J Clin Cases. 2021;9(34):10438–10450.
- He H, et al. Comprehensive single-cell analysis deciphered microenvironmental dynamics and immune regulator olfactomedin 4 in pathogenesis of gallbladder cancer. Gut. 2024;73(9):1529–1542.
- He Z, et al. Single-cell analyses unravel ecosystem dynamics and intercellular crosstalk during gallbladder cancer malignant transformation. Hepatology Communications. 2025;9(6).
- Love MI, Huber W, Anders S. Moderated estimation of fold change and dispersion for RNA-seq data with DESeq2. Genome Biology. 2014;15:550.
- Ritchie ME, et al. limma powers differential expression analyses for RNA-sequencing and microarray studies. Nucleic Acids Research. 2015;43(7):e47.