A comparison of clinical outcomes between Unilateral Biportal Endoscopy (UBE) and Open Unilateral Laminotomy with Bilateral Decompression (ULBD) in individuals with lumbar spinal stenosis suggested that both procedures were associated with meaningful clinical improvement. UBE showed favorable early recovery trends and may be an effective minimally invasive option.
مقالة بحثية
Retrospective Analysis of Unilateral Biportal Endoscopy Versus Open Laminotomy for Lumbar Spinal Stenosis
في هذه المقالة
ملخص
الملخص
Lumbar spinal stenosis is a common degenerative condition that causes pain, disability, and reduces quality of life, especially in older adults. Techniques such as Unilateral Biportal Endoscopy (UBE) and Open Unilateral Laminotomy with Bilateral Decompression (ULBD) aim to preserve soft tissues while achieving adequate decompression of neural tissue. The study included 194 patients with symptomatic degenerative lumbar spinal stenosis, of whom 177 patients underwent UBE and 17 patients underwent Open ULBD. Clinical outcomes were measured with the visual analog scale (VAS) for pain, the Oswestry Disability Index (ODI) for functional impairment, and the Japanese Orthopedic Association (JOA) score for neurological recovery before surgery and at 1 week, 1 month, 3 months, 6 months, 1 year, and 2 years after surgery. For both groups, there was a significant difference between baseline and 2 years. We hypothesized that UBE would lead to faster early postoperative recovery while yielding similar long-term outcomes. VAS decreased from 7.06 to 0.67 in the Open ULBD group and from 6.81 to 0.56 in the UBE group. ODI improved from 62.65 to 21.56 in the UBE group and from 66.82 to 24.33 in the Open ULBD group, while JOA increased from 11.91 to 24.89 and from 11.24 to 23.83, respectively. The UBE group had numerically lower estimated blood loss (80.11 ± 45.14 vs. 152.35 ± 125.67 mL) and a shorter hospital stay (12.50 ± 5.73 vs. 15.29 ± 5.47 days), while operative time was similar between groups (129.09 ± 64.88 vs. 130.18 ± 74.37 min). Findings suggested that UBE surgery demonstrated favorable early recovery and improving trends in neurological function, and may represent an effective, minimally invasive option. Future studies should use larger, more balanced cohorts to validate these findings and long-term outcomes.
المقدمة
Lumbar spinal stenosis (LSS) is one of the most common degenerative conditions of the spine and one of the most common causes of pain, disability, and loss of mobility, especially in the middle-aged and elderly1,2. It is a degenerative disorder that causes the central canal (spinal canal) and/or the lateral recesses (neural foramina) of the spine to narrow, leading to mechanical compression of the nervous elements and neurovascular dysfunction in the lumbar spine1,2. The common symptoms are lower back pain, with or without leg pain (radicular), and sensory disturbances (numbness, weakness of motor function, and neurogenic intermittent claudication)1,2,3,4.
The pathophysiology of LSS is multifactorial and complex, comprising several degenerative changes, including intervertebral disc degeneration, loss of disc height, segmental instability, facet joint hypertrophy, osteophyte formation, and thickening of the ligamentum flavum4,5,6. Changes are more apparent when standing and walking and are eased by flexing the lumbar spine and sitting1,2,7. This multifactorial nature explains why clinical severity is seldom correlated with radiologic static imaging only, and a diagnostic approach involving both anatomic and functional aspects is justified. Nonoperative treatment is generally the initial management approach and may include physical therapy, activity modification, pharmacotherapy, and epidural injections3,8,9. Under these conditions, decompression surgery is the most common procedure to relieve neural compression, restore segmental stability, and restore mobility3,4.
The traditional open laminectomy provides good neural decompression. Still, it involves a large amount of soft tissue disruption and extensive detachment of paraspinal muscles, bone removal, and recovery periods that may be longer and lead to iatrogenic instability and more postoperative pain10,11. There have been some improvements in minimally invasive decompression techniques that use a small incision, addressing these limitations. Unilateral Endoscopic Surgery (UES) is a single-portal technique. At the same time, UBE Surgery is a two-portal technique with two portals for viewing and working (with saline irrigation), providing high magnification, flexible working angles, and improved visualization of neural and bony structures, with reduced tissue trauma12,13,14,15,16.
Open ULBD, which is truly a mini-open approach with direct vision, may offer a tissue-sparing mini-open approach without any particular endoscopic instrumentation, with a lesser extent of muscle stripping compared with open laminectomy14,17. For assessing pain, the VAS is highly sensitive for measuring pain intensity; for physical disability, the ODI is a validated instrument; and for neurological recovery, the JOA score provides comprehensive quantification of functional and neurological status after diagnosis of lumbar spinal stenosis18,19,20. While there has been a rise in the popularity of minimally invasive spine surgery, there is not much direct comparative evidence comparing UBE vs. Open ULBD. They can both relieve nerve pressure without significant tissue damage. Still, they differ significantly in how they are performed, the complexity of the procedure, and instrumentation requirements.
The literature consists largely of comparisons of UBE with conventional open or microscopic decompression procedures; however, longitudinal evidence directly comparing UBE with Open ULBD across serial follow-up intervals remains limited15,16,17. The current study aims to compare UBE with Open ULBD using standardized VAS, ODI, and JOA scores in a cohort of patients with degenerative lumbar spinal stenosis over a 2 year period. Both surgical techniques were expected to yield significant long-term clinical improvement; however, we hypothesized that UBE would provide superior early postoperative pain relief and earlier neurological recovery because it reduced disruption of posterior musculoligamentous and paraspinal structures16,17,18,19,20.
Study novelty
In patients with lumbar spinal stenosis, we evaluated a combined assessment of pain severity (Visual Analog Scale [VAS]), functional impairment (Oswestry Disability Index [ODI]), and neurologic improvement (Japanese Orthopedic Association [JOA]) scores for UBE compared with Open ULBD. Previous studies primarily compared UBE with conventional open laminectomy, microscopic decompression, and other minimally invasive decompression techniques21,22,23,24,25. However, longitudinal evidence directly comparing UBE with Open ULBD across repeated postoperative assessments remains limited. The present study, therefore, evaluates the recovery trajectories of VAS, ODI, and JOA within the same clinical setting from the preoperative assessment through 2 years of follow-up. This longitudinal observational comparison provides complementary real-world evidence regarding early and long-term recovery patterns following the two procedures. It may support more specific surgical decision-making for degenerative lumbar spinal stenosis21,22,23,24,25.
البروتوكول
This study adhered to the Declaration of Helsinki and was approved by the Sixth Division Hospital Medical Ethics Committee (Approval Number: LLSH-2024-10-106). Medical records were reviewed, and the required clinical information was retrieved retrospectively. Data analysis was conducted after the institutional medical ethics committee reviewed and approved the study. There was no requirement for informed consent in this retrospective study, as it used completely anonymized patient information collected as part of routine clinical practice and in compliance with institutional regulations8,9.
Study design and population
This is an observational study of a real-world patient population with degenerative lumbar spine stenosis (LSS) who were treated with minimally invasive surgery (MIS) for lumbar spine decompression from June 2023 to December 2025. A total of 194 patients with medical records that met the set inclusion criteria were included in this study, of which 177 were treated with Unilateral Biportal Endoscopy (UBE), and 17 were treated with Open Unilateral Laminotomy with Bilateral Decompression (Open ULBD)10.
Inclusion and exclusion criteria
The inclusion criteria included an MRI or CT diagnosis of lumbar stenosis, complete baseline data, and a diagnosis of lumbar stenosis that required limited conservative treatment for 3 months before surgery. Patients were excluded from the analysis if they had dynamic instability, high-grade listhesis, fracture, tumor, infection, or prior index-level spinal surgery, or if they lacked clinical outcome scores at baseline and/or 12 months. Patients with an alternative primary endpoint, such as death before the required follow-up assessment, were also excluded.
Surgical procedures
Under general anesthesia, the patient was placed in a prone position for UBE. Two skin incisions 1.0 cm long were made under fluoroscopic guidance, 1.5–2.0 cm lateral to the midline. Saline irrigation was performed at a pressure of 30–40 mmHg. V-shaped laminotomy was carried out on the same side with the use of Kerrison rongeurs and a high-speed diamond burr. The endoscope was advanced medially, and subsequently, over-the-top contralateral decompression and removal of the ligamentum flavum were performed. Radiofrequency electrocautery was used to achieve hemostasis, and a suction drain was placed; the wound was closed. The Open ULBD was performed using a midline approach in the back with a 2–3 cm incision. Care was taken to dissect the paraspinal muscles away from the bone to expose the lamina to which the laminectomy was to be performed. Intervertebral disc visualization (IDV) was performed, and then an ipsilateral laminotomy was performed, and undercutting of the contralateral lateral recess and the central canal was done. Identification of the ligamentum flavum was made, and the dura was exposed with the insertion of a suction drain and layered closure of the wound (Figure 1).
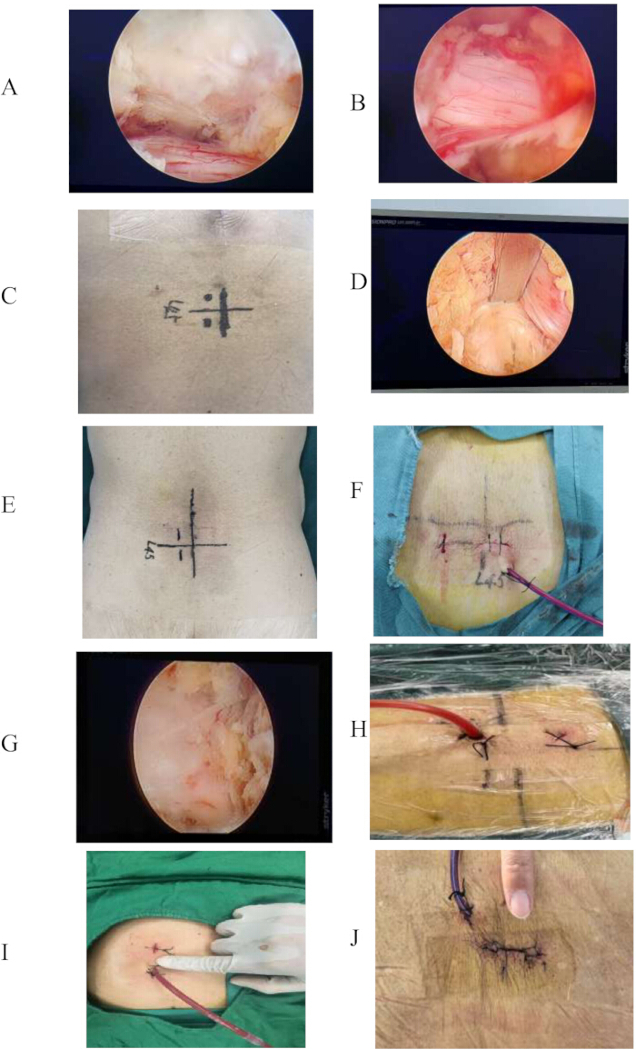
Figure 1: Representative intraoperative images of unilateral biportal endoscopic decompression. (A) Endoscopic view of the initial working space. (B) Following partial decompression. (C) Preoperative surface marking of the surgical level. (D) Endoscopic view of the decompressed lateral recess. (E) Preoperative marking of the L4–5 level. (F) Intraoperative view of the working and viewing portals. (G) Endoscopic view of the decompressed central canal and lateral recess. (H) Closure of the viewing and working portals. (I) Close-up view of the sutured portal incisions. (J) Postoperative appearance of the working portal incision. Please click here to view a larger version of this figure.
Outcome measures and scoring rubrics
Preoperatively and at 1 week, 1 month, 3 months, 6 months, 1 year, and 2 years postoperatively, clinical parameters were measured. The 10-point Visual Analog Scale (VAS) was used to assess pain intensity; see Supplementary Table S1 for the VAS. Physical impairment was measured by the Oswestry Disability Index (ODI): (Total Points Earned/Total Possible Points) × 100, as outlined in Supplementary Table S1. The 29-point Japanese Orthopedic Association (JOA) score (Supplementary Table S1) was used to assess neurological recovery. An improvement in symptoms (lower VAS and/or ODI scores) was considered evidence of improvement. In comparison, neurological restoration (higher JOA score) was considered evidence of greater value.
Blinding and bias minimization
Due to the special circumstances of UBE and Open ULBD, it was not possible for the operating surgeons to blind-treat the cases. To minimize assessment bias, independent clinical outcome assessors extracted follow-up data from medical records while masked to patients' surgical intervention types during data collection and preliminary scoring. Furthermore, a standardized perioperative analgesic protocol was offered to all patients of both groups, aiming to reduce the potential confounding effect of early postoperative pain assessment.
Statistical analysis and handling of sample size disparity
IBM SPSS Statistics (version 27.0; RRID: SCR_019096) was used to perform statistical analyses, and Figures were generated with GraphPad Prism (version 9.0; RRID: SCR_002798). The distributions of the VAS, ODI, and JOA (continuous variables measured) were tested for normality in the UBE (n = 177) and Open ULBD (n = 17) groups, given the large difference in sample size. Data are presented as means ± SD or medians (IQR) (for data that are not normally distributed). All group comparisons at different time points relative to the initial time point were performed using ANOVA with Bonferroni post hoc tests or the nonparametric Wilcoxon signed-rank test. For the specific time points, a Welch's independent-samples t-test and a nonparametric Mann-Whitney U test were used to evaluate between-group differences. Pearson's Chi-Square Test or Fisher's exact test was performed to compare categorical demographic variables, as appropriate. A two-tailed p-value < 0.05 was considered statistically significant13,14,15. Perioperative variables were analyzed using data from the available cases in between-group analyses. The availability of operative time, hospital stay, hospitalization costs, and other perioperative variables varied across the retrospective records.
Handling of missing data
The primary analytical cohort excluded patients without clinical scores at baseline and/or at 12 months, including patients who could not contribute the required follow-up assessment because of an alternative clinical endpoint, such as death. No intermediate follow-up data points were missing among the included patients. Perioperative variables with incomplete retrospective data were analyzed using available-case analysis, without single- or multiple-imputation.
Workflow:
The protocol provides detailed experimental design and surgical procedures, clinical assessment methods, and statistical analyses to compare the results of Unilateral Biportal Endoscopy (UBE) with those of Open Unilateral Laminotomy with Bilateral Decompression (Open ULBD) in patients with DLSS. All procedures were performed using standard surgical instruments, automated irrigation systems, validated Patient-Reported Outcome instruments, and specially designed statistical software packages, as outlined in the Table of Materials. Figure 2 summarizes the entire study workflow, including patient identification, eligibility assessment, group allocation, surgical procedures, follow-up, outcome assessment, and data analysis.
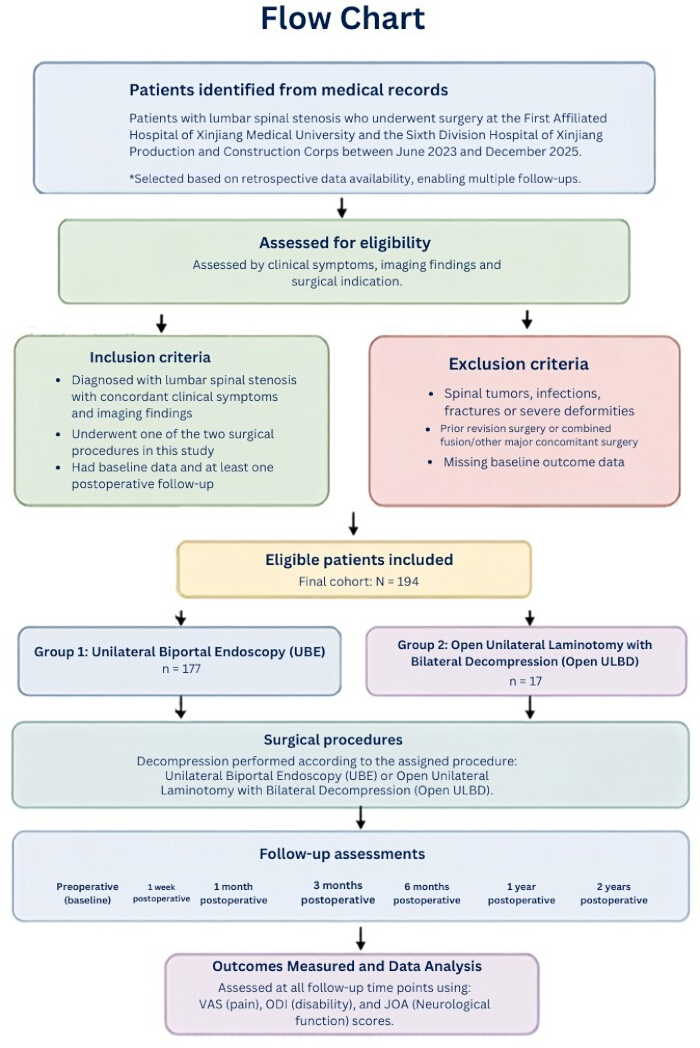
Figure 2: Study workflow and patient selection. Schematic overview of patient identification, eligibility assessment, inclusion and exclusion criteria, allocation to UBE group (n = 177) or Open ULBD (n = 17), surgical procedures, postoperative follow-up, clinical outcome assessment by VAS, ODI, and JOA scores, and data analysis. The study period was from June 2023 to December 2025. Abbreviations: UBE = Unilateral Biportal Endoscopy; VAS = visual analog scale; ODI = Oswestry Disability Index; JOA = Japanese Orthopedic Association; ULBD = Unilateral Laminotomy with Bilateral Decompression. Please click here to view a larger version of this figure.
النتائج
Baseline characteristics, perioperative outcomes, and complications of the study population
Demographic and clinical data for the two study groups are identified in Supplementary Table S2 and are summarized in Table 1. In total, 194 patients (177 treated with Unilateral Biportal Endoscopy (UBE) and 17 with Open ULBD) were analyzed. The mean age for the UBE group was 61.8 ± 8.5 years, and for the Open ULBD group was 63.2 ± 7.9 years. The sex ratio of the UBE group was relatively balanced (102 men and 75 women), whereas the Open ULBD group was imbalanced (10 men and 7 women).
There was a significant degree of pain, neurologic impairment, and functional disability in both groups preoperatively. Before surgery, the mean VAS scores for the endoscopic and decompression groups were 6.81 and 7.06, respectively. The corresponding mean preoperative ODI scores were 62.65 ± 8.94 and 66.82 ± 9.21, while the mean preoperative JOA scores were 11.91 ± 2.10 and 11.24 ± 2.05, respectively. There was no statistically significant baseline difference in the evaluated demographic and clinical parameters, although the Open ULBD group had numerically higher preoperative pain and disability scores. Data on operative time were available for 121 patients in the UBE group and 17 patients in the open ULBD group. Mean operative time was 129.09 ± 64.88 min in the UBE group and 130.18 ± 74.37 min in the Open ULBD group. There was no significant difference between groups (P = 0.982).
Data on estimated blood loss were available for 177 patients in the UBE group and 17 patients in the Open ULBD group. The mean estimated blood loss was 80.11 ± 45.14 mL in the UBE group and 152.35 ± 125.67 mL in the Open ULBD group. Although estimated blood loss was numerically lower in the UBE group, the between-group difference was not statistically significant (P = 0.147). Length of hospital stay was available for 121 patients undergoing UBE and 17 patients undergoing Open ULBD. Mean hospital stay was 12.50 ± 5.73 days in the UBE group and 15.29 ± 5.47 days in the Open ULBD group.
Postoperative complications were observed in 3/177 patients (1.7%) in the UBE group and 2/17 patients (11.8%) in the Open ULBD group. The UBE complications included 1 cerebrospinal fluid leak and 2 postoperative pulmonary infections, and the Open ULBD group included 1 cerebrospinal fluid leak and 1 secondary surgery. Fisher's exact test showed no significant difference in complication rates.
| Variable | Endoscopic Group (n=177) | Decompression Group (n=17) | Interpretation |
| Age (years, mean ± SD) | 61.8 ± 8.5 | 63.2 ± 7.9 | Numerically similar |
| Sex (M/F) | 102 / 75 | 10-Jul | Numerically similar |
| Preoperative VAS | 6.81 ± 1.12 | 7.06 ± 1.05 | Small-incision group slightly higher |
| Preoperative ODI | 62.65 ± 8.94 | 66.82 ± 9.21 | Small-incision group slightly higher |
| Preoperative JOA | 11.91 ± 2.10 | 11.24 ± 2.05 | Small-incision group slightly lower |
| Operative time (min) | 129.09 ± 64.88 | 130.18 ± 74.37 | P= 0.982 |
| Estimated blood loss (mL) | 80.11 ± 45.14 | 152.35 ± 125.67 | P= 0.147 |
| Hospital stays (days) | 12.50 ± 5.73 | 15.29 ± 5.47 | P= 0.025 |
| Any complication, n (%) | 3 (1.7%) | 2 (11.8%) | P= 0.062 |
Table 1: Baseline demographics, clinical characteristics, and comparison of perioperative outcomes and postoperative complications between UBE and open ULBD. Abbreviations: UBE = Unilateral Biportal Endoscopy; VAS = visual analog scale; ODI = Oswestry Disability Index; JOA = Japanese Orthopedic Association; ULBD = Unilateral Laminotomy with Bilateral Decompression.
Clinical outcome trends
Table 2 and Figure 3, Figure 4, and Figure 5 present the results for changes in postoperative pain; both groups demonstrated clinically meaningful postoperative improvement. In the UBE group, VAS was 6.81 preoperatively, and 2.34 and 0.56 at 1 week and 2 years, respectively. In the Open ULBD group, VAS decreased from 7.06 to 3.47 at 1 week and to 0.67 at 2 years. Therefore, early pain relief was demonstrated after endoscopic surgery, but long-term pain values were similarly low. In the UBE group, ODI improved from 62.65 to 21.56 at 2 years, and in the Open ULBD group, it improved from 66.82 to 24.33. JOA improved from 11.91 to 24.89 in the UBE group and from 11.24 to 23.83 in the Open ULBD group. Both groups showed improvement over time after surgery.
| Time point | VAS Endoscopic | VAS Small-incision | ODI Endoscopic | ODI Small-incision | JOA Endoscopic | JOA Small-incision |
| Preoperative | 6.81 ± 1.12 | 7.06 ± 1.05 | 62.65 ± 8.94 | 66.82 ± 9.21 | 11.91 ± 2.10 | 11.24 ± 2.05 |
| 1 week | 2.34 ± 0.95 | 3.47 ± 1.10 | 51.37 ± 7.85 | 53.18 ± 8.10 | 16.96 ± 2.30 | 14.71 ± 2.40 |
| 1 month | 1.46 ± 0.72 | 1.88 ± 0.80 | 43.06 ± 6.72 | 44.59 ± 7.01 | 19.80 ± 2.15 | 18.76 ± 2.20 |
| 3 months | 0.80 ± 0.55 | 1.18 ± 0.60 | 30.26 ± 5.40 | 31.29 ± 5.60 | 22.12 ± 1.85 | 21.65 ± 1.90 |
| 6 months | 0.58 ± 0.40 | 0.71 ± 0.45 | 23.81 ± 4.30 | 25.41 ± 4.80 | 23.74 ± 1.60 | 22.82 ± 1.75 |
| 1 year | 0.53 ± 0.35 | 0.47 ± 0.30 | 19.95 ± 3.95 | 22.93 ± 4.10 | 24.66 ± 1.45 | 23.60 ± 1.55 |
| 2 years | 0.56 ± 0.38 | 0.67 ± 0.42 | 21.56 ± 4.10 | 24.33 ± 4.50 | 24.89 ± 1.30 | 23.83 ± 1.40 |
Table 2: Clinical outcome scores over time. Abbreviations: VAS = visual analog scale; ODI = Oswestry Disability Index; JOA = Japanese Orthopedic Association.
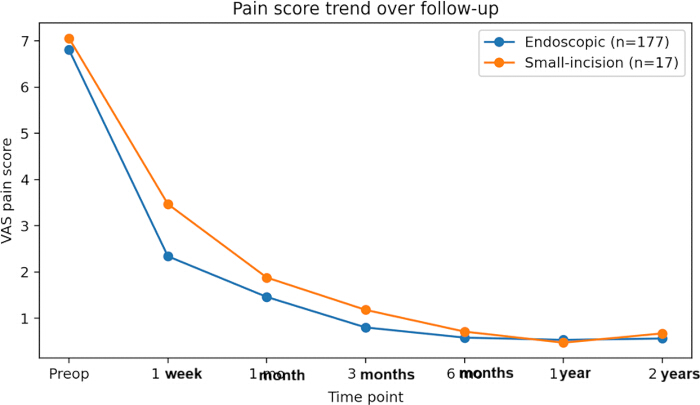
Figure 3: VAS pain score trend. VAS scores from baseline to postoperative follow-up in the UBE group (n = 177) and the Open ULBD group (n = 17). Lower VAS score values indicate decreasing pain. Abbreviations: UBE = Unilateral Biportal Endoscopy; VAS = visual analog scale; ULBD = Unilateral Laminotomy with Bilateral Decompression. Please click here to view a larger version of this figure.
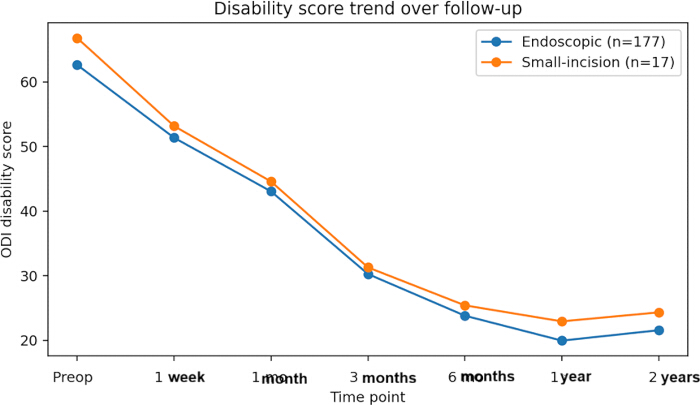
Figure 4: ODI disability trend. Changes in ODI scores from baseline to postoperative follow-up in the UBE group (n = 177) and Open ULBD (n = 17). Lower ODI score values reflect improvement in functional condition. Abbreviations: ODI = Oswestry Disability Index; UBE = Unilateral Biportal Endoscopy; ULBD = Unilateral Laminotomy with Bilateral Decompression. Please click here to view a larger version of this figure.
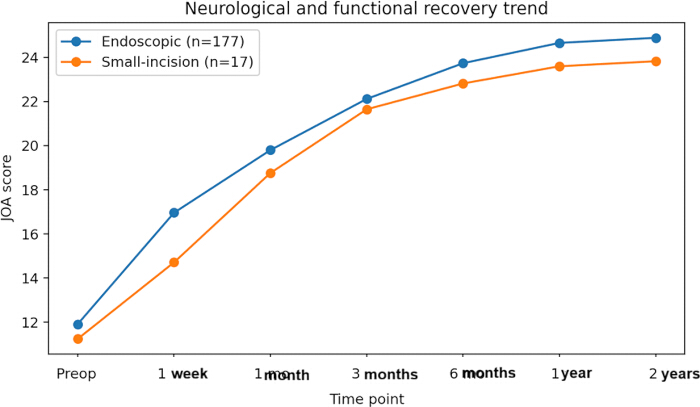
Figure 5: JOA recovery trend. JOA ratings from baseline through postoperative follow-up in the UBE group (n = 177) and Open ULBD (n = 17). Higher JOA scores indicate improvement in neurologic and functional health. Abbreviations: UBE = Unilateral Biportal Endoscopy; JOA = Japanese Orthopedic Association; ULBD = Unilateral Laminotomy with Bilateral Decompression. Please click here to view a larger version of this figure.
Within-group analysis over time
For all three outcome measures, within-group postoperative improvements were observed from baseline through long-term follow-up in both groups. The VAS and ODI scores decreased over time, and the JOA score increased, indicating clinical improvement after surgery. Figure 6 compares baseline and 2 year postoperative outcomes. In contrast, JOA scores increased, indicating postoperative clinical improvement.
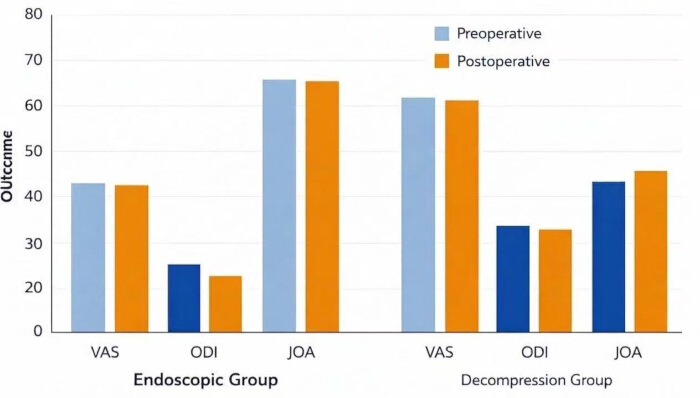
Figure 6: Preoperative versus postoperative outcomes within each group. Comparison of VAS, ODI, and JOA scores between baseline and postoperative follow-up in both surgery groups. Abbreviations: VAS = visual analog scale; ODI = Oswestry Disability Index; JOA = Japanese Orthopedic Association. Please click here to view a larger version of this figure.
Between-group outcome analysis
Between-group differences at all follow-ups are presented in Table 3. Baseline differences in VAS, ODI, and JOA were not significant, consistent with preoperative comparability. At 1 week, there were statistically significant between-group differences in VAS and JOA, but not in ODI. Numerical differences favoring the UBE group were observed, with improvements in pain and JOA recovery at 1 and 3 months. Most differences were smaller at 6 months, 1 year, and 2 years, indicating that long-term outcomes were similar across the two procedures. Most between-group differences diminished during long-term follow-up, although ODI remained significantly lower in the UBE group at 1 year; no significant between-group differences in VAS, ODI, or JOA were observed at 2 years.
| Time point | VAS (p-value) | ODI (p-value) | JOA (p-value) |
| Preoperative | 0.21 | 0.18 | 0.24 |
| 1 Week | 0.001 | 0.09 | 0.002 |
| 1 Month | 0.03 | 0.12 | 0.04 |
| 3 Months | 0.02 | 0.15 | 0.06 |
| 6 Months | 0.08 | 0.2 | 0.09 |
| 1 Year | 0.25 | 0.04 | 0.05 |
| 2 Years | 0.18 | 0.06 | 0.07 |
Table 3: Between-group comparison at each time point. Abbreviations: VAS = visual analog scale; ODI = Oswestry Disability Index; JOA = Japanese Orthopedic Association.
Long-term outcome trends
Long-term outcomes at first- and second-year follow-up were also evaluated. Both groups demonstrated sustained postoperative improvement during long-term follow-up. The UBE group showed a small numerical improvement in long-term ODI/JOA scores, while both groups had low VAS scores. These results indicate that both surgeries are associated with long-term symptom relief and improved functional outcomes, but the endoscopic technique appears to be associated with earlier postoperative recovery.
Both surgical groups showed considerable improvement in pain, functional impairment, and neurological recovery at follow-up. The Unilateral Biportal Endoscopy (UBE) group showed more favorable early postoperative recovery, notably in VAS and JOA ratings. The differences between groups diminished over time. Results suggest that both treatments were associated with sustained clinical improvement and that Unilateral Biportal Endoscopy (UBE) may have an early recovery advantage.
Radiological characteristics
Preoperative imaging was reviewed to confirm lumbar spinal canal, lateral recess, or foraminal stenosis correlating with the patient's clinical symptoms. The levels recorded for both groups are presented in Table 4. Patients with dynamic instability or high-grade (> Grade I) spondylolisthesis were excluded according to the predefined exclusion criteria. Representative preoperative and postoperative MRI findings are shown in Figure 7, Figure 8, and Figure 9. An examination of the operated lumbar levels and existing preoperative diagnostic data was conducted; however, standardized quantitative assessments of stenosis severity, dural sac cross-sectional area, foraminal dimensions, and segmental instability were not uniformly available in the retrospective cohort. Consequently, these indicators were not amenable to quantitative comparison between the two surgery cohorts.
| Characteristic | UBE, n (%) | Open ULBD, n (%) |
| Operated lumbar level* | ||
| L2–L3 | 5 (4.1%) | 1 (5.9%) |
| L3–L4 | 18 (14.9%) | 7 (41.2%) |
| L4–L5 | 72 (59.5%) | 14 (82.4%) |
| L5–S1 | 37 (30.6%) | 2 (11.8%) |
| Spinal stenosis | 44 (36.4%) | 8 (47.1%) |
| Grade I degenerative spondylolisthesis | 1 (0.8%) | 0 |
| Osteoporosis | 0 | 1 (5.9%) |
Table 4: Operated lumbar levels and available preoperative diagnostic characteristics. Patients could have more than one operated lumbar level; percentages are based on patients with available operative-level data. Abbreviations: UBE = Unilateral Biportal Endoscopy; ULBD = Unilateral Laminotomy with Bilateral Decompression.
The preoperative records reported the lumbar levels operated on and the associated diagnostic findings. L4–L5 was the most frequently operated level in both groups. However, standardized quantitative measures of stenosis severity, dural sac cross-sectional area, foraminal dimensions, and segmental instability were not uniformly available in the retrospective cohort.
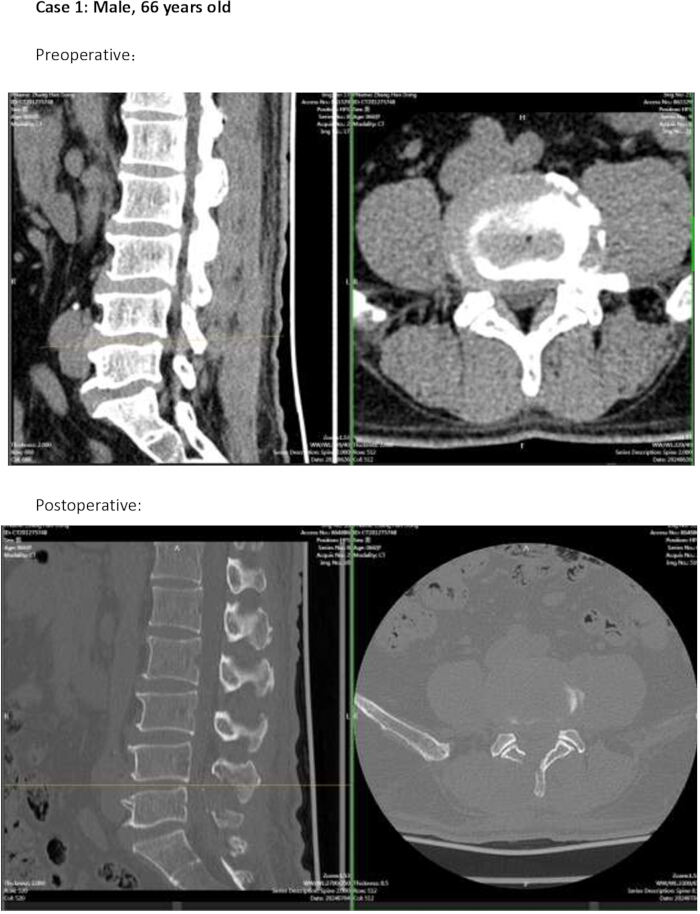
Figure 7: Representative preoperative and postoperative lumbar MRI of Case 1, a 66-year-old male. (A) Preoperative sagittal and axial MRI demonstrating lumbar spinal canal stenosis. (B) Postoperative sagittal and axial MRI demonstrating increased available spinal canal space following decompression. Abbreviation: MRI = magnetic resonance image. Please click here to view a larger version of this figure.
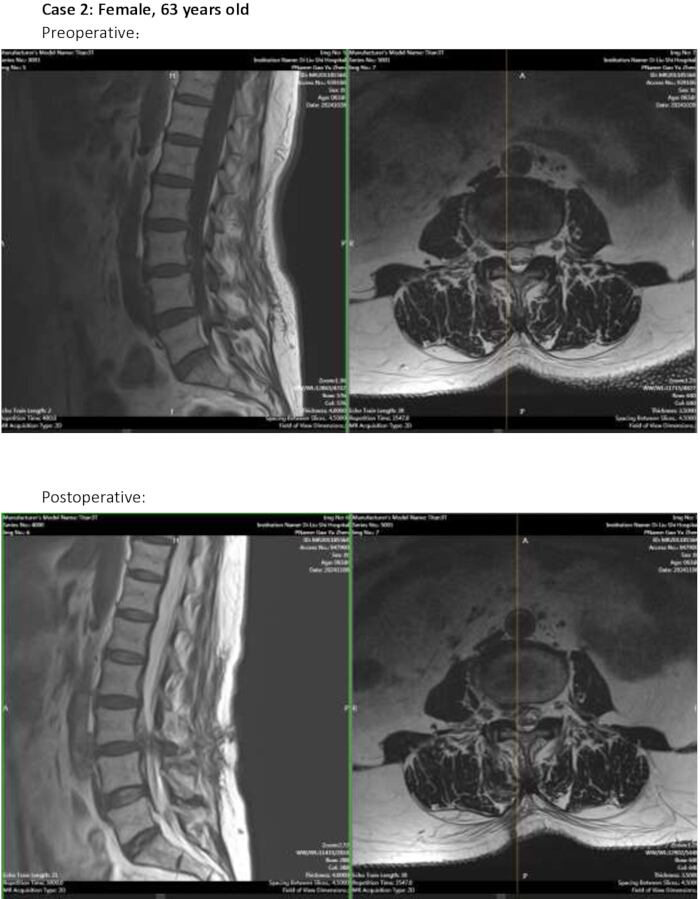
Figure 8: Representative preoperative and postoperative lumbar MRI of Case 2, a 63-year-old female. (A) Preoperative sagittal and axial MRI demonstrating lumbar spinal canal stenosis. (B) Postoperative sagittal and axial MRI demonstrating increased available spinal canal space following decompression. Abbreviation: MRI = magnetic resonance image. Please click here to view a larger version of this figure.
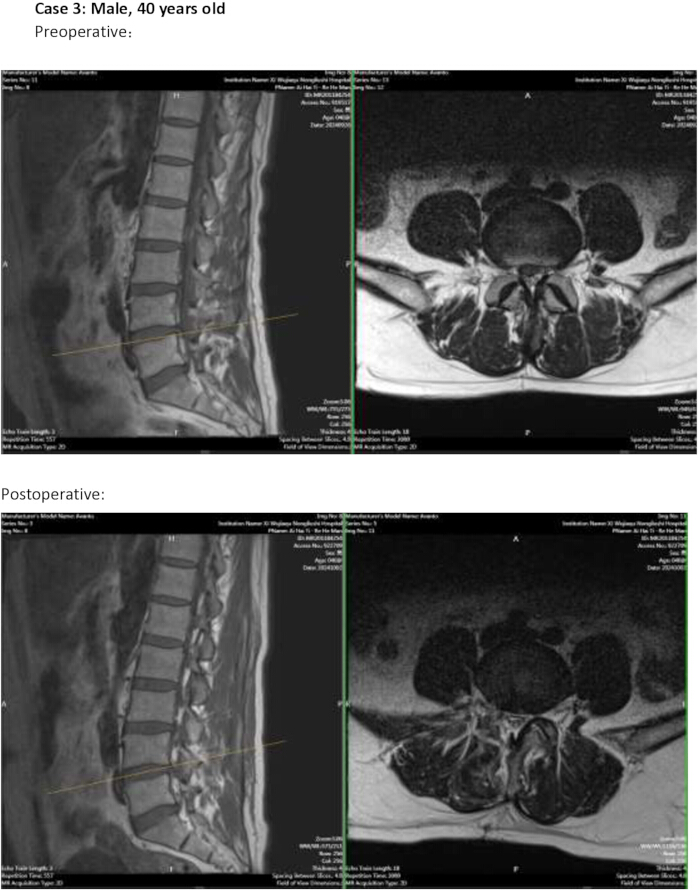
Figure 9: Representative preoperative and postoperative lumbar MRI of Case 3, a 40-year-old male. (A) Preoperative sagittal and axial MRI demonstrating lumbar spinal canal stenosis. (B) Postoperative sagittal and axial MRI demonstrating increased available spinal canal space following decompression. Abbreviation: MRI = magnetic resonance image. Please click here to view a larger version of this figure.
Summary of the main findings
Overall, UBE was associated with more favorable early postoperative recovery. Most between-group differences diminished during long-term follow-up, although ODI remained significantly lower in the UBE group at 1 year. No significant between-group differences in VAS, ODI, or JOA were observed at 2 years.
Data Availability
The authors confirm that the article and the additional raw data in Supplementary Table S1 and Supplementary Table S2 contain all the information needed to support the study's conclusions.
Supplementary Table S1. Individual patient clinical outcome scores. Individual VAS, JOA, and ODI scores recorded before surgery and at 1 week, 1 month, 3 months, 6 months, 1 year, and 2 years after surgery. The dataset contains de-identified patient-level outcome data used for longitudinal analyses. Abbreviations: VAS = visual analog scale; ODI = Oswestry Disability Index; JOA = Japanese Orthopedic Association. Please click here to download this file.
Supplementary Table S2. De-identified patient demographic and perioperative dataset. De-identified individual patient data for the Open ULBD and UBE cohorts, including demographic characteristics, operative variables, diagnoses, complications, hospitalization information, and other perioperative variables used in the analyses. Abbreviations: UBE = Unilateral Biportal Endoscopy; ULBD = Unilateral Laminotomy with Bilateral Decompression. Please click here to download this file.
المناقشة
This study demonstrates that both UBE and Open Unilateral Laminotomy with Bilateral Decompression (Open ULBD) can effectively and substantially decrease pain intensity and functional disability, while improving neurologic function, in patients with degenerative lumbar spinal stenosis (DLSS) in the long term. UBE, however, showed more favorable early postoperative recovery, as evidenced by earlier decreases in VAS pain scores and earlier increases in JOA neurological scores (within the first 3 months after surgery)26,27. Some key points for success in using the UBE technique were to use separate viewing and working ports, to keep the site moist with continuous saline irrigation, and to perform contralateral decompression using the "over-the-top" method. Undercutting of the spinous procedure on the oral side at 30-degree magnification is possible to remove the ligamentum flavum, decompress each lateral recess, and preserve the contralateral paraspinal muscles and posterior midline osteoligamentous structures28.
The preliminary results with UBE are comparable to those reported in other studies comparing different MIS spine surgery techniques. Several comparisons have been made that illustrate the early pain relief, reduced peri-operative morbidity, reduced paraspinal muscle injury, and rapid recovery experienced by patients undergoing endoscopic decompression procedures as compared to the traditional microscopic or open laminectomy procedures. Long-term functional results, however, are similar at 1–2 years for the various surgical treatments. Likewise, with the minimally invasive Open ULBD, the same good clinical results can be achieved while the other side of the posterior arch remains intact. Our findings indicate that the UBE technique may provide earlier postoperative recovery than Open ULBD, while long-term outcomes remain comparable between the two procedures. It reinforces the principle that, without unnecessary soft tissue damage, early postoperative rehabilitation can be best optimized without compromising long-term outcomes of decompression29,30.
Open ULBD is a technique that requires mastery and certain procedural adjustments, and complications must be managed. A small endoscopic working area is one of the difficult parts of the procedure, where epidural venous bleeding occurs. This can be remedied by slightly increasing the irrigation pressure, using radiofrequency bipolar electrocautery under direct visualization, and using bone wax when the bleeding is from the bone. It is important to maintain adequate fluid output at the working portal and throughout the procedure to prevent fluid accumulation in the surrounding soft tissues and excessive pressure in the epidural space. In addition, the angles of the endoscope and burr need to be carefully selected during the contralateral "over-the-top" approach to avoid excessive removal of the facet joints. This helps maintain spinal stability and reduce the risk of iatrogenic spondylolisthesis31.
In the available perioperative data, UBE was associated with numerically lower estimated blood loss and shorter length of stay compared to Open ULBD, while operative time was similar between groups. However, these results should be interpreted with caution due to unequal sample sizes and incomplete availability of certain perioperative variables. No statistically significant difference in postoperative complications was observed, and the small number of events precludes definitive conclusions regarding comparative safety.
There are a few methodological constraints to consider when interpreting the results. First, this is a retrospective, non-randomized study, so there may be selection bias, and a definite causal relationship between the surgical technique and the observed outcome cannot be established. Second, there was a substantial imbalance in group size, with 177 patients in the UBE group and 17 in the Open ULBD group. This imbalance reflects the distribution of treatments observed at the participating tertiary centers during the study period. Third, not all retrospective data included all perioperative characteristics available for analysis, such as operative time, anticipated blood loss, hospital stay, hospital costs, and postoperative complications. While information on expected blood loss was more comprehensive, information on operation duration and hospital stay was only available for a portion of the cohort. Thus, these results should be considered available-case exploratory analyses, rather than full-cohort estimates. The low number of postoperative complications also reduces the statistical precision of comparisons of complications. Finally, surgeons' experience and learning curve with biportal endoscopic working instruments could have affected results in the UBE group32,33.
In clinical practice, the advantages of UBE include benefits for patients who need to regain function quickly, such as physically active and elderly patients. Open ULBD is, however, valid and safe, especially in resource-limited operating rooms where specialized endoscopic equipment is unavailable. Additional research is required to conduct multicenter prospective randomized controlled trials with equal numbers of patients in each group and equal surgical experience across centers. These studies could be extended to include quantitative 3D MRI analysis of the dural area, objective assessment of spinal stability, cost-effectiveness analysis, and intraoperative navigation and automated fluid pressure management to further improve and standardize biportal endoscopic spine surgery34,35,36.
الإفصاحات
The authors have no conflicts of interest to declare.
شكر وتقدير
This study was funded by The Sixth Division Hospital of Xinjiang Production and Construction Corps (Wujiaqu City People's Hospital), Fund Number: BTKY25002.
المواد
| الاسم | الشركة | رقم فهرسي | التعليقات |
|---|---|---|---|
| Automated Fluid Irrigation Pump | Stryker | Catalog: 220-100-000 | Equipment |
| Bipolar Radiofrequency Hemostasis System | Smith and Nephew | Catalog: Werewolf System | Equipment |
| Closed Suction Wound Drain System | Zimmer Biomet | Catalog: 00-2401-010-00 | Equipment |
| GraphPad Prism | GraphPad Software | RRID:SCR_002798 | Figures and diagnostic plots |
| Japanese Orthopedic Association Assessment Rubric | Japanese Orthopedic Association | N/A | Dataset / Tool |
| Kerrison Rongeurs (40-degree, 2mm-5mm) | Aesculap / B. Braun | Catalog: FF042R | Equipment |
| Oswestry Disability Index Questionnaire | MAPI Research Trust | Version: 2.1a | Dataset / Tool |
| Radiofrequency Bipolar Cautery Probe | Smith and Nephew | Catalog: 72200845 | Material |
| Spine High-Speed Diamond Burr System | Medtronic Powered Surgical Solutions | Catalog: Midas Rex MR7 | Equipment |
| Spreadsheet software | Microsoft | Microsoft Excel / Microsoft 365 | Editable tables and supplementary data |
| Statistical software (SPSS) | IBM SPSS Statistics | RRID:SCR_019096 | Data analysis |
| Sterile Normal Saline (0.9% Sodium Chloride) | Shaanxi Sanxin Pharmaceutical | Catalog: 1000 mL Bag | Reagent |
| Structured study questionnaire | Study authors | Study-specific; no catalog number | Collection of demographics and study variables |
| Surgical Spinal Endoscope (30-Degree Direction of View) | Karl Storz | Catalog: 28780B | Equipment |
| Visual Analog Scale Assessment Tool | Huskisson | N/A | Dataset / Tool |
| Wilson Frame Radiolucent Surgical Positioner | Mizuho OSI | Catalog: 5321 | Equipment |
المراجع
- Bagley C, et al. Current concepts and recent advances in understanding and managing lumbar spine stenosis. F1000Res. 2019;8:137.
- Genevay S, Atlas SJ. Lumbar spinal stenosis. Best Pract Res Clin Rheumatol. 2010;24(2):253-65.
- Lurie J, Tomkins-Lane C. Management of lumbar spinal stenosis. BMJ. 2016;352:h6234.
- Lee SY, et al. Lumbar stenosis: a recent update by review of literature. Asian Spine J. 2015;9(5):818-28.
- Lee BH, et al. Lumbar spinal stenosis: pathophysiology and treatment principle: a narrative review. Asian Spine J. 2020;14(5):682-93.
- Kwon JW, Kim SH, Lee BH, Moon SH. Lumbar spinal stenosis: review update 2022. Asian Spine J. 2022;16(5):789-98.
- Szpalski M, Gunzburg R. Lumbar spinal stenosis in the elderly: an overview. Eur Spine J. 2003;12(Suppl 2):S170-5.
- Yabuki S, et al. Prevalence of lumbar spinal stenosis using the diagnostic support tool and correlated factors in Japan. J Orthop Sci. 2013;18(6):893-900.
- Chen X, et al. Clinical effectiveness of conservative treatments on lumbar spinal stenosis: a network meta-analysis. Front Pharmacol. 2022;13:859296.
- Costa F, Tarpada SP, Cosentini L, Cardia A. Decompressive surgery for lumbar spinal stenosis: WFNS Spine Committee recommendations. World Neurosurg X. 2020;7:100076.
- Deer TR, et al. Best practices for minimally invasive lumbar spinal stenosis treatment 2.0 (MIST): consensus guidance from the American Society of Pain and Neuroscience (ASPN). J Pain Res. 2022;15:1325-54.
- Kim JE, et al. Biportal endoscopic spinal surgery for lumbar spinal stenosis. Asian Spine J. 2019;13(2):334-42.
- Eum JH, Heo DH, Son SK, Park CK. Percutaneous biportal endoscopic decompression for lumbar spinal stenosis: a technical note and preliminary clinical results. J Neurosurg Spine. 2016;24(4):602-7.
- Popov V, Anderson DG. Minimal invasive decompression for lumbar spinal stenosis. Adv Orthop. 2012;2012:645321.
- Pao JL, Lin SM, Chen WC, Chang CH. Unilateral biportal endoscopic decompression for degenerative lumbar canal stenosis. J Spine Surg. 2020;6(2):438-46.
- Park DK, Weng C, Zakko P, Choi DJ. Unilateral biportal endoscopy for lumbar spinal stenosis and lumbar disc herniation. JBJS Essent Surg Tech. 2023;13(2):e22.00020.
- Junjie L, et al. Comparison of unilateral biportal endoscopy decompression and microscopic decompression effectiveness in lumbar spinal stenosis treatment: a systematic review and meta-analysis. Asian Spine J. 2023;17(2):418-30.
- Abou-Al-Shaar H, Adogwa O, Mehta AI. Lumbar spinal stenosis: objective measurement scales and ambulatory status. Asian Spine J. 2018;12(4):765-74.
- Fairbank JC, Pynsent PB. The Oswestry Disability Index. Spine (Phila Pa 1976). 2000;25(22):2940-52.
- Huskisson EC. Measurement of pain. Lancet. 1974;2(7889):1127-31.
- Lee MH, et al. Comparative outcomes of biportal endoscopic decompression, conventional subtotal laminectomy, and minimally invasive transforaminal lumbar interbody fusion for lumbar central stenosis. Neurospine. 2024;21(4):1178-89.
- Ouyang JY, et al. A comparative analysis of unilateral biportal endoscopic and open laminectomy in multilevel lumbar stenosis. Front Neurol. 2024;15:1409088.
- Zhou H, et al. Unilateral biportal endoscopy versus microscopic decompression in the treatment of lumbar spinal stenosis: a meta-analysis. Medicine (Baltimore). 2023;102(14):e32756.
- Wang YP, et al. Efficacy and safety of unilateral biportal endoscopy compared with microscopic decompression in the treatment of lumbar spinal stenosis: a systematic review and updated meta-analysis. Exp Ther Med. 2023;26(1):309.
- Mobbs RJ, et al. Outcomes after decompressive laminectomy for lumbar spinal stenosis: comparison between minimally invasive unilateral laminectomy for bilateral decompression and open laminectomy. J Neurosurg Spine. 2014;21(2):179-86.
- Takahashi H, et al. Unilateral laminectomy for bilateral decompression improves low back pain while standing equally on both sides in patients with lumbar canal stenosis: analysis using a detailed visual analogue scale. BMC Musculoskelet Disord. 2019;20:100.
- Dhar UK, Chou D, Mummaneni PV, Park P. Open laminectomy vs. minimally invasive laminectomy for lumbar spinal stenosis: a review. Front Surg. 2024;11:1357897.
- Tan B, Yang QY, Fan B, Xiong C. Decompression via unilateral biportal endoscopy for severe degenerative lumbar spinal stenosis: a comparative study with decompression via open discectomy. Front Neurol. 2023;14:1132698.
- Estefan M, Yarlagadda H, Samuel LT. Laminectomy. In: StatPearls [Internet]. StatPearls Publishing; Treasure Island (FL); 2023.
- Kumaran P, et al. Reporting bias is prevalent in systematic reviews and meta-analyses related to endoscopic vs. microscopic decompression: a systematic review and meta-analysis. J Spine Surg. 2025;11(4):851-60.
- Liu SX, et al. Unilateral biportal endoscopic spine surgery: a meta-analysis unveiling the learning curve and clinical benefits. Front Surg. 2024;11:1405519.
- Park SM, et al. Technical overview and clinical outcomes of unilateral biportal endoscopic spine surgery: a systematic review. World Neurosurg. 2021;153:23-35.
- Kim JE, Choi DJ. Unilateral biportal endoscopic decompression by over-the-top approach for spinal stenosis: technical note and preliminary results. Neurospine. 2018;15(3):252-61.
- Pranata R, et al. Unilateral biportal endoscopy versus microscopic decompression for lumbar spinal stenosis: a systematic review and meta-analysis. World Neurosurg. 2020;138:e750-60.
- Xu J, et al. Learning curve and clinical outcomes of unilateral biportal endoscopic lumbar discectomy: a cumulative sum analysis. BMC Musculoskelet Disord. 2022;23(1):512.
- Ahn JS, et al. Comparative analysis of clinical outcomes and complications between biportal endoscopic discectomy and conventional microscopic discectomy for lumbar disc herniation. Biomed Res Int. 2021;2021:6626885.