This prospective cohort study evaluates circulating neutrophil extracellular traps (NETs), measured as MPO-DNA complexes, as predictive biomarkers of trastuzumab efficacy in HER2-positive breast cancer. Higher baseline NETs and unfavorable NETs dynamics were associated with disease progression and shorter progression-free survival, supporting NETs as potential adjunctive biomarkers for risk stratification.
مقالة بحثية
Neutrophil Extracellular Traps as Predictive Biomarkers in Trastuzumab-Treated HER2-Positive Breast Cancer: A Prospective Cohort Study
* These authors contributed equally
في هذه المقالة
ملخص
الملخص
Neutrophil extracellular traps (NETs) have been implicated in cancer progression and therapy resistance, but their value as predictive biomarkers in HER2-positive breast cancer remains unclear. In this prospective cohort study, we measured circulating myeloperoxidase–DNA (MPO-DNA) complexes as a surrogate marker of NETs in patients with HER2-positive breast cancer receiving adjuvant trastuzumab-based therapy. Serial blood samples were collected at baseline and during treatment, and patients were classified as having progressive disease (PD) or disease control (DC). Baseline NETs, CEA, and CA15-3 levels were significantly higher in patients with PD compared to those with DC. Longitudinal analysis revealed a significant Group × Time interaction, with NETs decreasing in the DC group but increasing in the PD group over the course of treatment. In Firth-penalized logistic regression, higher baseline NETs were independently associated with increased odds of progression (OR per 1-U/L increase, 1.026; 95% CI, 1.004–1.048; p = 0.023). An exploratory NETs cutoff of 97.32 U/L stratified patients into low- and high-NETs groups with significantly different progression-free survival (log-rank p = 0.045); continuous NETs remained associated with shorter PFS in multivariable Cox models adjusted for CEA and CA15-3 (HR per 1-U/L increase, 1.018; 95% CI, 1.003–1.033; p = 0.021). Bootstrap internal validation yielded an optimism-corrected C-index of 0.739 (95% CI, 0.613–0.866). Adding CEA and CA15-3 to NETs improved risk reclassification (NRI = 0.931; p = 0.018) and discrimination (IDI = 0.146; p < 0.001), although the increase in AUC was not statistically significant by DeLong’s test. Tissue MPO fluorescence correlated with circulating MPO-DNA even after controlling for disease group. These findings suggest that NETs are associated with trastuzumab efficacy and may serve as adjunctive biomarkers for risk stratification, but the modest sample size, exploratory cutoffs, and single-center design warrant validation in larger prospective cohorts before any clinical application.
المقدمة
Breast cancer represents the most commonly diagnosed malignancy among women globally, with 2.3 million new cases in 20201. The Human epidermal growth factor receptor 2 (HER2) -positive subtype constitutes 15%–20% of diagnoses and demonstrates aggressive clinical behavior, including heightened metastatic potential and treatment resistance2. While trastuzumab, the first HER2-targeted monoclonal antibody, revolutionized management by inhibiting downstream signaling and mediating antibody-dependent cellular cytotoxicity, intrinsic or acquired resistance develops in over 50% of patients3,4. Contemporary advances, including dual HER2 blockade with trastuzumab plus pertuzumab and antibody-drug conjugates such as trastuzumab emtansine, have improved outcomes. Despite these improvements, recurrence or death still occurred in 19.7% of patients3,5. This high resistance rate underscores an urgent need for biomarkers to predict treatment failure and guide therapeutic strategies6. Current clinicopathological parameters lack sensitivity for real-time monitoring, while molecular assays face standardization barriers in routine practice7.
NETs represent promising but underexplored biomarkers in this setting. These web-like structures released during neutrophil activation promote cancer progression by remodeling the tumor microenvironment, facilitating metastasis, and conferring therapy resistance8,9. Elevated NET levels correlate consistently with advanced disease stages, poor survival, and treatment failure across malignancies10,11,12,13. A prospective study collected plasma samples from 45 women newly diagnosed with breast cancer and measured NE-DNA complexes, a key NETs marker. The cohort predominantly presented with in situ stage (62%), followed by localized (29%) and disseminated (9%) stages. Higher NE-DNA levels were observed in localized and disseminated stages versus in situ stage (68% vs. 32%, p = 0.034), demonstrating that NETs levels escalate with advancing disease stage, indicating their association with breast cancer severity13. In trastuzumab-resistant settings, NETs may impair treatment efficacy by fostering a pro-tumorigenic microenvironment2,12. Many studies have established a robust correlation between elevated levels of NETs in cancer patients and adverse outcomes, including poorer prognosis, metastasis, early recurrence, and heightened drug resistance14,15,16,17. These findings position NETs as promising biomarkers for cancer diagnosis and prognosis. Specifically, studies confirm that NETs correlate strongly with PFS in triple-negative breast cancer18, underscoring their potential as predictive biomarkers for prognosis, guiding treatment adjustments, and enhancing survival. NETs detection offers clinical advantages over invasive biopsies, including simplicity, minimal patient harm, high acceptability, and suitability for dynamic monitoring. However, the role of NETs as predictive biomarkers in HER2-positive breast cancer remains underexplored.
This prospective cohort study addresses these critical gaps by investigating the clinical utility of NETs as biomarkers for therapeutic response and prognosis in HER2-positive breast cancer. We longitudinally quantify peripheral blood NETs levels at baseline and following trastuzumab-based therapy. Differential NETs expression patterns are compared between patients achieving DC and those with PD. These findings suggest that circulating NETs may have potential as an adjunctive biomarker for risk stratification in HER2-positive breast cancer. However, because this was a small, single-center exploratory study using an indirect NETs assay, the results require validation in larger, multicenter prospective cohorts before any clinical application can be considered.
البروتوكول
The study was conducted in accordance with the Declaration of Helsinki and was reviewed and approved by the Ethics Committee of Hefei First People’s Hospital (Ethical Approval Number: 2023(33)). Written informed consent was obtained from all participants before enrollment.
Prospective cohort design, patient selection, and blood collection
This study included women with histologically confirmed HER2-positive advanced or metastatic breast cancer who received trastuzumab-based anti-HER2 therapy in combination with chemotherapy at Hefei First People’s Hospital between September 8, 2021, and October 19, 2024. Patients were recruited before or at the initiation of treatment and were followed longitudinally to assess treatment response and progression-free survival (PFS). Peripheral blood samples were collected at baseline before treatment and after three cycles of trastuzumab-based therapy.
Eligible patients were 18–75 years of age and had histopathologically confirmed invasive breast carcinoma, HER2 positivity (IHC 3+ or IHC 2+) with FISH amplification, no prior systemic therapy, measurable target lesions, adequate organ and hematologic function, and signed informed consent. Patients were excluded if they had male breast cancer, another concurrent malignancy, a hematologic or autoimmune disorder, severe cardiac, renal, or hepatic complications, pregnancy or lactation, chronic immunosuppressant use, noninvasive or special pathological subtypes such as ductal carcinoma in situ or inflammatory carcinoma, HER2-low or indeterminate HER2 status, indeterminate hormone-receptor status, or poor compliance with treatment or follow-up.
Initially, 60 patients were enrolled in total. Four patients were excluded from the primary statistical analysis because follow-up data were unavailable or incomplete. Therefore, 56 patients were included in the treatment-response analysis. For the PFS analysis, 52 patients had sufficient follow-up information for survival evaluation. The baseline characteristics are given in Table 1.
Blood samples were collected from peripheral veins from fasting participants, processed into plasma, aliquoted, and stored until analysis at -80 °C.
Quantification of plasma MPO-DNA complexes by ELISA
Plasma MPO–DNA complexes, used as a surrogate or indirect marker of neutrophil extracellular traps (NETs), were quantified using an ELISA kit (ml342558; Shanghai Enzyme-linked Biotechnology). Because MPO–DNA complexes reflect neutrophil activation and NET release rather than NETosis specifically, the results were interpreted as an indirect measure of NET burden. The materials used for the assay are listed in Supplementary Table 1, Supplementary Table 2, Supplementary Table 3, Supplementary Table 4, Supplementary Table 5, Supplementary Table 6, Supplementary Table 7, and Supplementary Table 8.
Blood samples were collected from fasting participants into anticoagulant-containing tubes. Plasma was separated by centrifugation at 2,000 × g for 10 min at 4 °C, transferred to polypropylene tubes without disturbing the cellular fraction, and stored at -80 °C. Plasma aliquots were thawed on ice at approximately 4 °C, gently mixed by inversion after complete thawing, and centrifuged again at 2,000 × g for 10 min at 4 °C to remove particulate material. To minimize degradation of MPO–DNA complexes, each sample underwent a maximum of one freeze–thaw cycle before analysis; samples subjected to more than one freeze–thaw cycle were excluded.
Before the assay, all reagents were equilibrated to room temperature and gently mixed without generating foam. The required wells were allocated for standards, blanks, and plasma samples, and all standards, blanks, and samples were analyzed in duplicate. Plasma samples were diluted 1:1 by mixing one volume of plasma with one volume of sample diluent, after which 50 µL of each diluted sample was added to the designated wells. The supplied standard was serially diluted twofold in standard diluent to generate concentrations of 4,000, 2,000, 1,000, 500, 250, 125, and 62.5 pg/mL. A zero-standard well containing standard diluent alone was also prepared, and 50 µL of each standard was added to the corresponding wells.
Biotin-labeled detection antibody was added at 50 µL per well. The plate was covered with sealing film, gently shaken to mix the contents, and incubated at 37 °C for 60 min in a temperature-controlled incubator. The plate contents were then discarded, and each well was washed five times with 350 µL of wash buffer. For each wash, the buffer was allowed to remain in the wells for 30 s before aspiration. After the final wash, the inverted plate was tapped against clean absorbent paper. Streptavidin–horseradish peroxidase conjugate was added at 80 µL per well, and the plate was gently shaken and incubated at 37 °C for 30 min. The washing procedure was then repeated five times using 350 µL of wash buffer per well and a 30 s soaking period for each wash.
Substrate solutions A and B were added at 50 µL each per well. Following gentle mixing, the plate was incubated at 37 °C for 15 min in the dark. The stop solution was then added at 50 µL per well, and the plate was gently mixed. Absorbance was measured at 450 nm using a microplate reader within 15 min of adding the stop solution.
A standard curve was generated by plotting absorbance against the corresponding MPO–DNA standard concentrations using logistic regression. Sample concentrations were interpolated from the standard curve and corrected for the 1:1 dilution factor. Results were expressed in pg/mL. The mean absorbance of duplicate wells was used for analysis. Samples with a replicate coefficient of variation greater than 15% or absorbance values outside the standard-curve range were repeated when sufficient sample was available.
Assay precision was evaluated by calculating intra- and inter-assay coefficients of variation (CV%). The intra-assay CV% was determined from duplicate measurements of each sample within the same plate, whereas the inter-assay CV% was assessed using quality-control plasma pools measured across multiple plates. The intra-assay CV% for MPO–DNA measurements was 6.4%, and the inter-assay CV% was 9.2%. All reported samples had an intra-assay CV% of ≤10%; samples exceeding this threshold were re-assayed when sufficient sample volume was available.
Colocalization between MPO and histone H3 (H3) was quantified using the Manders overlap coefficient. Following background subtraction and thresholding, the Coloc 2 plugin in ImageJ was used to calculate the fraction of MPO signal overlapping with H3 (Manders M1) and the fraction of H3 signal overlapping with MPO (Manders M2) within the defined tissue regions of interest. The mean Manders overlap coefficients across five fields per section were 0.78 ± 0.06 for MPO overlapping with H3 (M1) and 0.74 ± 0.08 for H3 overlapping with MPO (M2), indicating substantial colocalization consistent with NET-like structures. DNase I digestion controls and cell-impermeable DNA dyes, such as SYTOX Green, were not performed because of resource constraints.
Immunofluorescence detection and quantification
Formalin-fixed, paraffin-embedded breast-tumor tissue was sectioned at a thickness of 4 µm and mounted on positively charged glass slides. The sections were dried at 60 °C for 1 h, deparaffinized in xylene with three 5 min changes, and rehydrated through 100%, 95%, 80%, and 70% ethanol for 3 min at each concentration. The sections were then rinsed twice in distilled water.
Heat-induced antigen retrieval was performed using 10 mM sodium citrate buffer at pH 6.0 in a laboratory microwave. The slides were heated until the buffer reached boiling and were then maintained below boiling temperature for 10 min. The slides were allowed to cool gradually in the retrieval buffer for 20 min and were subsequently washed three times with PBS for 5 min each.
The tissue sections were encircled with a hydrophobic barrier and blocked with 10% donkey serum in PBS for 2 h in a humidified, sealed chamber. The sections were not allowed to dry during the procedure. After blocking, the sections were incubated overnight, for approximately 16 h at 4 °C, in a humidified chamber with anti-MPO antibody diluted 1:300 and anti-histone H3 antibody diluted 1:1,000 in antibody diluent.
The sections were washed with PBS containing 0.05% Tween-20 for 5 min per wash at room temperature with gentle agitation. Fluorophore-conjugated secondary antibodies appropriate for the host species of the primary antibodies were then applied at a dilution of 1:500. The sections were incubated for 1 h at room temperature in a humidified chamber, protected from light and without agitation. Following secondary-antibody incubation, the sections were washed with PBS containing 0.05% Tween-20. The nuclei were counterstained with DAPI at 1 µg/mL for 5 min in the dark, followed by two washes with PBS.
The sections were treated with autofluorescence-quenching reagent B for 5 min and then rinsed under running distilled water for 5 min. The sections were mounted using an antifade mounting medium, coverslips were applied, and the slides were stored in the dark at 4 °C until imaging.
Images were acquired using a fluorescence microscope equipped with a DP74 digital camera and a UPlanSApo 20× objective with a numerical aperture of 0.75. DAPI fluorescence was detected using a 340–380 nm excitation band and a 435–485 nm emission band. Alexa Fluor 488 fluorescence for MPO detection was detected using a 460–490 nm excitation band and a 510–550 nm emission band. Alexa Fluor 594 fluorescence for H3 detection was detected using a 530–560 nm excitation band and a 570–650 nm emission band. Exposure time, camera gain, illumination intensity, and all other image-acquisition settings were kept constant for all images within each experiment.
For each tissue section, five non-overlapping fields were systematically sampled across the tumor area using a predefined grid-based approach to minimize selection bias. A virtual grid was overlaid on the whole-section image, and fields were selected at fixed grid intersections that contained tumor tissue. Necrotic areas, tissue edges, and regions with folding or other artifacts were excluded. The same sampling strategy was applied to all specimens. Images were analyzed using ImageJ software. Background fluorescence was subtracted using the rolling-ball algorithm with a radius of 50 pixels, and the Otsu automatic thresholding algorithm was applied separately to each fluorescence channel after background subtraction. The same preprocessing and thresholding sequence was applied to all images.
Mean fluorescence intensity and integrated density were measured within manually delineated tissue regions of interest. Artifacts, tissue edges, and areas without tumor tissue were excluded before analysis. The mean value of the five analyzed fields was calculated for each section, and this section-level mean was used as the observational unit for statistical analysis. The investigator responsible for image acquisition and analysis was blinded to the clinical response group (PD or DC), and sample identifiers were coded so that group allocation was not visible during image analysis. Secondary-antibody-only controls were included to assess nonspecific fluorescence. Quantification was performed by a single trained observer; future studies will incorporate independent duplicate readings and assessment of interobserver agreement to further strengthen methodological rigor.
Relevant definitions
Evaluation of tumor lesion at baseline
To establish a reference for longitudinal assessment of treatment response, tumor burden was quantified for both target and non-target lesions at baseline using standardized criteria.
Measurable Target Lesion: Up to five measurable target lesions in total were selected to represent all involved sites. A maximum of two per organ was chosen. Target lesions were selected based on the longest diameter in case of non-nodal lesions or the short axis for nodal ones. In addition, the feasibility of accurate, reproducible measurements on serial imaging was considered. The sum of the longest diameters (or short axes for nodal disease) of all target lesions was recorded as the baseline reference value for subsequent comparison.
Non-Target Lesions: All other disease sites that were not chosen as target lesions were classified as non-target lesions. These were also documented at baseline. These lesions were not measured quantitatively but were monitored qualitatively during follow-up for presence, resolution, or unequivocal progression.
Criteria for treatment response
Treatment response was categorized according to adapted RECIST 1.1–based criteria using serial imaging and clinical assessment.
Complete Response (CR): The CR involved the disappearance of all target lesions and the reduction to normal size of all pathological lymph nodes. All non-target lesions must also have resolved, and no new lesions may be present.
Partial Response (PR): It involved a decrease in the sum of all the diameters of least30% for all target lesions. The baseline sum was used as a reference. For nodal lesions, the short axis was used; for all other lesions, the longest diameter was used. The progression of non-target lesions and new lesions was not allowed.
Progressive Disease (PD): This meant an increase of at least 20% in the sum of the diameters of all target lesions. It used the smallest recorded sum during the study (including baseline) as a reference. An absolute increase of at least 5 mm was set. Two other instances qualified as PD: a) unequivocal progression of non-target lesions and b) appearance of one or more new lesions.
Stable Disease (SD): Based on the smallest sum of diameters recorded during the study, a stable disease would mean having neither sufficient increase to qualify for PD, nor sufficient shrinkage to qualify for PR. Non-target lesions showed no unequivocal progression, and no fresh lesions were detected.
Patients were classified as having disease control (DC) if they achieved CR, PR, or SD, and as having progressive disease (PD) if they met criteria for PD at any time during follow-up. These classifications were used for all response-based analyses, including biomarker comparisons and survival outcomes.
Disease Control Rate (DCR) = CR + PR + SD.
Survival and predictive value analysis
PFS was the primary time-to-event endpoint in this study. PFS was defined as the time from the date of initiation of trastuzumab-based adjuvant therapy to the date of first radiologically confirmed disease progression or death from any cause, whichever occurred first. Radiological progression was determined according to the response criteria described above, based on serial imaging (e.g., CT, MRI, or ultrasound) and clinical assessment performed at predefined intervals during follow-up. Patients who remained alive without documented progression at the time of analysis were censored at the date of their last clinical or radiological evaluation.
To explore the potential prognostic value of circulating NETs, an exploratory cutoff for pre-treatment NETs concentration was derived from the receiver-operating characteristic (ROC) curve for PFS status (progression vs. no progression by a fixed time point). The optimal cutoff was selected by maximizing the Youden index (sensitivity + specificity − 1). Patients were then classified into “low-NETs” and “high-NETs” groups based on this threshold. Because the cutoff was derived and evaluated in the same cohort, it is subject to data-snooping bias and overfitting; therefore, it is considered purely exploratory and hypothesis-generating and is not recommended for clinical decision-making.
Survival curves for the low-NETs and high-NETs groups were estimated using the Kaplan–Meier method and compared using the log-rank test. Median and mean PFS, along with corresponding 95% confidence interval (CI), were reported for each group. To avoid reliance on a single arbitrary cutoff and to make fuller use of the data, baseline NETs were also analyzed as a continuous variable in Cox proportional hazards models. Univariable Cox regression was first used to estimate the hazard ratio (HR) and 95% CI for the association between continuous pre-treatment NETs and PFS. A multivariable Cox model was then fitted to adjust for potential confounding by established tumor markers, including continuous CEA and CA15-3. The proportional hazards assumption was assessed visually using log–log survival plots and by examining Schoenfeld residuals; no substantial violations were observed.
To quantify the discriminative ability of NETs for PFS, we estimated the concordance index (C-index) from a Cox model containing continuous baseline NETs. Internal validation was performed using 1,000 bootstrap resamples to estimate optimism (the difference between apparent and bootstrap-validated performance) and to derive an optimism-corrected C-index with 95% CI. This approach provides a more realistic assessment of model performance in the presence of a limited sample size and event numbers.
To evaluate the incremental predictive value of adding established tumor markers to NETs, we compared two nested models: a model containing continuous NETs alone, and a model containing NETs, CEA, and CA15-3. ROC curves were constructed for binary progression status at 36 months, and the areas under the curve (AUCs) for the two models were compared using DeLong’s test. In addition, we calculated the continuous net reclassification improvement (NRI) and integrated discrimination improvement (IDI) at 36 months to assess whether the addition of CEA and CA15-3 to NETs improved risk classification and discrimination. These metrics were estimated using the survIDINRI package in R, with 95% CIs derived from bootstrap resampling. Given the modest number of progression events and the single-center design, all PFS-related analyses, including the exploratory cutoff, C-index estimation, and NRI/IDI calculations, should be considered exploratory and interpreted with caution.
Sample-size and power analysis
No formal a priori sample-size calculation was performed before recruitment. The cohort size was determined by the number of eligible patients recruited during the study period from September 8, 2021, to October 19, 2024. A total of 60 patients were enrolled, and 56 patients with available follow-up data were included in the primary treatment-response analysis. Given the limited number of progression events, all multivariable models were considered exploratory. To mitigate small-sample bias and overfitting, we used Firth’s penalized logistic regression, bootstrap internal validation for survival models, and parsimonious variable selection.
Statistical analysis
Data analysis was performed using SPSS and R. Graphical presentations were generated using GraphPad Prism and R. The normality of data distribution was assessed using the D’Agostino–Pearson and Shapiro–Wilk tests, with further verification by the Anderson–Darling and Kolmogorov–Smirnov tests. Normally distributed data were presented as mean ± standard deviation (SD), while non-normally distributed data were expressed as median.
Group comparisons and repeated measures
For independent-samples comparisons (e.g., baseline NETs, CEA, and CA15-3 between DC and PD groups; immunofluorescence intensities), equality of variances was assessed using Levene’s test. When variances were unequal, Welch’s t-test was used; otherwise, the standard independent t-test was applied. For paired comparisons of pre- and post-treatment NETs within each response group, normality was assessed on the difference scores (Δ = post − pre) using the Shapiro–Wilk test. When differences were normally distributed, paired t-tests were used; otherwise, the Wilcoxon signed-rank test was applied.
To assess changes in NETs over time between response groups, a linear mixed-effects model was fitted with fixed effects for Group (DC/PD), Time (pre/post), and their interaction, and a random intercept for each patient. The Group × Time interaction term tests whether the trajectory of NETs differs between groups. Estimated marginal means with 95% CIs are reported for each group–time combination.
Predictive modeling of treatment response
To identify independent predictors of trastuzumab treatment response, we fitted a multivariable logistic regression model with disease progression (PD vs. DC) as the binary dependent variable. As the number of progression events (n = 16–18) was limited relative to the number of candidate predictors, a parsimonious modeling strategy was adopted to avoid overfitting. It also maintained an adequate events-per-variable ratio. The model included only pre-treatment circulating NETs (MPO-DNA complexes), CEA, and CA15-3 as continuous predictors, selected based on clinical relevance, prior evidence linking these markers to tumor burden and outcomes in breast cancer, and availability in all patients.
We used Firth’s penalized maximum likelihood estimation to mitigate potential separation issues and reduce small-sample bias. This approach shrinks coefficient estimates toward zero and is recommended when the number of events is limited. Variance inflation factors (VIF) were derived from an auxiliary linear regression model. Collinearity among predictors was assessed using Pearson correlation coefficients. VIF values close to 1 indicated no evidence of severe multicollinearity.
Model fit and calibration were evaluated using the Hosmer–Lemeshow goodness-of-fit test and Nagelkerke R2. Odds ratios and p-values were reported for each predictor. For comparison, we also fitted a standard (non-penalized) logistic regression model with the same three predictors to illustrate the impact of penalization on coefficient stability and statistical significance in this small cohort. All predictive modeling analyses were conducted with the understanding that the limited sample size and event count render the results exploratory and hypothesis-generating. These require validation in large and independent cohorts.
Missing data and significance threshold
Patients with incomplete follow-up data required to determine progression status and PFS were excluded from the primary analyses. Between included and excluded patients, we compared baseline characteristics in order to assess the potential for selection bias due to exclusion. Because some excluded patients had missing biomarker measurements, formal comparisons of baseline NETs, CEA, and CA15-3 levels between excluded and included patients were not performed.
Although the number of excluded patients was small (n = 4), this exclusion could still affect generalizability if missingness was related to underlying disease severity or outcomes. We therefore interpret the primary analyses with caution and acknowledge this as a limitation. No formal imputation of missing outcome data was performed, as the number of excluded patients was too small to support robust imputation modeling, and the missingness mechanism could not be reliably characterized.
A p-value < 0.05 was considered statistically significant, and all statistical tests were two-tailed. For analyses involving multiple related comparisons (e.g., paired pre–post biomarker tests within and between groups), we examined the robustness of findings using unadjusted p-values. However, due to the exploratory nature of this study and the relatively small sample size, we primarily emphasize effect sizes, CIs, and consistency of direction across analyses rather than strict adherence to arbitrary significance thresholds.
النتائج
Participant characteristics and treatment-response analysis
Participant characteristics
A total of 60 patients were enrolled during the study period. Four patients were excluded because of incomplete follow-up, leaving 56 patients for the treatment-response and longitudinal biomarker analyses. All included participants were women, aged 20–75 years, with a mean age of 55.54 ± 11.23 years. Based on radiological response assessment, 38 patients were classified as having disease control (DC), whereas 18 had progressive disease (PD). Baseline demographic, clinical, hematologic, and biochemical characteristics are summarized in Table 1.
Baseline biomarkers and pre- and post-treatment NETs
The study workflow, enrollment, biomarker comparisons, tissue immunofluorescence, and ROC analysis are shown in Supplementary Figure 1, Supplementary Figure 2, Supplementary Figure 3, Supplementary Figure 4, and Supplementary Figure 5. Pretreatment NETs, CEA, and CA15-3 concentrations were higher in the PD group than in the DC group. Mean pretreatment NETs concentrations were 108.02 ± 28.95 U/L in the DC group and 128.55 ± 34.83 U/L in the PD group. The between-group difference was statistically significant (mean difference [DC−PD], -20.54 U/L; 95% CI, -38.27 to -2.80; t = -2.321, df = 54, p = 0.024).
Mean pretreatment CEA concentrations were 5.44 ± 1.68 ng/mL in the DC group and 6.70 ± 1.68 ng/mL in the PD group. CEA was significantly higher in the PD group (mean difference, −1.25 ng/mL; 95% CI, -2.22 to -0.29; t = -2.605, df = 54, p = 0.012). Similarly, mean pretreatment CA15-3 concentrations were 29.11 ± 8.27 U/mL in the DC group and 34.81 ± 7.99 U/mL in the PD group (mean difference, −5.69 U/mL; 95% CI, -10.39 to -1.00; t = -2.432, df = 54, p = 0.018).
Levene’s tests indicated no evidence of unequal variances for NETs (P=0.130), CEA (P=0.962), or CA15-3 (P=0.870); therefore, standard independent-samples t-tests were used for these comparisons. Within the DC group, mean NETs concentrations decreased from 108.02 ± 28.95 U/L before treatment to 100.04 ± 20.21 U/L after three cycles of trastuzumab-based therapy. The mean within-patient change was -7.97 ± 21.53 U/L, and the paired comparison was statistically significant (t = 2.283, df = 37, p = 0.028). Within the PD group, mean NETs concentrations increased from 128.55 ± 34.83 U/L before treatment to 142.50 ± 19.33 U/L after treatment. The mean change was +13.95 ± 26.10 U/L (t = -2.267, df = 17, p = 0.037).
The Shapiro–Wilk tests applied to the difference scores confirmed no evidence of substantial departure from normality in either the DC group (p = 0.162) or the PD group (p = 0.623); paired t-tests were therefore retained for these within-group comparisons (Table 2, Table 3).
Linear mixed-effects analysis of NETs over time
A linear mixed-effects model was used to assess changes in NETs over time and to test whether the trajectory differed between response groups. The model included response group, time, and their interaction as fixed effects, with a patient-specific random intercept.
The Group × Time interaction was statistically significant (F(1,54) = 11.032, p = 0.002), indicating that the change in NETs from baseline to post-treatment differed between the DC and PD groups. Estimated marginal means showed that NETs decreased in the DC group from 108.02 U/L (95% CI, 99.62–116.42) at baseline to 100.04 U/L (95% CI, 91.64–108.44) after treatment. In contrast, NETs increased in the PD group from 128.55 U/L (95% CI, 116.35–140.76) to 142.50 U/L (95% CI, 130.29–154.70).
The main effect of the response group was significant (F(1,54) = 22.278, p < 0.001), reflecting higher overall NETs concentrations in the PD group. The main effect of time was not statistically significant (F(1,54) = 0.818, p = 0.370). The significant interaction, rather than the separate within-group comparisons, provides the primary evidence that NETs' trajectories differed according to treatment response (Table 4).
Predictive analysis of treatment response
Exploratory ROC analysis of baseline biomarkers
ROC curves were constructed to evaluate the ability of pretreatment NETs, CA15-3, and CEA to discriminate patients with PD from those with DC. Individual biomarkers showed moderate discriminatory performance. The AUC was 0.665 for NETs, 0.700 for CA15-3, and 0.672 for CEA. The reported sensitivity was 50.00% for NETs, 61.11% for CA15-3, and 72.22% for CEA.
The combined model incorporating NETs, CA15-3, and CEA yielded a sensitivity of 83.33%, a specificity of 68.42%, and an AUC of 0.810. Although the combined model showed greater discrimination than the individual biomarkers, these findings should be interpreted as exploratory because of the limited sample size and number of progression events.
Firth-penalized logistic regression
A Firth-penalized logistic regression model was fitted using pretreatment NETs, CEA, and CA15-3 as continuous predictors of PD. This analysis included 52 patients, of whom 16 experienced PD and 36 had DC.
Higher pretreatment NETs were independently associated with increased odds of disease progression in the penalized model. For each 1-U/L increase in NETs, the odds of PD increased by approximately 2.6% (OR, 1.026; 95% CI, 1.004–1.048; p = 0.023). CEA was also associated with increased odds of progression (OR per 1-ng/mL increase, 1.475; 95% CI, 1.002–2.171; p = 0.049). CA15-3 was not statistically significantly associated with PD (OR per 1-U/mL increase, 1.070; 95% CI, 0.983–1.166; p = 0.118) (Table 5).
The Hosmer–Lemeshow goodness-of-fit test did not indicate lack of fit (χ2 = 7.516, df = 8, p = 0.482). The reported Nagelkerke R2 was 0.673. Collinearity diagnostics showed no evidence of severe multicollinearity, with VIF values close to 1.0 for all three predictors. Given the small number of events and the single-center design, these findings should be considered exploratory and require validation in independent cohorts. (For comparison, a standard (non-penalized) logistic regression using the same three predictors yielded an attenuated and non-significant overall model (χ2 = 5.46, df = 3, p = 0.141; Nagelkerke R2 = 0.130; Supplementary Table 8), underscoring the value of Firth's penalized approach given the limited number of events.)
Tissue NET-related fluorescence analysis
Immunofluorescence analysis evaluated histone H3 and MPO fluorescence intensities in tissue sections from the DC and PD groups. The analysis included 8 tissue specimens with paired circulating biomarker measurements, comprising 4 specimens from the DC group and 4 from the PD group. For each specimen, the mean fluorescence intensity across five non-overlapping fields was calculated, and this specimen-level mean was used as the observational unit for statistical analysis.
For histone H3, the mean fluorescence intensity was 27.29 ± 17.27 arbitrary units in the DC group and 32.02 ± 23.95 arbitrary units in the PD group. Levene’s test did not indicate unequal variances (F = 0.724, p = 0.428); therefore, an independent-samples t-test was used. The between-group difference was not statistically significant (t = -0.320, df = 6, p = 0.760; mean difference [DC − PD], -4.72; 95% CI, -40.84 to 31.40).
For MPO, the mean fluorescence intensity was 8.69 ± 1.41 arbitrary units in the DC group and 17.18 ± 6.81 arbitrary units in the PD group. Levene’s test indicated unequal variances (F = 14.879, p = 0.008); therefore, Welch’s t-test was used. Although MPO fluorescence was numerically higher in the PD group, the between-group difference was not statistically significant (t = -2.440, df = 3.26, p = 0.086; mean difference [DC−PD], -8.49; 95% CI, -19.08 to 2.10) (Table 6).
Thus, tissue MPO and histone H3 fluorescence intensities were numerically higher in the PD group, but neither marker provided statistically significant evidence of a between-group difference in this small exploratory tissue sample.
Association between tissue and circulating NET-related measures
Tissue MPO and pre-treatment blood MPO were positively correlated at the zero-order level (Pearson r = 0.824, p = 0.012; Spearman ρ = 0.667, p = 0.083). After controlling for treatment-response group (PD/DC), the partial correlation between tissue MPO and blood MPO remained significant and was, if anything, slightly stronger than the unadjusted estimate (partial Pearson r = 0.848, p = 0.008; partial Spearman ρ = 0.786, p = 0.028), indicating that the tissue–blood association was not simply an artifact of DC and PD patients occupying different regions of both distributions. In the corresponding scatter plot (Figure 1), DC samples (blue circles) and PD samples (red triangles) are distinguished by color and shape; PD samples tended to cluster toward higher tissue and blood MPO values, but the positive association was also apparent within each group individually.
For tissue H3, the correlation with pre-treatment blood NETs was weaker and did not reach statistical significance, either unadjusted (Pearson r = 0.447, p = 0.267; Spearman ρ = 0.214, p = 0.619) or after adjustment for treatment-response group (partial Pearson r = 0.434, p = 0.282; partial Spearman ρ = 0.500, p = 0.216) (Table 7, Figure 1).
Progression-free survival
Exploratory cutoff-based survival analysis
The PFS analyses included 52 patients, among whom 16 progression events occurred, and 36 patients were censored. An exploratory pretreatment NETs cutoff of 97.32 U/L was derived by maximizing the Youden index. Patients with NETs concentrations of 97.32 U/L or lower were classified as having low NETs, whereas those with concentrations above 97.32 U/L were classified as having high NETs.
Seventeen patients were classified as having low NETs and 35 as having high NETs. Two progression events occurred in the low-NETs group and 14 in the high-NETs group. Mean PFS was 32.12 months (SE, 2.58; 95% CI, 27.06–37.17) in the low-NETs group and 23.49 months (SE, 2.62; 95% CI, 18.35–28.62) in the high-NETs group. Median PFS was not reached in either group during follow-up.
The high-NETs group had shorter PFS than the low-NETs group in the Kaplan–Meier analysis (log-rank χ2 = 4.014, df = 1, p = 0.045; Table 8, Figure 2). Because the cutoff was derived and evaluated in the same cohort, this comparison is subject to data-snooping bias. The cutoff is exploratory, hypothesis-generating, and not recommended for clinical decision-making.
Continuous NETs in Cox proportional-hazards models
To reduce dependence on the exploratory cutoff, baseline NETs were also analyzed as a continuous predictor. In the univariable Cox model, each 1-U/L increase in pretreatment NETs was associated with a 1.7% increase in the hazard of progression or death (HR, 1.017; 95% CI, 1.002–1.032; p = 0.022).
In the multivariable Cox model adjusted for continuous CEA and CA15-3, higher baseline NETs remained associated with shorter PFS (HR per 1-U/L increase, 1.018; 95% CI, 1.003–1.033; p = 0.021). CEA showed a non-significant trend toward increased hazard (HR, 1.285; 95% CI, 0.978–1.689; p = 0.071), as did CA15-3 (HR, 1.059; 95% CI, 0.994–1.128; p = 0.074). The overall multivariable model was statistically significant (χ2= 11.510, df = 3, p = 0.009) (Table 9).
These results indicate that higher baseline NETs were associated with shorter PFS after adjustment for CEA and CA15-3. However, given the small number of events, the single-center design, and the exploratory nature of the analysis, the findings should be interpreted cautiously.
Internal validation and incremental predictive value
The apparent C-index for the Cox model containing continuous baseline NETs was 0.770. After internal validation using 1,000 bootstrap resamples, the estimated optimism was 0.0305, resulting in an optimism-corrected C-index of 0.739 (95% CI, 0.613–0.866). This indicates moderate discriminative ability with modest optimism correction (Table 9). For progression status by 36 months, the AUC was 0.694 (95% CI, 0.534–0.854) for the NETs-only model and 0.802 (95% CI, 0.664–0.940) for the combined model containing NETs, CEA, and CA15-3. Although the combined model had a numerically higher AUC, the difference was not statistically significant according to DeLong’s test (AUC difference, 0.108; Z = -1.469; p = 0.142).
The addition of CEA and CA15-3 to NETs was associated with improved reclassification and discrimination. The continuous NRI was 0.931 (95% CI, 0.167–1.443; p = 0.018), and the IDI was 0.146 (95% CI, 0.017–0.369; p < 0.001) (Table 10, Table 11, Table 12, Figure 3). These results suggest potential incremental value from combining NETs with established tumor markers; however, the nonsignificant DeLong comparison and limited number of events indicate that the improvement should be considered exploratory.
Analysis of patients with incomplete follow-up
Four patients, representing 6.7% of the initially enrolled cohort, were excluded from the primary analyses because of incomplete follow-up. Available baseline characteristics were compared between these patients and the 52 patients included in the corresponding analysis.
Mean age was similar in the excluded and included groups: 55.25 ± 3.30 years versus 55.54 ± 11.63 years, respectively (p = 0.961). No statistically significant difference was observed in TNM stage (p = 0.788) or M status (p = 0.525). Because some excluded patients had missing biomarker measurements, NETs, CEA, and CA15-3 levels were not compared.
These comparisons did not identify statistically significant baseline differences; however, the very small number of excluded patients limits the power to detect potentially important differences or determine whether missing follow-up was informative (Table 13).
Additional details on collinearity diagnostics, model fit, survival statistics, bootstrap internal validation, NRI/IDI components, normality tests, missing-data comparisons, and mixed-model parameters are provided in Supplementary Table 1, Supplementary Table 2, Supplementary Table 3, Supplementary Table 4, Supplementary Table 5, Supplementary Table 6, Supplementary Table 7, and Supplementary Table 8.
In summary, patients with progressive disease had higher baseline circulating NETs, CEA, and CA15-3 concentrations than patients with disease control. NETs decreased during treatment in the disease-control group but increased in the progressive-disease group, resulting in a significant Group × Time interaction. Higher baseline NETs were associated with treatment progression and shorter PFS in exploratory multivariable analyses. The addition of CEA and CA15-3 to NETs improved reclassification and discrimination measures, although the increase in AUC was not statistically significant. Tissue MPO showed a positive correlation with circulating MPO-DNA concentrations in the small paired-sample analysis, whereas tissue H3 did not show a significant correlation.
DATA AVAILABILITY:
The de-identified data generated and analyzed during this study, together with the statistical analysis outputs used to support the findings, are provided in the supplementary files. Raw data can be accessed from Zenodo via https://zenodo.org/records/22613071.
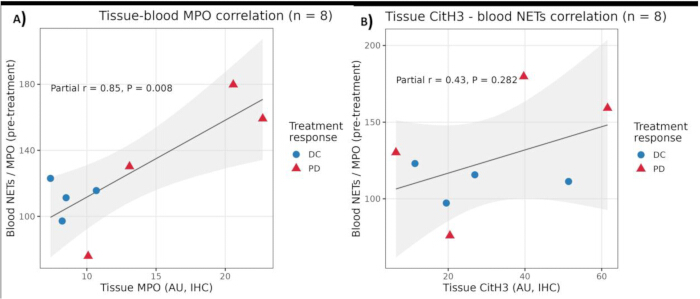
Figure 1: Correlations between tissue and blood NETs markers, controlling for disease group (PD/DC). (A) Tissue–blood MPO correlation (n = 8). Scatter plot showing the association between tissue MPO (arbitrary units, IHC) and pre-treatment circulating NETs/MPO concentration. Blue circles represent patients with disease control (DC); red triangles represent patients with progressive disease (PD). The solid line indicates the fit from partial correlation analysis controlling for disease group (PD/DC) (partial r = 0.85, p = 0.008). (B) Tissue H3–blood NETs correlation (n = 8). Scatter plot showing the association between tissue H3 (arbitrary units, IHC) and pre-treatment circulating NETs/MPO concentration; Blue circles represent patients with disease control (DC); red triangles represent patients with progressive disease (PD). The solid line indicates the fit from partial correlation analysis controlling for disease group (PD/DC) (partial r = 0.43, p = 0.282). Please click here to view a larger version of this figure.
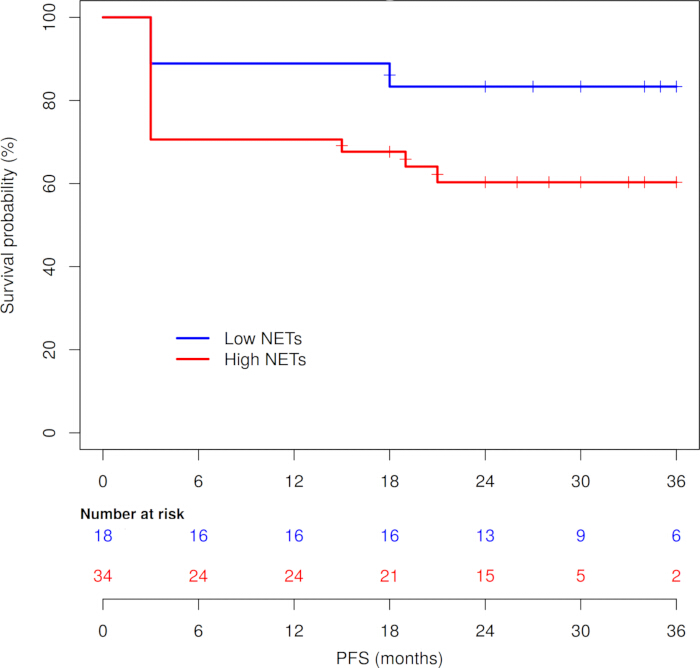
Figure 2: PFS by baseline NETs group. Kaplan–Meier curves showing PFS for patients with low vs. high baseline NETs levels. Y-axis: survival probability (%). X-axis: PFS (months). The low-NETs group is shown in blue and the high-NETs group in red. The number of patients at risk at baseline and at selected time points is indicated below the x-axis. Please click here to view a larger version of this figure.
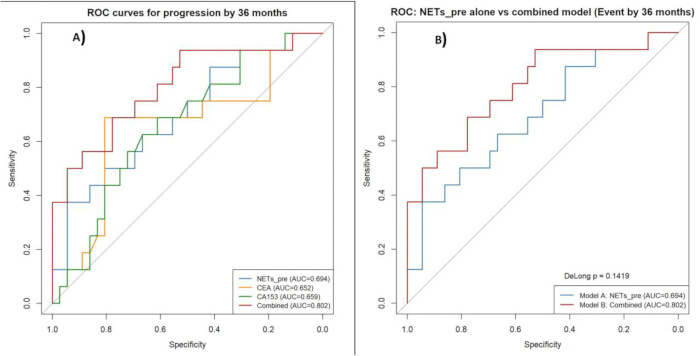
Figure 3: ROC curves for the prediction of disease progression. Y-axis: Sensitivity (%). X-axis: 100% − Specificity (%). NETs-only model AUC = 0.694 (95% CI, 0.534–0.854); combined model (NETs + CEA + CA15-3) AUC = 0.802 (95% CI, 0.664–0.940); DeLong’s test p = 0.142. Please click here to view a larger version of this figure.
| Variable | Overall (n = 56) | DC (n = 38) | PD (n = 18) | P-value |
| Age (Years) | 55.54 ± 11.23 | 56.87 ± 11.25 | 52.67 ± 10.94 | 0.193 |
| WBC (×109 g/L) | 5.83 [4.80, 8.53] | 5.77 [4.79, 8.57] | 5.93 [4.89, 7.32] | 0.993 |
| Neut percent (%) | 59.30 ± 9.19 | 60.03 ± 9.62 | 57.76 ± 8.25 | 0.394 |
| Neut (×109 g/L) | 3.30 [2.50, 4.93] | 3.40 [2.49, 4.80] | 3.23 [2.71, 4.96] | 0.861 |
| Lymp (×109 g/L) | 1.78 [1.46, 2.37] | 1.83 [1.45, 2.31] | 1.67 [1.46, 2.46] | 0.875 |
| RBC (×1012 g/L) | 4.11 ± 0.42 | 4.05 ± 0.43 | 4.24 ± 0.38 | 0.120 |
| Hg (g/L) | 124.51 ± 12.23 | 123.81 ± 12.09 | 125.99 ± 12.72 | 0.539 |
| Plt (×109 g/L) | 184.49 ± 32.82 | 181.30 ± 33.88 | 191.23 ± 30.25 | 0.294 |
| CA15-3 (U/mL) | 30.94 ± 8.54 | 29.11 ± 8.27 | 34.81 ± 7.99 | 0.018 |
| CEA (ng/mL) | 5.84 ± 1.77 | 5.441 ± 1.68 | 6.696 ± 1.68 | 0.012 |
| ER (%) | 0.072 | |||
| (-) | 20 (35.7%) | 17 (44.7%) | 3 (16.8%) | |
| (+) | 36 (64.3%) | 21 (55.3%) | 15 (83.3%) | |
| PR | 0.364 | |||
| (-) | 18 (32.1%) | 14 (36.9%) | 4 (22.2%) | |
| (+) | 38 (67.9%) | 24 (63.2%) | 14 (77.8%) | |
| Ki67 (%) | 0.542 | |||
| <50% | 16 (28.6%) | 12 (31.6%) | 4 (22.2%) | |
| ≥50% | 40 (71.4%) | 26 (68.4%) | 14 (77.8%) | |
| ALNM (%) | 0.999 | |||
| (-) | 2 (3.6%) | 2 (5.3%) | 0 (0.0%) | |
| (+) | 54 (96.4%) | 36 (94.7%) | 18 (100.0%) | |
| T (%) | 0.405 | |||
| T1 | 6 (10.7%) | 4 (10.5%) | 2 (11.1%) | |
| T2 | 36 (64.3%) | 25 (65.8%) | 11 (61.1%) | |
| T3 | 10 (17.9%) | 5 (13.2%) | 5 (27.8%) | |
| T4 | 4 (7.1%) | 4 (10.5%) | 0 (0.0%) | |
| N (%) | 0.732 | |||
| N0 | 2 (3.6%) | 2 (5.3%) | 0 (0.0%) | |
| N1 | 6 (10.7%) | 3 (7.9%) | 3 (16.7%) | |
| N2 | 41 (73.2%) | 28 (73.7%) | 13 (72.2%) | |
| N3 | 7 (12.5%) | 5 (13.2%) | 2 (11.1%) | |
| M (%) | 0.010 | |||
| M0 | 48 (85.7%) | 36 (94.7%) | 12 (66.7%) | |
| M1 | 8 (14.3%) | 2 (5.3%) | 6 (33.3%) | |
| TNM (%) | 0.043 | |||
| IIIA | 39 (69.6%) | 28 (73.7%) | 11 (61.1%) | |
| IIIB | 3 (5.4%) | 3 (7.9%) | 0 (0.0%) | |
| IIIC | 6 (10.7%) | 5 (13.2%) | 1 (5.7%) | |
| IV | 8 (14.3%) | 2 (5.3%) | 6 (33.3%) |
Table 1: Baseline characteristics of the two patient groups.
| Biomarker | Group | N | Mean ± SD | Levene's F | Levene's P | t (equal variances) | df | P (2-tailed) | Mean Difference (DC − PD) | 95% CI of Difference |
| NETs (U/L) | DC | 38 | 108.02 ± 28.95 | 2.361 | 0.130 | −2.321 | 54 | 0.024 | −20.54 | −38.27 to −2.80 |
| PD | 18 | 128.55 ± 34.83 | ||||||||
| CEA (ng/mL) | DC | 38 | 5.44 ± 1.68 | 0.002 | 0.962 | −2.605 | 54 | 0.012 | −1.25 | −2.22 to −0.29 |
| PD | 18 | 6.70 ± 1.68 | ||||||||
| CA15-3 (U/mL) | DC | 38 | 29.11 ± 8.27 | 0.027 | 0.870 | −2.432 | 54 | 0.018 | −5.69 | −10.39 to −1.00 |
| PD | 18 | 34.81 ± 7.99 |
Table 2: Baseline biomarkers by response group (DC vs PD) with Levene’s test and t-tests. All three biomarkers showed significantly higher baseline levels in the PD group compared with the DC group. Levene’s test p > 0.05 for all, indicating equal variances; therefore, the standard independent t-test (equal variances assumed) was used.
| Group | N | Pre-treatment NETs (U/L) | Post-treatment NETs (U/L) | Mean Δ (Post − Pre) | SD of Δ | t | df | P (2-tailed) | 95% CI of Δ |
| DC | 38 | 108.02 ± 28.95 | 100.04 ± 20.21 | −7.97 | 21.53 | 2.283 | 37 | 0.028 | −15.05 to −0.90 |
| PD | 18 | 128.55 ± 34.83 | 142.50 ± 19.33 | 13.95 | 26.10 | −2.267 | 17 | 0.037 | −26.92 to −0.97 |
Table 3: Pre–post NETs changes within DC and PD groups (paired t-tests). ΔNETs = Post-treatment NETs − Pre-treatment NETs. Negative Δ indicates a decrease in NETs after treatment. In the DC group, NETs decreased significantly; in the PD group, NETs increased significantly. Shapiro–Wilk tests indicated no departure from normality for ΔNETs in either group (DC: p = 0.162; PD: p = 0.623), supporting the use of paired t-tests.
Fixed effects (Type III tests)
| Effect | Numerator df | Denominator df | F | P-value |
| Intercept | 1 | 54 | 1288.833 | <0.001 |
| Response group (DC vs PD) | 1 | 54 | 22.278 | <0.001 |
| Time (pre vs post) | 1 | 54 | 0.818 | 0.370 |
| Group × Time | 1 | 54 | 11.032 | 0.002 |
Estimates of fixed effects
| Parameter | Estimate | SE | df | t | P-value | 95% CI (Lower) | 95% CI (Upper) |
| Intercept (PD, post) | 142.50 | 6.13 | 78.9 | 23.24 | <0.001 | 130.29 | 154.70 |
| Response = DC (vs PD) | −42.45 | 7.44 | 78.9 | −5.70 | <0.001 | −57.27 | −27.64 |
| Time = pre (vs post) | −13.95 | 5.44 | 54 | −2.57 | 0.013 | −24.84 | −3.05 |
| DC × pre (interaction) | 21.92 | 6.60 | 54 | 3.32 | 0.002 | 8.69 | 35.15 |
Estimated marginal means of NETs (U/L)
| Group | Time | Mean NETs | SE | 95% CI |
| DC | Pre | 108.02 | 4.22 | 99.62–116.42 |
| DC | Post | 100.04 | 4.22 | 91.64–108.44 |
| PD | Pre | 128.55 | 6.13 | 116.35–140.76 |
| PD | Post | 142.50 | 6.13 | 130.29–154.70 |
Table 4: Linear mixed-effects model for NETs concentration over time by response group. The significant Group × Time interaction (p = 0.002) indicates that the trajectory of NETs from pre- to post-treatment differs between DC and PD groups. In the DC group, NETs decreased over time, whereas in the PD group, NETs increased.
| Variable | OR | 95% CI (Lower) | 95% CI (Upper) | P-value |
| NETs (U/L) | 1.026 | 1.004 | 1.048 | 0.023 |
| CEA (ng/mL) | 1.475 | 1.002 | 2.171 | 0.049 |
| CA15-3 (U/mL) | 1.070 | 0.983 | 1.166 | 0.118 |
Table 5: Firth regression model for disease progression (PD vs DC). Model fit and diagnostics; Method: Firth’s penalized maximum likelihood estimation; Nagelkerke R2 = 0.673; Hosmer–Lemeshow goodness-of-fit test: χ2 = 7.516, df = 8, p = 0.482; Collinearity: all VIF ≈ 1.0 (no evidence of severe multicollinearity).
| Marker | Group | N | Mean Intensity ± SD (AU) | Levene's F | Levene's P | t | df | P (2-tailed) | Mean Diff (DC − PD) | 95% CI |
| MPO | DC | 4 | 8.69 ± 1.41 | 14.879 | 0.008 | −2.440 | 3.26 (Welch) | 0.086 | −8.49 | −19.08 to 2.10 |
| PD | 4 | 17.18 ± 6.81 | ||||||||
| H3 | DC | 4 | 27.29 ± 17.27 | 0.724 | 0.428 | −0.320 | 6 | 0.760 | −4.72 | −40.84 to 31.40 |
| PD | 4 | 32.02 ± 23.95 |
Table 6: Immunofluorescence intensity by response group (H3 and MPO). The analysis included 8 tissue specimens, with 4 specimens in each group. Data are presented as mean ± SD using one specimen-level mean per tissue section. Histone H3 was compared using an independent-samples t-test, whereas MPO was compared using Welch’s t-test because the equal-variance assumption was not satisfied. Neither marker differed statistically significantly between the DC and PD groups.
| Variable pair | Zero-order r (ρ) | P-value | Partial r (ρ*) | P-value |
| Tissue MPO – Blood MPO | 0.824 (0.667) | 0.012 (0.083) | 0.848 (0.786) | 0.008 (0.028) |
| Tissue H3 – Blood NETs | 0.447 (0.214) | 0.267 (0.619) | 0.434 (0.500) | 0.282 (0.216) |
Table 7: Zero-order and partial correlations between tissue and blood NETs markers, controlling for disease group (PD/DC). Partial correlations control for disease group (PD/DC)
| NETs group | N | Events (PD) | Censored | Median PFS (months) | Mean PFS (months) ± SE | 95% CI for mean (months) |
| Low | 17 | 2 | 15 | Not reached | 32.12 ± 2.58 | 27.06–37.17 |
| High | 35 | 14 | 21 | Not reached | 23.49 ± 2.62 | 18.35–28.62 |
| Overall | 52 | 16 | 36 | — | 26.31 ± 2.03 | 22.32–30.29 |
Table 8: PFS by NETs group (Kaplan–Meier, cutoff-based). Group comparison (log-rank test); Log-rank χ2 = 4.014, df = 1, p = 0.045. NETs group defined using the exploratory cutoff of 97.32 U/L (low ≤ 97.32, high > 97.32). Median PFS was not reached in either group within the follow-up period.
| Univariate Cox model (continuous NETs) | ||||
| Variable | HR (Exp(B)) | 95% CI (Lower) | 95% CI (Upper) | P-value |
| NETs (per U/L) | 1.017 | 1.002 | 1.032 | 0.022 |
| Multivariable Cox model (NETs + CEA + CA15-3) | ||||
| Variable | HR (Exp(B)) | 95% CI (Lower) | 95% CI (Upper) | P-value |
| NETs (per U/L) | 1.018 | 1.003 | 1.033 | 0.021 |
| CEA (per ng/mL) | 1.285 | 0.978 | 1.689 | 0.071 |
| CA15-3 (per U/mL) | 1.059 | 0.994 | 1.128 | 0.074 |
Table 9: Cox proportional hazards models for PFS. For the univariate Cox model: Omnibus test: χ2 = 5.538, df = 1, p = 0.019; Events: 16 / 52 (30.8%). For multivariate Cox model: Omnibus test: χ2 = 11.510, df = 3, p = 0.009; Events: 16 / 52 (30.8%).
| Metric | Value (95% CI) |
| Number of patients | 52 |
| Number of events (progression) | 16 |
| Apparent C-index | 0.77 |
| Mean optimism (bootstrap) | 0.0305 |
| Optimism-corrected C-index | 0.739 (0.613–0.866) |
| Number of bootstrap resamples | 1000 |
Table 10: Internal validation of NETs-based PFS model (bootstrap-corrected C-index). The C-index represents the discriminative ability of the NETs-based Cox model for PFS. Optimism correction was performed using 1000 bootstrap resamples.
| Model | AUC | 95% CI |
| Model A: NETs alone | 0.694 | 0.534–0.854 |
| Model B: NETs + CEA + CA15-3 | 0.802 | 0.664–0.940 |
Table 11. ROC analysis and DeLong comparison for 36-month progression. DeLong test (Model B vs Model A); AUC difference (B−A) = 0.108; Z = −1.469, p = 0.142. Outcome: progression by 36 months (n = 16 events). Although the combined model showed a higher AUC, the difference was not statistically significant in this small cohort (DeLong p = 0.142).
| Metric | Estimate | 95% CI | P-value |
| NRI (total) | 0.931 | 0.167–1.443 | 0.018 |
| IDI | 0.146 | 0.017–0.369 | <0.001 |
Table 12: NRI and IDI for addition of CEA and CA15-3 to NETs (36-month PFS). NRI = net reclassification improvement; IDI = integrated discrimination improvement.
| Variable | Excluded (n = 4) | Included (n = 52) | P-value* |
| Age (years) | 55.25 ± 3.30 | 55.54 ± 11.63 | 0.961 |
| NETs (U/L) | — | — | — |
| CEA (ng/mL) | — | — | — |
| CA15-3 (U/mL) | — | — | — |
| TMN stage, n (%) | 0.788 | ||
| IIIA | 3 (75.0%) | 36 (69.2%) | |
| IIIB | 0 (0.0%) | 3 (5.8%) | |
| IIIC | 0 (0.0%) | 6 (11.5%) | |
| IV | 1 (25.0%) | 7 (13.5%) | |
| M status, n (%) | 0.525 | ||
| M0 | 3 (75.0%) | 45 (86.5%) | |
| M1 | 1 (25.0%) | 7 (13.5%) |
Table 13: Baseline characteristics of included vs excluded patients. P-values from an independent t-test (age) and a Pearson chi-square test (TNM, M status). For age, Levene’s test p = 0.058; equal variances assumed. For TMN, 5 of 8 cells (62.5%) had expected count <5; results should be interpreted cautiously. For M status, Fisher’s exact test p = 0.470.
Supplementary Figure 1: Schematic overview of patient enrollment, blood sampling time points, and biomarker analyses. Patients with HER2-positive breast cancer receiving adjuvant trastuzumab-based therapy were prospectively enrolled. Peripheral blood was collected at baseline and during treatment for measurement of circulating NETs (MPO-DNA complexes), CA15-3, and CEA. Please click here to download this file.
Supplementary Figure 2: Study flow diagram showing enrollment, exclusions due to missing follow-up, and final allocation to progressive disease (PD) and disease control (DC) groups. Please click here to download this file.
Supplementary Figure 3: Comparative analysis of circulating NETs, CA15-3, and CEA concentrations according to treatment-response group and treatment time. The y-axis shows the measured biomarker concentration, and the x-axis shows the corresponding comparison groups. Data are presented as mean ± standard deviation. Each point represents an individual patient. (A–D) NETs concentration (U/L). (A) pretreatment NETs in patients with progressive disease (PD) versus disease control (DC). (B) pretreatment versus post-treatment NETs in the DC group. (C) pretreatment versus post-treatment NETs in the PD group. (D) post-treatment NETs in the PD versus DC groups. (E) pretreatment CA15-3 concentrations in U/mL in the PD and DC groups. (F) pretreatment CEA concentrations in ng/mL in the PD and DC groups. For independent-group comparisons, equality of variances was assessed using Levene’s test. Because the variance assumptions were satisfied for the reported comparisons, standard independent-samples t-tests were used. For within-group pretreatment versus post-treatment comparisons, normality was assessed using the Shapiro–Wilk test applied to the paired difference scores. Because the difference scores were approximately normally distributed in both groups, paired t-tests were used. Statistical significance was defined as p < 0.05. Please click here to download this file.
Supplementary Figure 4: Immunofluorescence analysis of H3 and MPO expression in tumor tissues from PD versus DC groups. Representative immunofluorescence images of H3 (green) and myeloperoxidase (MPO, red) staining in formalin-fixed, paraffin-embedded tumor sections from patients with progressive disease (PD) and disease control (DC). Nuclei were counterstained with DAPI (blue). (A) Low H3 and MPO expression in the DC group. (B) H3 and MPO expression with colocalization in the PD group. Scale bars represent 100 µm and are shown in the lower right corner of each image. Please click here to download this file.
Supplementary Figure 5: Receiver operating characteristic (ROC) analysis for prediction of disease progression. ROC curves for baseline NETs, CA15-3, CEA, and the combined model (NETs + CA15-3 + CEA) in predicting progressive disease (PD) vs. disease control (DC). Y-axis: Sensitivity (true positive rate), from 0% to 100%. X-axis: 100% − Specificity (false positive rate), from 0% to 100%. Please click here to download this file.
Supplementary Table 1: Collinearity diagnostics for the parsimonious logistic regression model. VIF, variance inflation factor. All VIF values are close to 1, indicating no evidence of severe multicollinearity among the predictors. Please click here to download this file.
Supplementary Table 2: Collinearity diagnostics and model fit for the Firth-penalized logistic regression model. VIF, variance inflation factor. All VIF values are close to 1, indicating no evidence of severe multicollinearity among the predictors. Hosmer–Lemeshow P > 0.05 indicates good model fit. Please click here to download this file.
Supplementary Table 3: Additional survival statistics by NETs group. Breslow: χ2 = 3.652, df = 1, p = 0.056; Tarone–Ware: χ2 = 3.840, df = 1, p = 0.050. Please click here to download this file.
Supplementary Table 4: Additional details for bootstrap and NRI/IDI analyses. Please click here to download this file.
Supplementary Table 5: Normality tests for ΔNETs (post − pre) by response group. p > 0.05 in both groups, indicating no evidence against the normality of ΔNETs. Please click here to download this file.
Supplementary Table 6: Chi-square test details for stage and metastasis status by inclusion status. For TMN stage: 5 of 8 cells (62.5%) had expected count <5 (minimum expected count = 0.21), so the chi-square test has limited reliability. For M status: Two cells (50%) had expected count <5 (minimum expected count = 0.57). Please click here to download this file.
Supplementary Table 7: Covariance parameters for the linear mixed model. The significant intercept variance indicates substantial between-patient variability in NETs levels, supporting the use of a random intercept for PatientID. Please click here to download this file.
Supplementary Table 8: Parsimonious multivariable logistic regression model for disease progression (PD vs DC). Model fit and diagnostics; Hosmer–Lemeshow goodness-of-fit test: χ2 = 7.913, df = 7, p = 0.340; Nagelkerke R2 = 0.130; Sample size: n = 56 (38 DC, 18 PD). Please click here to download this file.
المناقشة
NETs have emerged as important mediators of cancer progression, metastasis, and therapy resistance across multiple malignancies, including breast cancer17,18,19,20. NETs are web-like structures composed of decondensed chromatin and granular proteins released by activated neutrophils, and they have been shown to promote pro-metastatic phenotypes through epithelial–mesenchymal transition, enhance tumor cell survival, and remodel the tumor immune microenvironment to favor immune evasion21,22,23,24. In breast cancer specifically, elevated circulating markers of neutrophil activation and NETs formation have been associated with advanced stage, metastatic burden, and poorer prognosis. Beyond their role in tumor biology, NETs have also been implicated in cancer-related thrombosis and inflammation, further contributing to adverse outcomes25,26,27. In parallel, HER2-targeted therapies such as trastuzumab and trastuzumab emtansine (T-DM1) have transformed the management of HER2-positive breast cancer, yet resistance remains a major clinical challenge. Mechanisms of trastuzumab resistance include alterations in HER2 signaling, immune escape, and therapy-induced plasticity, with emerging evidence suggesting that chemotherapy and targeted agents can themselves induce NETs release, potentially creating a feedback loop that promotes resistance28,29,30,31. Recent studies have further highlighted the interplay between NETs and immune checkpoint pathways, including PD-L1-decorated NETs that suppress T-cell function and facilitate metastasis, raising the possibility that NETs may modulate response to both HER2-targeted and immunotherapeutic strategies32,33,34,35. Against this backdrop, understanding whether NETs can serve as predictive or prognostic biomarkers in HER2-positive breast cancer, and how they relate to treatment efficacy and resistance, is of growing translational interest.
In this prospective cohort of patients with HER2-positive breast cancer receiving trastuzumab-based therapy, higher pretreatment circulating NETs, measured indirectly as MPO-DNA complexes, were associated with disease progression and shorter PFS. Baseline NETs, CEA, and CA15-3 concentrations were higher in patients with progressive disease than in those with disease control. In the parsimonious multivariable model, higher baseline NETs remained associated with progression after consideration of CEA and CA15-3. In the Firth-penalized model, which was used to reduce small-sample bias, higher NETs and CEA were associated with increased odds of progression, whereas CA15-3 was not statistically significant. Longitudinal analysis further showed that NETs decreased in the disease-control group but increased in the progressive-disease group, resulting in a significant Group × Time interaction. These findings suggest that baseline NETs and their treatment-associated trajectories may provide complementary information about tumor biology and treatment response. However, because MPO-DNA complexes are an indirect surrogate of NET burden and the study was exploratory, these associations should not be interpreted as evidence that NETs independently cause trastuzumab resistance.
Higher baseline NETs were also associated with shorter PFS when analyzed as a continuous variable and when categorized using an exploratory cutoff derived from the same cohort. The association remained after adjustment for CEA and CA15-3, suggesting that NETs may provide information beyond these established tumor markers. The bootstrap optimism-corrected C-index of 0.739 indicated moderate apparent discrimination after internal correction. Adding CEA and CA15-3 to NETs improved continuous NRI and IDI, although the increase in AUC was not statistically significant by DeLong’s test. The internally derived cutoff is subject to data-snooping bias and should therefore be regarded as hypothesis-generating rather than clinically actionable. Similarly, the reclassification results may be unstable because of the modest number of progression events. External validation in larger, independent cohorts will be necessary to determine whether a multimarker model provides reproducible and clinically meaningful improvement over NETs or conventional tumor markers alone.
At the tissue level, MPO and histone H3 fluorescence intensities were numerically higher in patients with progressive disease than in those with disease control; however, neither between-group comparison was statistically significant. The tissue analysis included eight specimens, with four specimens in each response group, and the mean fluorescence intensity across five fields was averaged for each specimen before statistical analysis. Tissue MPO showed a positive correlation with pretreatment circulating MPO-DNA concentrations after adjustment for treatment-response group, providing preliminary evidence of an association between tissue MPO and circulating NET-related measurements in this cohort. However, this finding does not establish circulating MPO-DNA as a validated surrogate for intratumoral NET activity. In contrast, tissue histone H3 was not significantly correlated with circulating MPO-DNA concentrations. This discrepancy may reflect biological differences between MPO and histone H3, variation in tissue staining or marker stability, or limited statistical power due to the small number of paired specimens. The ELISA and immunofluorescence protocols included standardized sample handling, duplicate plasma measurements, assay-precision assessment, predefined tissue-field sampling, consistent imaging settings, background correction, and blinded image quantification. Nevertheless, MPO-DNA complexes represent an indirect measure of NET-related activity, and the absence of DNase I digestion and cell-impermeable DNA-dye controls limits the extent to which NET formation can be confirmed morphologically. Future studies should evaluate larger numbers of paired tissue and blood specimens and incorporate orthogonal NET-related markers, such as citrullinated histone H3, cell-free DNA with NET-specific signatures, neutrophil elastase–DNA complexes, and functional controls.
Several biologically plausible mechanisms may link elevated NETs to reduced trastuzumab efficacy. NETs can remodel the tumor microenvironment by promoting epithelial–mesenchymal transition, tumor-cell invasion, and angiogenesis through the release of proteases and proangiogenic factors. They may also impair antitumor immunity through interactions with T cells and immune-checkpoint pathways, potentially weakening trastuzumab-mediated antibody-dependent cellular cytotoxicity. Chemotherapy and targeted agents may further stimulate NET release, creating a possible feedback loop involving tumor-cell survival, thromboinflammation, and metastatic spread. These mechanisms could contribute to treatment resistance, but they were not directly tested in the present observational study. Important limitations also include the modest sample size, 16–18 progression events across the different analysis populations, the risk of overfitting, the small tissue–blood correlation subgroup, and the single-center design. In addition, detailed information on ER/PR status, Ki-67, metastatic sites, and complete chemotherapy histories was not systematically available for all patients, limiting adjustment for potential confounding. Four patients were excluded from the PFS and multivariable analyses because of incomplete or inconsistent follow-up information. Although available baseline comparisons did not identify significant differences, informative missingness cannot be excluded.
Despite these limitations, our findings provide preliminary evidence that circulating NETs are associated with trastuzumab efficacy and prognosis in HER2-positive breast cancer. NETs appear more suitable as an adjunctive biomarker within a multimarker panel than as a standalone test, given their moderate discrimination, the indirect nature of the assay, and the exploratory derivation of the cutoff. The standardized approach to blood processing, MPO-DNA measurement, longitudinal sampling, tissue immunofluorescence, blinded image analysis, and internal validation may facilitate reproducibility in future studies. Future multicenter prospective investigations should enroll larger and clinically diverse populations, prespecify biomarker and PFS analyses, collect comprehensive tumor and treatment variables, and validate the findings using more specific NETs assays. Functional experiments should also determine whether NETs actively contribute to trastuzumab resistance and whether NET-targeting interventions can enhance HER2-directed therapy. Thus, higher baseline NETs and unfavorable NETs dynamics may have potential value for research-based risk stratification, but validation is required before NETs-guided monitoring or treatment decisions can be considered in clinical practice.
الإفصاحات
The authors declare that there is no conflict of interest.
AI tool was used for language editing and improvement of manuscript clarity. The authors critically reviewed and approved all suggested changes and remain fully responsible for the accuracy, originality, interpretation, and integrity of the work. No artificial-intelligence tool was used to generate, analyze, or interpret the study data, or to prepare the figures.
شكر وتقدير
The authors thank the patients who participated in this study and the clinical and laboratory staff of Hefei First People’s Hospital for their assistance with patient recruitment, sample collection, and laboratory analyses.
This work received no specific grant from any funding agency in the public, commercial, or not-for-profit sectors.
المواد
| الاسم | الشركة | رقم فهرسي | التعليقات |
|---|---|---|---|
| Anti-DNA antibody, horseradish peroxidase–conjugated | Sigma-Aldrich | A9044; RRID: AB_258452 | |
| Anti-histone H3 antibody, mouse monoclonal | Abcam | ab1791; RRID: AB_302613 | |
| Anti-MPO antibody, rabbit polyclonal | Agilent Technologies (Dako) | A0398; RRID: AB_2314679 | |
| Bovine serum albumin (BSA), fraction V | Sigma-Aldrich | A7906 | |
| Citrate buffer, pH 6.0, for antigen retrieval | Sigma-Aldrich | C9999 | |
| Custom MPO-DNA ELISA kit | Hycult Biotech | HC1040 | |
| DAPI solution, 1 mg/mL in water | Thermo Fisher Scientific | 62248 | |
| Doxorubicin hydrochloride | Sigma-Aldrich | D1515 | |
| EDTA blood collection tubes, 5 mL | BD Biosciences | 367835 | |
| Ethanol, absolute, molecular biology grade | Sigma-Aldrich | E7023 | |
| Fluorescence microscope with digital camera | Leica Microsystems | DM5500 B | |
| GraphPad Prism software | GraphPad Software | Version 9.5; RRID: SCR_002798 | |
| Horseradish peroxidase substrate, TMB | Thermo Fisher Scientific | 34028 | Tetramethylbenzidine |
| Microplate reader, absorbance | BioTek Instruments | Epoch 2 | |
| Normal goat serum, blocking reagent | Thermo Fisher Scientific | 16210064 | |
| Paclitaxel injection | Sigma-Aldrich | T7191 | |
| Phosphate-buffered saline (PBS), 1×, sterile | Gibco (Thermo Fisher Scientific) | 10010023 | |
| R statistical software | R Foundation for Statistical Computing | Version 4.3.2; RRID: SCR_001905 | |
| SPSS software | IBM | Version 26; RRID: SCR_019096 | |
| Trastuzumab injection | Genentech/Roche | NDC 50242-0123-01 | |
| Wash buffer, PBS with 0.05% Tween-20 | Sigma-Aldrich | P7949 |
المراجع
- Martins-Cardoso K, et al. Neutrophil extracellular traps (NETs) promote pro-metastatic phenotype in human breast cancer cells through epithelial–mesenchymal transition. Cancers (Basel). 2020;12(6):1542.
- Snoderly HT, Boone BA, Bennewitz MF. Neutrophil extracellular traps in breast cancer and beyond: current perspectives on NET stimuli, thrombosis and metastasis, and clinical utility for diagnosis and treatment. Breast Cancer Res. 2019;21(1):145.
- Krawczyk N, et al. Post-neoadjuvant treatment in HER2-positive breast cancer: escalation and de-escalation strategies. Cancers (Basel). 2022;14(12):3002.
- Jørgensen JT. Twenty-five years with HER2 targeted therapy. Ann Transl Med. 2024;12(3):53.
- Geyer CE, et al. Survival with trastuzumab emtansine in residual HER2-positive breast cancer. N Engl J Med. 2025;392(3):249–57.
- Nakajima H, Nakatsura T. Towards the era of immune checkpoint inhibitors and personalized cancer immunotherapy. Immunol Med. 2021;44(1):10–5.
- Hum M, Lee ASG. DNA methylation in breast cancer: early detection and biomarker discovery through current and emerging approaches. J Transl Med. 2025;23(1):465.
- Chen Y, et al. The role of neutrophil extracellular traps in cancer progression, metastasis and therapy. Exp Hematol Oncol. 2022;11(1):99.
- Kaltenmeier C, et al. Neutrophil extracellular traps (NETs) in cancer metastasis. Cancers (Basel). 2021;13(23):6131.
- Nunomura J, et al. Interleukin-1β triggers matrix metalloprotease-3 expression through p65/RelA activation in melanoma cells. PLoS One. 2022;17(11):e0278220.
- Rosell A, et al. Prognostic value of circulating markers of neutrophil activation, neutrophil extracellular traps, coagulation and fibrinolysis in patients with terminal cancer. Sci Rep. 2021;11(1):5074.
- Guan X, Guan X, Zhao Z, Yan H. NETs: important players in cancer progression and therapeutic resistance. Exp Cell Res. 2024;441(2):114191.
- Zhou X, et al. Tumor cell-released autophagosomes (TRAPs) induce PD-L1-decorated NETs that suppress T-cell function to promote breast cancer pulmonary metastasis. J Immunother Cancer. 2024;12(6):e009082.
- Zhu B, et al. NF-κB and neutrophil extracellular traps cooperate to promote breast cancer progression and metastasis. Exp Cell Res. 2021;405(2):112707.
- Xu X, et al. Asiatic acid inhibits cardiac hypertrophy by blocking interleukin-1β-activated nuclear factor-κB signaling in vitro and in vivo. J Thorac Dis. 2015;7(10):1787–97.
- Efrimescu CI, Buggy PM, Buggy DJ. Neutrophil extracellular trapping role in cancer, metastases, and cancer-related thrombosis: a narrative review of the current evidence base. Curr Oncol Rep. 2021;23(10):118.
- Herre M, Cedervall J, Mackman N, Olsson AK. Neutrophil extracellular traps in the pathology of cancer and other inflammatory diseases. Physiol Rev. 2023;103(1):277–312.
- Huang Z, et al. Neutrophil extracellular trap-associated risk index for predicting outcomes and response to Wnt signaling inhibitors in triple-negative breast cancer. Sci Rep. 2024;14(1):4232.
- Xu X, et al. Neutrophil extracellular traps in breast cancer: roles in metastasis and beyond. J Cancer. 2024;15(11):3272–83.
- Ansari J, et al. Regulating neutrophil PAD4/NOX-dependent cerebrovascular thromboinflammation. Int J Biol Sci. 2023;19(3):852–64.
- Chan A, et al. Final efficacy results of neratinib in HER2-positive hormone receptor-positive early-stage breast cancer from the phase III ExteNET trial. Clin Breast Cancer. 2021;21(1):80–91.e7.
- Papayannopoulos V. Neutrophil extracellular traps in immunity and disease. Nat Rev Immunol. 2018;18(2):134–47.
- Eli LD, Kavuri SM. Mechanisms of neratinib resistance in HER2-mutant metastatic breast cancer. Cancer Drug Resist. 2022;5(4):873–81.
- Wu L, et al. Breast cancer cell–neutrophil interactions enhance neutrophil survival and pro-tumorigenic activities. Cancers (Basel). 2020;12(10):2884.
- Fang Q, et al. No NETs no TIME: crosstalk between neutrophil extracellular traps and the tumor immune microenvironment. Front Immunol. 2022;13:1075260.
- Shen M, et al. Tumor-associated neutrophils as a new prognostic factor in cancer: a systematic review and meta-analysis. PLoS One. 2014;9(6):e98259.
- Shaul ME, Fridlender ZG. Neutrophils as active regulators of the immune system in the tumor microenvironment. J Leukoc Biol. 2017;102(2):343–9.
- Carnevale S, Ghasemi S, Rigatelli A, Jaillon S. The complexity of neutrophils in health and disease: focus on cancer. Semin Immunol. 2020;48:101409.
- Coffelt SB, Wellenstein MD, de Visser KE. Neutrophils in cancer: neutral no more. Nat Rev Cancer. 2016;16(7):431–46.
- Uribe-Querol E, Rosales C. Neutrophils in cancer: two sides of the same coin. J Immunol Res. 2015;2015:983698.
- Wang L, et al. Resistance mechanisms and prospects of trastuzumab. Front Oncol. 2024;14:1389390.
- Barok M, Tanner M, Köninki K, Isola J. Trastuzumab-DM1 causes tumour growth inhibition by mitotic catastrophe in trastuzumab-resistant breast cancer cells in vivo. Breast Cancer Res. 2011;13(2):R46.
- Liu J, et al. Elucidating molecular mechanisms and therapeutic synergy: irreversible HER2-TKI plus T-DXd for enhanced anti-HER2 treatment of gastric cancer. Gastric Cancer. 2024;27(3):495–505.
- Ruscetti M, et al. HDAC inhibition impedes epithelial–mesenchymal plasticity and suppresses metastatic, castration-resistant prostate cancer. Oncogene. 2016;35(29):3781–95.
- Saw PE, Chen J, Song E. ChemoNETosis: a road to tumor therapeutic resistance. Cancer Cell. 2023;41(4):655–7.