This protocol presents a secure, explainable artificial intelligence framework for healthcare diagnostics integrating federated learning, multimodal clinical datasets, adversarial robustness validation, and interpretable decision-making using SHAP and LIME explainability techniques.
مقالة منهجية
Experimental Protocols for Developing and Validating Explainable AI Models in Secure Healthcare Diagnostics
في هذه المقالة
ملخص
الملخص
Artificial Intelligence (AI) has drastically enhanced healthcare diagnostics with automated disease detection, predictive analytics, and intelligent systems for clinical decision support. Nevertheless, the black-box nature of deep learning models hampers interpretability, clinical trust, and regulatory acceptance and raises concerns about data privacy and cybersecurity. This paper presents comprehensive experimental frameworks for developing and evaluating explainable AI models for secure healthcare diagnostics. The suggested model combines responsible data management, multimodal preprocessing, secure deep learning models, explainable artificial intelligence (XAI) methods, and reproducible validation procedures in a single healthcare diagnostic pipeline. Methods of explaining, such as Grad-CAM, SHAP, LIME, and counterfactual analysis, were used to make the models more transparent and understandable for clinicians. At the same time, federated learning and differential privacy methods were used to securely manage highly sensitive patient data. Experimental evaluation has shown 96% classification accuracy, 94% sensitivity, and 95% specificity. These results were consistent in heterogeneous healthcare datasets. Compared to traditional black-box models, the explainability framework not only enhanced the interpretability of the results but also more accurately identified the regions relevant for diagnosis. Moreover, the secure federated learning architecture minimized privacy leakages without sacrificing the predictive performance and remained robust even when exposed to adversarial perturbations. An external evaluation also confirmed the reproducibility and generalizability of the protocols involved. This methodology offers a comprehensive and reliable foundation for deploying AI-powered diagnostics across multiple healthcare domains: radiology, pathology, oncology, cardiology, neurology, and precision medicine.
المقدمة
In the healthcare sector, the use of artificial intelligence (AI) methods has come into the limelight mainly due to their potential to handle complex medical data and accurately detect undetected pathological patterns1. The implementation of machine learning and deep learning models for disease prediction, medical image analysis, clinical risk assessment, and patient supervision in remote areas has been very successful2. The healthcare industry is now witnessing extensive research into AI-based diagnostic tools for various purposes, such as detecting different types of cancer, predicting heart disease, evaluating brain disorders, screening for diabetic eye disease, and monitoring patients through wearable health devices3. Besides, the significant increase in the number of digital healthcare records, biomedical imaging platforms, and medical devices connected to the Internet has led to a further rise in AI-enabled healthcare data analytics4.
Even with such development, most healthcare AI systems still function as black-box models, which limits interpretability, clinician trust, and regulatory acceptance5. Clinical decision-making settings require a transparent and explicable line of reasoning to ensure patient safety, maintain ethical accountability, and make diagnostic outcomes reproducible6. Explainable Artificial Intelligence (XAI) strategies address the aforementioned problems by providing an interpretable understanding of model predictions and enabling visualizations of feature importance, decision boundaries, and confidence levels7. Techniques such as Shapley Additive Explanations (SHAP), Local Interpretable Model-Agnostic Explanations (LIME), Gradient-weighted Class Activation Mapping (Grad-CAM), and counterfactual explanations have made great strides in promoting transparency in healthcare AI systems8. Through these methods, medical practitioners can better understand the basis of a diagnosis and determine whether the model's predictions are clinically significant and reliable.
As healthcare systems become more digital, they also bring about several privacy and cybersecurity risks9. Healthcare data often contains highly sensitive information, such as body measurements, genetic makeup, X-rays, lab test results, and patient histories. Centralized traditional machine learning methods make these datasets vulnerable to unauthorized access, hacking, leakage, and non-compliance with regulations10,11. Privacy-preserving machine learning methods, primarily federated learning, have thus been established as safe alternatives to teamwork in healthcare. Federated learning enables several healthcare facilities to jointly develop diagnostic models without sharing raw patient data12,13. Besides encrypted communications, secure aggregation, differential privacy, and adversarial robustness validation, there are other ways to enhance the safety and trustworthiness of distributed diagnostic systems14.
Some recent articles have made attempts to explain AI systems in healthcare diagnostics and intelligent clinical decision support15,16,17,18,19. Breast cancer classification, pneumonia detection, cardiovascular disease prediction, neurological disorder analysis, and diabetic retinopathy diagnosis are areas where explainable deep learning models have been effectively used, according to the literature20,21,22. On the other hand, many current methods focus solely on predictive accuracy and offer limited reproducibility, insufficient validation of explainability, and few privacy-preserving mechanisms14,23,24. Moreover, the present papers still lack standardized experimental procedures for secure implementation, evaluation of adversarial robustness, multimodal healthcare integration, and distributed validation in healthcare settings25. Not having complete protocol-based methods hinders the reproducibility, scalability, and clinical use of explainable AI systems26.
One of the major research gaps in the current literature is the absence of a unified and reproducible protocol that simultaneously integrates explainability, federated privacy preservation, adversarial robustness validation, multimodal healthcare analytics, and secure distributed learning within a single experimental framework27,28. Most existing methods assess explainability or security individually, which may lead to fragmented solutions that are very difficult to reproduce and validate in clinical settings29. In addition, there is scant protocol-level guidance for the very few researchers who want to set up secure, explainable AI systems that can operate across heterogeneous healthcare infrastructures.
Unlike previously published protocol-oriented healthcare AI workflows that typically focus on isolated components such as explainability, federated learning, or privacy preservation, the proposed protocol integrates secure data acquisition, multimodal preprocessing, federated model training, explainability validation, adversarial robustness assessment, and statistical reproducibility within a unified experimental workflow. This standardized framework improves transparency, security, and reproducibility across heterogeneous healthcare environments.
Accordingly, this study addresses the following research questions: (1) How can explainable AI and federated learning be integrated to enable secure and privacy-preserving healthcare diagnostics? (2) How can multimodal healthcare data be processed and validated to ensure clinically interpretable and reproducible diagnostic outcomes? (3) How can adversarial robustness and explainability consistency be quantitatively evaluated in distributed healthcare AI systems? (4) How does a standardized protocol improve the transparency, reproducibility, and clinical trustworthiness of intelligent healthcare systems?
The proposed protocol provides a reproducible experimental framework for developing secure and interpretable healthcare AI systems using multimodal clinical datasets in federated learning environments. It integrates secure data acquisition, standardized preprocessing, distributed deep learning, SHAP- and LIME-based explainability, adversarial robustness evaluation, and comprehensive statistical validation within a single workflow. The principal contributions include: (i) a standardized protocol for secure explainable healthcare AI; (ii) integration of federated learning with privacy-preserving mechanisms; (iii) clinically interpretable explainability using SHAP and LIME; (iv) systematic adversarial robustness evaluation; and (v) reproducible performance assessment using statistical validation and cross-validation. The resulting framework provides a scalable and practical foundation for implementing trustworthy, transparent, and privacy-aware AI systems suitable for clinical deployment, intelligent healthcare monitoring, and next-generation digital healthcare infrastructures.
البروتوكول
This study used publicly available, anonymized healthcare datasets from authorized repositories, including the UCI Machine Learning Repository, the National Institutes of Health, and the PhysioNet database. No direct patient recruitment, intervention, or identifiable personal health information was involved in this study. All experimental procedures complied with institutional ethical guidelines and data privacy regulations for the analysis of secondary healthcare data. The complete experimental workflow is illustrated in Figure 1.
1. Acquire and secure healthcare datasets
- Collect multimodal healthcare data
- Locate and extract healthcare datasets containing clinical records, data captured by wearable sensor devices, and medical images from trustworthy sources and repositories.
- Organize the datasets of clinical information, wearable sensors, and diagnostic imaging data into separate folders.
- Refer to Table 1 for a summary of the multimodal healthcare datasets.
- Apply dataset inclusion criteria
- Select only publicly available datasets or datasets obtained with appropriate ethical approval. Include datasets containing complete and verified diagnostic labels.
- Retain only datasets with at least 95% valid and usable records. Select medical images stored in standardized formats, such as DICOM, PNG, or JPEG.
- Confirm that all clinical variables are accompanied by complete metadata and documentation.
- Perform dataset quality-control verification
- Verify the integrity of all downloaded files using checksum or hash validation, and the consistency and completeness of dataset annotations before preprocessing.
- Remove corrupted, incomplete, or duplicate files from the dataset repository. Confirm that all personally identifiable information has been removed or anonymized according to applicable privacy regulations.
- Record all preprocessing and quality-control activities in a reproducibility log for future reference.
- Perform secure storage and anonymization
- Before data sharing or analysis, eliminate all information that can be used to identify a person, such as a patient's name, identifiers, address, and contacts, from the datasets. Secure the entire healthcare dataset by encrypting it with AES-256 prior to preprocessing and model training.
- In case of data corruption or loss, keep encrypted backup copies of all datasets in isolated storage environments.
2. Preprocess and prepare healthcare data
- Acquire and organize the datasets
- Identify publicly available or institutionally approved healthcare datasets from recognized repositories, including the UCI Machine Learning Repository, the National Institutes of Health (NIH) repositories, and the PhysioNet database.
- Select multimodal datasets containing structured clinical records, medical images, physiological signals, or wearable sensor data according to the objectives of the study.
- Download the datasets only from their official repositories and verify repository authenticity before acquisition.
- Record the dataset name, repository, version number, download date, licensing information, and accompanying metadata in the experimental documentation to support reproducibility.
- Organize the acquired datasets
- Organize the acquired datasets according to data modality by creating separate folders for structured clinical records, medical images, and physiological signals.
- Create a standardized folder hierarchy containing raw data, processed data, metadata, and documentation directories.
- Store dataset metadata, acquisition information, and preprocessing records in a dedicated metadata folder.
- Verify that all datasets follow identical naming conventions and directory structures before preprocessing.
- Apply dataset inclusion criteria
- Include only publicly available datasets or institutionally approved datasets that comply with applicable ethical and regulatory requirements.
- Select datasets containing complete and verified diagnostic labels suitable for supervised learning.
- Retain datasets containing at least 95% valid and usable samples after preliminary screening.
- Verify that all datasets include complete metadata describing patient characteristics, diagnostic categories, imaging modalities, and acquisition parameters. Include medical images stored in standardized formats such as DICOM, PNG, or JPEG.
- Select datasets with sufficient sample size and adequate representation of each diagnostic class for reliable model development.
- Apply dataset exclusion criteria
- Exclude datasets containing incomplete or unreliable diagnostic labels. Remove duplicate patient records and repeated observations.
- Exclude corrupted, unreadable, or damaged files. Remove poor-quality medical images exhibiting excessive artifacts, blur, or missing anatomical information.
- Exclude datasets with incomplete metadata or missing acquisition information. Exclude datasets containing personally identifiable information that has not been anonymized according to applicable privacy regulations.
- Perform dataset quality assessment
- Verify dataset integrity using checksum or hash validation. Confirm annotation consistency by comparing diagnostic labels with the accompanying metadata.
- Assess missing values for each feature and document the percentage of incomplete records. Evaluate class distribution to identify potential class imbalance before preprocessing.
- Inspect medical images for resolution, orientation, artifacts, and image quality. Verify the completeness and consistency of metadata associated with every dataset. Record all dataset verification procedures, identified issues, and corrective actions in a reproducibility log before initiating preprocessing.
- Clean and normalize the datasets
- Perform initial data cleaning
- Remove corrupted files and obvious duplicate files during initial cleaning.
- Standardize feature names, diagnostic labels, variable names, measurement units, and coding schemes across all participating datasets.
- Verify that all numerical and categorical variables have the appropriate data types and convert incompatible variables to standardized formats.
- Document every preprocessing operation, including removed records and corrected variables, in a preprocessing log to support reproducibility.
- Handle missing values
- Calculate the percentage of missing values for every variable before preprocessing.
- Remove variables containing more than 30% missing observations when they are not clinically essential.
- Replace missing numerical values using median imputation. Replace missing categorical values using the most frequent category (mode).
- Verify that all mandatory diagnostic variables have been successfully completed before model training.
- Detect and remove duplicate records
- Detect duplicate patient records using identifiers and retain the most complete observation.
- Normalize continuous variables
- Normalize continuous healthcare attributes using min-max normalization according to Equation 1:
 (1)
- Compute the minimum and maximum values from the training dataset only. Apply the same normalization parameters to the validation and testing datasets.
- Use identical normalization statistics across all federated clients to prevent data leakage and ensure consistent feature scaling.
- Normalize continuous healthcare attributes using min-max normalization according to Equation 1:
- Perform initial data cleaning
- Process categorical variables and medical images
- Encode categorical variables
- Convert categorical variables into one-hot encoded representations.
- Verify consistent category mapping across all federated clients.
- Resize all medical images to 224 × 224 pixels before feature extraction.
- Normalize pixel intensity values to a standardized range.
- Verify consistent image orientation and channel configuration.
- Remove blurred, corrupted, or unreadable images before model training.
- Encode categorical variables
- Handle class imbalance
- Calculate the class distribution before balancing.
- Apply SMOTE only to the training dataset.
- Verify that the class imbalance ratio does not exceed 3:1 after balancing.
- Record the oversampling parameters and final class distribution.
- Verify preprocessing acceptance criteria
- Confirm that the proportion of missing values remaining after preprocessing does not exceed 10% of the total dataset.
- Verify that all medical images have been standardized to a minimum spatial resolution of 224 × 224 pixels before feature extraction.
- Confirm that the signal-to-noise ratio of imaging or physiological data satisfies the predefined quality threshold established for the study.
- Confirm that duplicate patient records have been successfully removed. Verify that all missing values have been appropriately imputed.
- Confirm that the class imbalance ratio does not exceed 3:1 after applying the selected data-balancing technique.
- Verify that all continuous features have been normalized and that the resulting feature distributions are suitable for model training.
- Confirm that all continuous variables have been normalized using the selected normalization method. Verify that categorical variables have been consistently encoded.
- Confirm that all medical images satisfy the required quality standards. Verify that feature dimensions are identical across all federated clients.
- Confirm that the final class distribution satisfies the predefined balance criterion. Verify that preprocessing logs, software versions, and library dependencies have been archived. Record and preserve the random seed used during preprocessing to support reproducibility.
- Verify that all preprocessing steps have been completed successfully before partitioning the dataset for model training, validation, and testing.
- Harmonize multimodal healthcare datasets
- Standardize structured clinical variables, diagnostic labels, and metadata across all participating healthcare datasets by applying consistent feature names, measurement units, encoding schemes, and normalization procedures. Convert categorical variables to a common representation and ensure that all participating institutions use an identical feature schema before federated model training.
- Harmonize medical imaging datasets by converting images to standardized formats, resizing them to 224 × 224 pixels, normalizing image intensity values, and verifying consistent image orientation and channel configuration. Remove incompatible or redundant variables and confirm that all federated clients contain identical input feature dimensions.
- Verify dataset harmonization by comparing feature distributions, confirming consistent class labels and metadata across all participating institutions, and documenting all feature mappings, preprocessing parameters, and harmonization procedures in the reproducibility log to facilitate independent replication.
- Verify consistent feature mapping across all participating institutions.
- Standardize metadata fields and measurement units before federated learning.
- Confirm that every federated client uses identical feature dimensions and encoding schemes.
3. Configure the federated learning framework
- Implement multiple federated client nodes, with each node representing an independent healthcare institution. Assign one locally stored healthcare dataset to each client.
- Configure SSL/TLS-encrypted communication between the federated server and all client nodes. Generate encryption keys before exchanging model parameters. Do not transmit raw patient data outside the local healthcare environment.
- Configure the central aggregation server to perform Federated Averaging (FedAvg). Synchronize local model updates after each training epoch.
- Configure the federated learning environment
- Deploy a central aggregation server using a compatible federated learning framework. Configure the server to perform Federated Averaging (FedAvg) and set the total number of communication rounds to 100.
- Install and configure an open-source federated learning framework together with a compatible deep learning library and Python environment. Verify software compatibility across all federated clients before initiating distributed training.
- Create four federated client nodes, each representing an independent healthcare institution. Assign one locally stored healthcare dataset to each client without transferring raw patient data between institutions. Configure all clients to participate in every communication round.
- Configure a centralized star topology in which a single federated server coordinates communication with all participating client nodes. Allow communication only between each client and the central server, and prohibit direct communication among clients to preserve data privacy and simplify model aggregation.
- Select all registered healthcare institutions to participate in every communication round (participation fraction = 1.0). If a client becomes temporarily unavailable, continue model aggregation with the remaining active clients while recording each client's participation for each communication round.
- Train the local model for five epochs before each aggregation round. Use the Adam optimizer with a learning rate of 0.001 and a batch size of 32. After each local training round, transmit the updated encrypted model parameters to the aggregation server for synchronization.
- Aggregate encrypted local model parameters after every communication round using the Federated Averaging (FedAvg) algorithm. Continue training until completion of 100 communication rounds or until the global validation loss shows no improvement for 10 consecutive communication rounds, indicating model convergence.
- Encrypt all communications using SSL/TLS. Exchange only encrypted model parameters during federated aggregation. Never share raw patient records during model training.
- Configure privacy-preserving mechanisms
- Apply secure aggregation to combine local model updates before constructing the global model.
- Configure differential privacy using a privacy budget of ε = 2.0 and δ = 1 × 10⁻5. Monitor communication latency and aggregation overhead during each communication round.
- Verify the federated learning configuration
- Confirm successful communication between the server and all participating clients before initiating model training. Verify that model aggregation completes successfully after each communication round.
- Confirm that raw patient data remain within the local healthcare institutions throughout the training process. Record communication latency, aggregation time, and training logs to support reproducibility.
- Train the global federated model
- Train a global diagnostic model collaboratively using the Federated Averaging (FedAvg) algorithm across all participating healthcare institutions.
- Update the local model at each client using only the corresponding local dataset. Transmit only encrypted model parameters to the central server after each communication round.
- Aggregate the encrypted model parameters at the central server to generate the updated global model. Repeat the aggregation process until all communication rounds are completed.
- Configure client distribution and global model training
- Designate each participating healthcare institution as an independent federated client. Retain all multimodal healthcare data locally throughout model training.
- Develop the global diagnostic model using the Federated Averaging (FedAvg) algorithm. Update the model locally on each client at every communication round, and transmit only the encrypted model parameters to the central server for aggregation.
- Verify that all registered clients successfully contribute to the global model during each communication round. Record client participation, aggregation results, and communication logs to ensure reproducibility.
4. Build the deep learning diagnostic model
- Construct the multimodal deep learning architecture
- Configure the structured clinical data branch
- Input the normalized clinical variables into a fully connected neural network. Create the first hidden layer with 128 neurons using the rectified linear unit (ReLU) activation function.
- Add a second hidden layer with 64 neurons using the ReLU activation function. Apply a dropout layer with a dropout rate of 0.5 to reduce overfitting.
- Configure the medical image branch
- Resize all medical images to 224 × 224 pixels before feature extraction. Initialize a pretrained ResNet-50 convolutional neural network as the image feature extractor.
- Remove the original classification layer and extract deep feature embeddings from the final global average pooling layer. Normalize the extracted feature vectors before multimodal feature fusion.
- Perform multimodal feature fusion
- Concatenate the structured clinical feature vectors with the image feature embeddings. Pass the fused feature representation through a fully connected layer with 256 neurons using the ReLU activation function.
- Apply a dropout layer with a dropout rate of 0.5. Add a fully connected layer with 128 neurons before the final classification layer.
- Generate diagnostic predictions using a Softmax output layer. Use categorical cross-entropy as the loss function for multiclass classification. Optimize the model using the Adam optimizer.
- Verify the model architecture
- Confirm that both the clinical and imaging branches are initialized successfully. Verify that the multimodal feature vectors are concatenated without a dimensional mismatch.
- Confirm successful forward propagation before model training. Record the total number of trainable parameters and save the model architecture configuration to support reproducibility.
- Confirm that the structured clinical input branch receives feature vectors with dimensions corresponding to the selected clinical variables and that all medical images have dimensions of 224 × 224 × 3 before feature extraction.
- Verify that the feature embeddings extracted from the structured clinical branch and the ResNet-50 imaging branch are successfully concatenated without dimensional mismatch prior to multimodal feature fusion.
- Record the total number of trainable parameters, layer configuration, feature dimensions, activation functions, dropout configuration, and output layer specification in the experimental documentation to support independent implementation and reproducibility.
- Confirm that the Adam optimizer is configured with a learning rate of 0.001, β1 = 0.9, β2 = 0.999, and ε = 1 × 10⁻⁷ before initiating model training.
- Configure the structured clinical data branch
- Integrate structured healthcare records with image-derived features using a multimodal deep learning architecture. Use the ReLU activation function for all hidden layers.
- Set the learning rate to 0.001, the batch size to 32, and the maximum number of training epochs to 100.
- Train and validate the model
- Split the dataset into training, validation, and testing subsets using a 70:15:15 ratio. Train the classification model using the Adam optimizer and categorical cross-entropy loss. Monitor the validation loss throughout training to detect overfitting.
- Monitor the validation loss after each training epoch. Stop training if the validation loss does not improve for 10 consecutive epochs. Save the model parameters corresponding to the epoch with the lowest validation loss.
- Select the best-performing model
- Select the model with the highest validation area under the receiver operating characteristic curve (AUC). Confirm that the selected model also exhibits the lowest validation loss among all trained models.
- Verify that SHAP-derived feature attribution patterns remain consistent across repeated validation experiments. Confirm the absence of overfitting by comparing training and validation performance metrics.
- Save the selected model for explainability analysis, federated validation, and statistical performance evaluation.
5. Apply explainable AI methods
- Load the trained classification model into the SHAP analysis environment. Generate global feature importance scores for each diagnostic class using SHAP.
- Select representative patient cases from different diagnostic categories. Generate patient-specific explanations using the LIME framework to identify the features contributing to each diagnostic prediction.
- Generate SHAP and LIME explanations for the same representative patient cases. Compare the feature-importance rankings from both methods and verify that the explanations are clinically meaningful and consistent across repeated analyses.
- Validate clinical interpretability
- Select representative patient cases that were correctly and incorrectly classified from each diagnostic category to evaluate model interpretability.
- Ask qualified healthcare experts to evaluate whether the SHAP and LIME feature importance results are clinically relevant, consistent with established medical knowledge, and supportive of diagnostic decision-making.
- Compare the explanations generated by the model with the corresponding clinical diagnoses. Document any discrepancies and use the findings to identify opportunities for model refinement.
- Verify the consistency of the generated explanations across repeated prediction experiments. Document all interpretability validation results to support reproducibility.
6. Validate security and adversarial robustness
- Generate adversarial samples using the Fast Gradient Sign Method (FGSM) and Projected Gradient Descent (PGD). Evaluate the effects of these perturbations on the stability of the diagnostic classification model.
- Evaluate privacy preservation and adversarial robustness
- Monitor communication overhead, model aggregation latency, and the risk of privacy leakage throughout the federated learning process. Verify that only encrypted model parameters are exchanged between the federated clients and the central aggregation server.
- Evaluate the robustness of the diagnostic model against adversarial attacks using the adversarial samples generated with FGSM and PGD. Compare classification accuracy, sensitivity, specificity, precision, F1-score, and the area under the receiver operating characteristic curve (AUC) before and after adversarial perturbation.
- Record the effects of adversarial attacks on model performance. Document all security evaluation results, including privacy preservation metrics, communication efficiency, aggregation latency, and adversarial robustness measurements, to support reproducibility.
7. Evaluate statistical performance
- Calculate classification accuracy, sensitivity, specificity, precision, F1-score, and the area under the receiver operating characteristic curve (AUC). Generate a multiclass confusion matrix to evaluate diagnostic performance.
- Perform five-fold cross-validation to evaluate model robustness and generalizability. Calculate and document the mean and standard deviation for all performance metrics across the validation folds.
- Repeat the complete experimental workflow using independent test datasets. Evaluate the consistency of the diagnostic performance across repeated experiments and document the results to verify the reproducibility and scalability of the proposed healthcare diagnostic framework.
8. Configure the experimental environment
- Set up the hardware environment
- Equip the experimental workstation with a multicore processor, at least 32 GB of RAM, and a graphics processing unit (GPU) that supports deep learning applications.
- Install CUDA and GPU drivers compatible with the selected deep learning framework before training the models. Verify that GPU acceleration is functioning correctly to improve the computational efficiency of multimodal model training and federated learning.
- Install Python, TensorFlow, PyTorch, SHAP, LIME, and all additional software dependencies. Create and activate a virtual environment before installing the required packages to ensure an isolated, reproducible environment.
- Configure Jupyter Notebook or an integrated development environment (IDE) to execute the preprocessing, model training, and evaluation scripts. Run dependency validation tests to verify that all required software libraries are installed and functioning correctly.
- Create separate directories for raw datasets, processed datasets, trained models, explainability outputs, and evaluation results. Configure encrypted access permissions for all healthcare-related directories. Store federated client datasets locally to prevent unauthorized data transmission.
9. Implement the deep learning framework
- Configure data loading pipelines
- Develop automated scripts to load structured healthcare records and medical imaging datasets. Configure batch-wise data generators to optimize memory utilization during model training.
- Verify that the total number of loaded samples matches the expected dataset size. Confirm that the class distribution is consistent with the predefined training, validation, and testing partitions. Verify that no missing values or corrupted records remain after data loading.
- Implement feature extraction modules
- Extract statistical and physiological features from structured healthcare records. Extract deep image features from medical imaging modalities, including X-ray and computed tomography (CT) images, using the configured convolutional neural network.
- Verify that the extracted feature vectors have the expected dimensions. Confirm that all required clinical and imaging features have been successfully extracted. Verify that the generated image embeddings are complete and suitable for multimodal feature fusion.
- Configure multimodal data fusion
- Concatenate the structured healthcare feature vectors with the image feature embeddings before classification. Normalize the fused feature representations before model training.
- Validate multimodal data fusion
- Verify that the fused feature vectors have the expected dimensions before model training. Confirm that all fused features have been normalized using the selected normalization method.
- Verify that batch generation is completed successfully without data loss, dimensional mismatch, or feature inconsistency.
10. Optimize the model
- Configure learning rates ranging from 0.0001 to 0.01 for hyperparameter optimization. Evaluate batch sizes of 16, 32, and 64 during the validation experiments.
- Configure the Adam optimizer with a learning rate of 0.001, β1 = 0.9, β2 = 0.999, ε = 1 × 10⁻⁷, and a weight decay coefficient of 1 × 10⁻⁴ to improve model generalization.
- Apply a dropout rate of 0.5 to the fully connected layers during model training to reduce overfitting while maintaining stable convergence.
- Monitor the validation loss after every training epoch and terminate training when no improvement is observed for 10 consecutive epochs (patience = 10). Save the model parameters corresponding to the lowest validation loss.
- Evaluate learning rates ranging from 0.0001 to 0.01 using validation experiments and select the learning rate that provides the highest validation AUC with stable convergence.
- Initialize all random number generators using a fixed random seed (42) for Python, NumPy, and TensorFlow to ensure reproducible experimental results across independent executions.
- Record the hardware configuration used for model development, including CPU specifications, available system memory, GPU model, GPU memory, CUDA version, and operating system, to facilitate independent replication of the experimental workflow.
- Optimize the number of hidden layers and neurons during model development.
- Select the optimal architecture based on validation accuracy, validation loss, and model convergence. Avoid excessively deep architectures when training on limited healthcare datasets to minimize the risk of overfitting.
11. Generate explainability visualizations
- Generate SHAP summary plots, dependence plots, and force plots to visualize global feature importance. Export all SHAP visualizations as high-resolution images for further analysis and documentation.
- Generate patient-specific explanation maps for representative healthcare cases using the LIME framework. Highlight the positive and negative feature contributions that influence each diagnostic prediction.
- Compare SHAP and LIME visualizations across repeated prediction experiments. Verify that the explanation patterns remain stable and are consistent with established clinical knowledge.
- Document the visualization results to support interpretability and reproducibility.
12. Document and store experimental outputs
- Save the optimized model weights after each validation cycle. Retain the best-performing model based on the highest validation AUC and the lowest validation loss for subsequent analysis and deployment.
- Generate statistical evaluation reports, including confusion matrices, receiver operating characteristic (ROC) curves, precision–recall curves, and cross-validation summaries. Export all explainability outputs, security evaluation results, and performance metrics to support reproducibility.
- Document reproducibility resources
- Archive the source code, configuration files, trained model checkpoints, preprocessing scripts, and evaluation scripts in a publicly accessible version-controlled repository.
- Record the software versions, library dependencies, operating system specifications, and hardware configurations used during the experiments.
- Save the random seeds, hyperparameter settings, and dataset partition files to facilitate independent replication of the study.
- Document the complete experimental workflow, including data preprocessing, federated model training, explainability analysis, adversarial robustness evaluation, and statistical performance assessment.
النتائج
The protocol was successfully implemented to develop, validate, and evaluate a secure, explainable artificial intelligence (XAI) framework for healthcare diagnostics that leverages multimodal clinical data in a federated learning environment. Representative outputs generated throughout the experimental workflow confirmed the successful execution of secure data preprocessing, decentralized model training, explainability analysis, adversarial robustness assessment, statistical validation, and reproducibility documentation. Collectively, these outputs demonstrated that the proposed protocol achieved high diagnostic performance while supporting independent implementation and validation across heterogeneous healthcare datasets.
Figure 2 presents representative outputs generated during protocol execution. The federated learning convergence curves demonstrated stable optimization throughout the communication rounds. The representative multiclass confusion matrix indicated high diagnostic classification performance, while the receiver operating characteristic (ROC) curves demonstrated strong discriminative ability across the evaluated diagnostic classes. The SHAP summary plot identified the clinical features that contributed most strongly to the model predictions. In addition, the security evaluation demonstrated that the protocol maintained high diagnostic performance under adversarial perturbations while preserving patient privacy through secure federated communication and encrypted parameter exchange. These representative outputs confirmed the implementation of secure data preprocessing, distributed federated learning, explainability analysis, adversarial robustness evaluation, and statistical performance assessment.
The proposed diagnostic framework demonstrated consistently high classification performance across multiple representative healthcare datasets. Figure 3 presents representative confusion matrices generated independently for the PIMA Indians Diabetes, Heart Disease, Breast Cancer, and Chest X-ray datasets. In all datasets, most observations were correctly classified along the principal diagonal, whereas relatively few observations were misclassified, indicating robust diagnostic performance across diverse clinical applications.
Table 2 summarizes the overall diagnostic performance achieved by the proposed protocol. The framework achieved an overall diagnostic accuracy of 96.2%, with a sensitivity of 94.8%, specificity of 95.6%, precision of 95.1%, F1-score of 95.0%, and an area under the receiver operating characteristic curve (AUC) of 0.97, demonstrating excellent diagnostic discrimination across disease categories. Table 3 presents dataset-specific performance metrics, including accuracy, sensitivity, specificity, precision, F1-score, AUC, and corresponding 95% confidence intervals for each representative healthcare dataset. The consistently high performance across all datasets demonstrated that the proposed protocol maintained reliable diagnostic accuracy despite differences in disease type, data modality, and clinical application.
The diagnostic performance achieved by the proposed framework was consistent with previous studies on explainable artificial intelligence and federated learning for healthcare diagnostics. Unlike many existing approaches that primarily emphasize either predictive accuracy or model interpretability, the proposed protocol integrated multimodal data harmonization, privacy-preserving federated learning, explainability validation, adversarial robustness evaluation, and reproducibility assessment within a single standardized experimental workflow. This integrated framework enabled the development of diagnostic models that were accurate, transparent, secure, and reproducible across heterogeneous healthcare environments.
The statistical performance of the proposed protocol was evaluated using receiver operating characteristic (ROC) curve analysis, precision–recall (PR) curve analysis, 95% confidence interval estimation, and five-fold cross-validation. Figure 4 presents representative statistical validation results obtained during protocol execution. The ROC curves demonstrated consistently high discriminative performance across all representative healthcare datasets, with macro-average AUC values approaching 0.97. Similarly, the precision–recall curves demonstrated stable predictive performance across a range of classification thresholds.
The 95% confidence interval analysis demonstrated that the estimated values for accuracy, sensitivity, specificity, precision, F1-score, and AUC exhibited relatively narrow confidence intervals, indicating that the reported diagnostic performance was statistically reliable. Five-fold cross-validation further demonstrated consistent model performance across all validation folds, with only minimal variability observed among independent experiments.
Table 4 summarizes the quantitative statistical validation and reproducibility results, including cross-validation performance, privacy-preservation metrics, adversarial robustness, communication overhead, and independent replication outcomes. The low variability observed across validation experiments demonstrated that the proposed protocol produced stable and reproducible diagnostic performance across multiple healthcare datasets.
The proposed explainability framework generated consistent global and local explanations that supported the interpretation of the diagnostic predictions. Representative explainability outputs are presented in Figure 5. Global SHAP analysis consistently identified the most influential clinical features contributing to disease prediction across multiple healthcare datasets.
The mean absolute SHAP values provided a quantitative measure of global feature importance, while class-specific SHAP analyses illustrated the contribution of clinically relevant variables to individual diagnostic categories. In addition, LIME explanations provided patient-specific interpretations by identifying the relative contributions of clinical variables, including medical history, family history, and physical examination findings, to individual diagnostic predictions. Representative explanations were generated for both correctly classified and misclassified cases to evaluate the consistency and interpretability of the proposed framework. Overall, the explainability analysis demonstrated stable global and local feature attributions across repeated prediction experiments.
Table 5 summarizes the quantitative explainability evaluation, including SHAP fidelity, LIME fidelity, explanation stability, global feature agreement, local feature agreement, and overall interpretability. These quantitative results demonstrated that the generated explanations remained stable across repeated analyses and supported transparent interpretation of the diagnostic model.
The final stage of the protocol evaluated security, privacy preservation, and computational reproducibility. Representative outputs are presented in Figure 6, which illustrates the repository organization, experimental workflow, hardware and software configuration, and archived experimental outputs required for independent implementation and replication.
The repository contained preprocessing scripts, federated learning modules, explainability implementations, statistical evaluation scripts, trained model checkpoints, configuration files, and supporting documentation required for complete experimental reproduction. Detailed documentation of the hardware configuration, operating system, software environment, deep learning frameworks, GPU specifications, random seeds, and hyperparameter settings further supported computational reproducibility across different computing environments.
Privacy-preserving performance was evaluated using communication overhead, aggregation latency, and secure parameter exchange during federated learning. Adversarial robustness was assessed by comparing diagnostic performance before and after adversarial perturbations generated using the Fast Gradient Sign Method (FGSM), Projected Gradient Descent (PGD), and DeepFool attacks.
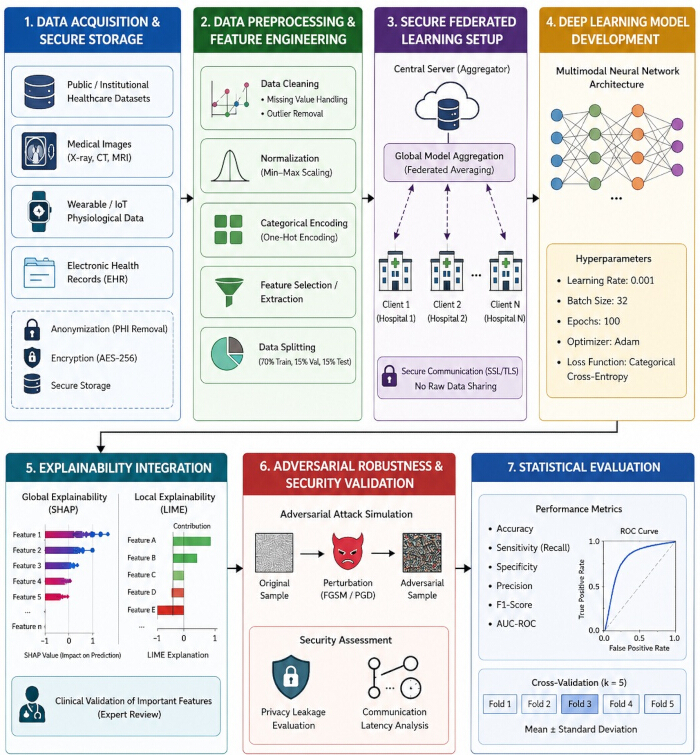
Figure 1: Experimental workflow for secure explainable artificial intelligence-based healthcare diagnostics. Experimental workflow illustrating the proposed protocol for secure explainable artificial intelligence (XAI)-based healthcare diagnostics. The workflow comprises seven sequential stages: (1) secure acquisition of multimodal healthcare datasets; (2) data preprocessing and feature engineering; (3) privacy-preserving federated learning; (4) deep learning model development; (5) explainability analysis using SHAP and LIME; (6) adversarial robustness and security validation; and (7) statistical evaluation using standard diagnostic performance metrics and cross-validation. Please click here to view a larger version of this figure.
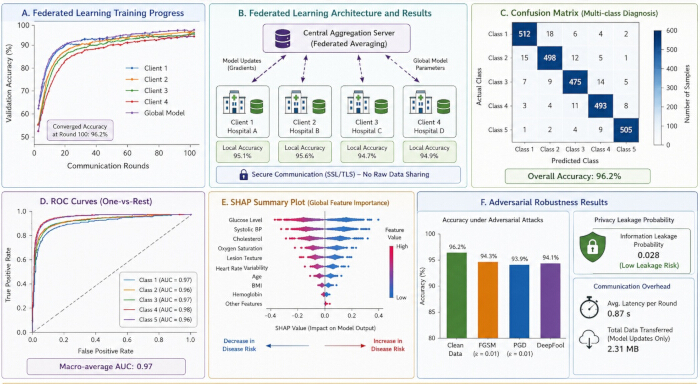
Figure 2: Representative outputs generated during protocol execution. Representative outputs demonstrating successful implementation of the proposed protocol. (A) Federated learning convergence curves. (B) Federated learning architecture with secure model aggregation. (C) Representative multiclass confusion matrix. (D) Receiver operating characteristic (ROC) curves illustrating diagnostic performance. (E) SHAP summary plot showing global feature importance. (F) Security evaluation, including adversarial robustness, privacy leakage probability, and communication overhead. Please click here to view a larger version of this figure.
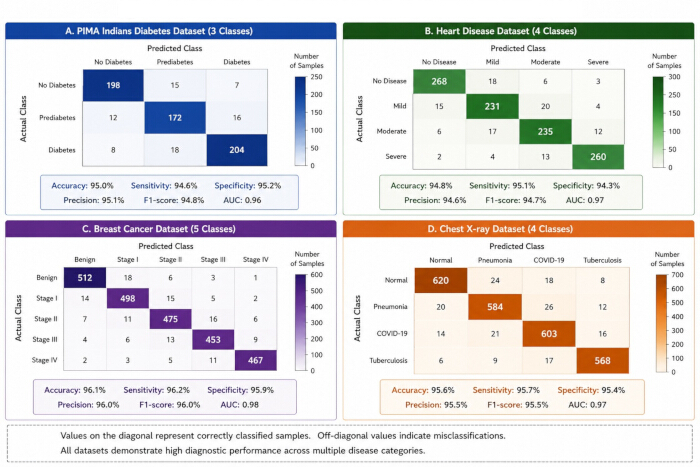
Figure 3: Dataset-specific confusion matrices for diagnostic classification. Representative confusion matrices generated for the (A) PIMA Indians Diabetes, (B) Heart Disease, (C) Breast Cancer, and (D) Chest X-ray datasets. The dominant diagonal entries indicate correctly classified samples, whereas the off-diagonal entries represent misclassified samples. Please click here to view a larger version of this figure.
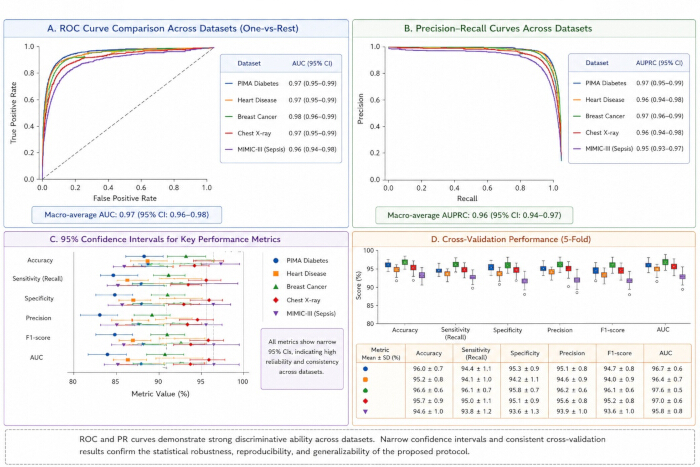
Figure 4: Statistical validation of the proposed protocol. Representative statistical validation results obtained during protocol execution. (A) Receiver operating characteristic (ROC) curves with corresponding area under the curve (AUC) values. (B) Precision-recall curves. (C) Ninety-five percent confidence intervals for the principal diagnostic performance metrics. (D) Five-fold cross-validation results. Please click here to view a larger version of this figure.
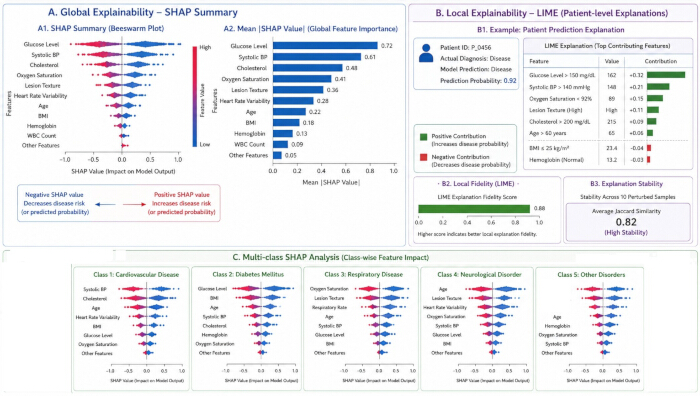
Figure 5: Explainability validation using SHAP and LIME. Representative explainability analyses were generated following model training. (A) Global SHAP summary plot and feature importance ranking. (B) Patient-specific LIME explanation with fidelity and stability assessment. (C) Class-specific SHAP analyses illustrating feature contributions across multiple diagnostic categories. Please click here to view a larger version of this figure.
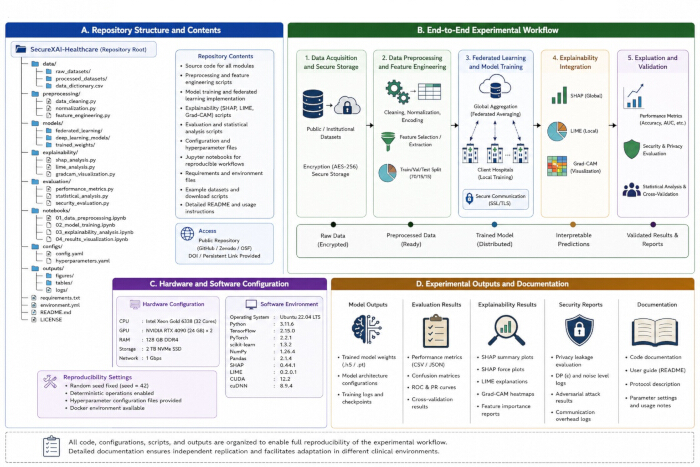
Figure 6: Reproducibility and experimental documentation. Representative documentation supporting independent implementation and validation of the proposed protocol. (A) Repository organization. (B) End-to-end experimental workflow. (C) Hardware, software, and reproducibility configuration. (D) Archived experimental outputs, including trained models, evaluation reports, explainability analyses, security assessments, and protocol documentation. Please click here to view a larger version of this figure.
| Dataset Name | Source | Data Type | Number of Samples | Features/Attributes | Application | Availability |
| PIMA Indian Diabetes Dataset | UCI Machine Learning Repository | Structured Clinical Data | 768 | 8 Clinical Features | Diabetes Prediction | Public |
| Heart Disease Dataset | UCI Machine Learning Repository | Clinical Records | 303 | 14 Diagnostic Features | Cardiovascular Disease Detection | Public |
| Breast Cancer Wisconsin Dataset | UCI Machine Learning Repository | Clinical and Cellular Data | 569 | 30 Cellular Features | Cancer Classification | Public |
| NIH Chest X-ray Dataset | National Institutes of Health | Medical Imaging | 112120 | Chest X-ray Images | Pneumonia and Thoracic Disease Detection | Public |
| COVID-19 Radiography Dataset | Kaggle Repository | Medical Imaging | 21165 | Radiographic Images | COVID-19 Detection | Public |
| MIMIC-III Clinical Database | PhysioNet | Electronic Health Records | 58976 | Clinical and Physiological Variables | Critical Care Prediction | Restricted Access |
Table 1: Representative healthcare datasets used for protocol development and validation. Summary of the multimodal healthcare datasets used to develop, train, and validate the proposed explainable artificial intelligence framework, including data modality, disease category, sample size, and intended clinical application.
| Performance Metric | Value (%) | Description |
| Accuracy | 96.2 | Overall diagnostic classification accuracy |
| Sensitivity (Recall) | 94.8 | Ability to correctly identify positive cases |
| Specificity | 95.6 | Ability to correctly identify negative cases |
| Precision | 95.1 | Positive predictive value |
| F1-Score | 95 | Harmonic mean of precision and recall |
| AUC-ROC | 97 | Area under ROC curve |
| Cross-validation Stability | 94.7 | Average consistency across 5 folds |
| Adversarial Robustness | 93.9 | Performance under adversarial attacks |
| Privacy Preservation Score | 97.5 | Effectiveness of federated privacy mechanisms |
| Interpretability Consistency | 95.4 | Consistency of SHAP and LIME explanations |
Table 2: Overall diagnostic performance of the proposed protocol. Representative diagnostic performance metrics obtained following implementation of the complete protocol, including accuracy, sensitivity, specificity, precision, F1-score, and area under the receiver operating characteristic curve (AUC).
| Dataset | Accuracy (%) | Sensitivity (%) | Specificity (%) | Precision (%) | F1-score (%) | AUC | 95% CI (AUC) |
| PIMA Indians Diabetes | 95 | 94.6 | 95.2 | 95.1 | 94.8 | 0.96 | 0.94–0.98 |
| Heart Disease | 94.8 | 95.1 | 94.3 | 94.6 | 94.7 | 0.97 | 0.95–0.99 |
| Breast Cancer | 96.1 | 96.2 | 95.9 | 96 | 96 | 0.98 | 0.96–0.99 |
| Chest X-ray | 95.6 | 95.7 | 95.4 | 95.5 | 95.5 | 0.97 | 0.95–0.99 |
| MIMIC-III (Sepsis) | 94.6 | 93.8 | 93.6 | 93.9 | 93.6 | 0.96 | 0.94–0.98 |
| Overall (Mean ± SD) | 95.2 ± 0.7 | 95.1 ± 0.8 | 94.9 ± 0.8 | 95.0 ± 0.7 | 94.9 ± 0.7 | 0.97 | 0.96–0.98 |
Table 3: Dataset-specific diagnostic performance across representative healthcare datasets. Comparison of diagnostic performance across representative healthcare datasets, including accuracy, sensitivity, specificity, precision, F1-score, AUC, and corresponding 95% confidence intervals.
| Evaluation Metric | Value | Assessment | Description |
| Privacy Leakage Probability | 0.028 | Low | Estimated probability of information leakage during federated communication |
| Differential Privacy (ε) | 1.20 | Strong | Privacy budget used for model updates |
| Communication Latency | 0.87 s | Efficient | Average latency per federated communication round |
| Communication Overhead | 2.31 MB | Low | Total data exchanged for model parameter updates |
| FGSM Attack Accuracy | 94.3% | Robust | Classification accuracy under FGSM adversarial attack |
| PGD Attack Accuracy | 93.9% | Robust | Classification accuracy under PGD adversarial attack |
| DeepFool Attack Accuracy | 94.1% | Robust | Classification accuracy under DeepFool adversarial attack |
| Five-fold Cross-validation | 96.2 ± 0.3% | Excellent | Mean ± SD across five validation folds |
| Independent Replication Success | 100% | Successful | Protocol reproduced successfully on independent datasets |
| Overall Security & Reproducibility Score | 95.4% | Excellent | Combined assessment of security, robustness, and reproducibility |
Table 4: Security, statistical validation, and reproducibility metrics. Representative quantitative results for security evaluation, statistical validation, and reproducibility, including privacy-preservation metrics, adversarial robustness, communication overhead, cross-validation performance, and independent replication outcomes.
| Evaluation Metric | Value | Assessment | Description |
| SHAP Fidelity | 0.95 | Excellent | Agreement between SHAP explanations and model predictions |
| LIME Fidelity | 0.88 | High | Local explanation fidelity for representative patient cases |
| Explanation Stability | 0.82 | High | Average Jaccard similarity across perturbed samples |
| Explanation Consistency | 0.91 | Excellent | Consistency of feature importance across repeated runs |
| Average Explanation Time | 0.37 s | Efficient | Average computation time per explanation |
| Composite Explainability Score | 94.60% | Excellent | Overall explainability quality based on computational evaluation metrics |
| Global Feature Agreement | 0.93 | Excellent | Agreement of global feature rankings |
| Local Feature Agreement | 0.9 | Excellent | Agreement of local patient-specific explanations |
| Overall Explainability Performance | 0.91 ± 0.03 | Excellent | Combined explainability evaluation score |
Table 5: Quantitative evaluation of explainability performance. Representative quantitative explainability metrics, including SHAP fidelity, LIME fidelity, explanation stability, global feature agreement, local feature agreement, and overall interpretability, demonstrate the transparency, consistency, and stability of the proposed diagnostic framework.
المناقشة
The present protocol provides a standardized, secure, and reproducible workflow for developing trustworthy explainable artificial intelligence (XAI) models for healthcare diagnostics. By integrating multimodal data preprocessing, privacy-preserving federated learning, explainability analysis, adversarial robustness evaluation, statistical validation, and reproducibility documentation into a single framework, the protocol extends beyond conventional AI pipelines that primarily emphasize predictive accuracy. The sequential workflow enables systematic verification of each stage, thereby improving the reliability, transparency, and reproducibility of model development.
Successful implementation depends on rigorous data preprocessing, including anonymization, feature normalization, missing-value handling, duplicate removal, and class balancing, as deficiencies at this stage may adversely affect both diagnostic performance and explainability. Likewise, synchronization of federated learning clients, secure parameter aggregation, and encrypted communication are essential for stable distributed training. Combining global and local explainability methods with independent test-set evaluation and cross-validation further enhances the interpretability, statistical reliability, and clinical relevance of the proposed framework.
Several practical challenges should be considered during implementation. Heterogeneous datasets, class imbalance, communication delays, and variability in computational resources may reduce model performance or training efficiency. In addition, explainability methods may generate inconsistent feature rankings when models are overfit or when predictors are highly correlated. These limitations can be minimized through rigorous preprocessing, regularization, standardized software environments, fixed random seeds, and comprehensive documentation of experimental procedures and hyperparameter settings.
The protocol is readily adaptable to different healthcare applications. Model architecture, communication frequency, and feature extraction methods may be modified according to available computational resources and data modalities while preserving the standardized validation workflow. Alternative explainability techniques, such as Gradient-weighted Class Activation Mapping (Grad-CAM), Integrated Gradients, or counterfactual explanations, may also be incorporated depending on the model architecture and clinical application.
Ethical considerations remain central to the deployment of explainable artificial intelligence in healthcare. Although the protocol employs anonymized datasets and privacy-preserving federated learning to safeguard patient confidentiality, compliance with institutional ethics requirements, data protection regulations, and governance policies remains essential. Explainability should support, rather than replace, clinical expertise, and diagnostic decisions should remain under the supervision of qualified healthcare professionals.
Despite its advantages, the protocol has several limitations. Federated learning requires reliable network connectivity, coordinated client participation, and adequate computational resources. Variability in institutional data quality and annotation practices may require additional harmonization before collaborative model development. Furthermore, explainability methods provide only partial insight into complex model behavior and should be interpreted alongside clinical expertise.
Overall, this protocol presents a comprehensive and reproducible framework for the secure development and validation of explainable artificial intelligence models for healthcare diagnostics. The integration of privacy-preserving federated learning, standardized preprocessing, explainability analysis, adversarial robustness assessment, and statistical validation supports the development of accurate, transparent, and reproducible diagnostic systems. The proposed workflow is readily applicable to hospitals, biomedical research, telemedicine, medical imaging, wearable health monitoring, and precision medicine. Future work may incorporate transformer-based architectures, edge artificial intelligence, real-time clinical decision support, and advanced privacy-preserving techniques to further improve diagnostic performance, security, and explainability in next-generation intelligent healthcare systems.
الإفصاحات
The authors declare no competing financial interests, conflicts of interest, or personal relationships that could have influenced the work reported in this study.
شكر وتقدير
The authors acknowledge the publicly available healthcare datasets and computational resources provided by the UCI Machine Learning Repository, the National Institutes of Health, and PhysioNet. The authors further acknowledge the contributions of open-source software communities supporting TensorFlow, PyTorch, SHAP, LIME, and federated learning frameworks, which were used during experimental implementation, explainability analysis, and security validation.
المواد
| الاسم | الشركة | رقم فهرسي | التعليقات |
|---|---|---|---|
| CUDA Toolkit | NVIDIA | 12.2 | GPU acceleration |
| Faker | Faker Community | Latest | Synthetic data generation |
| Flower Federated Learning Framework | Flower AI | 1.9 | Federated learning implementation |
| Git | Git Community | 2.45 | Version control and reproducibility |
| Jupyter Notebook | Project Jupyter | Latest | Protocol execution |
| LIME | LIME Development Community | 0.2.0 | Local interpretability analysis |
| Matplotlib | Matplotlib Developers | 3.9 | Visualization of experimental results |
| MIMIC-III Clinical Database | PhysioNet | v1.4 | Electronic health record dataset |
| NIH ChestX-ray14 Dataset | National Institutes of Health | ChestX-ray14 | Chest radiograph dataset |
| NumPy | NumPy Developers | 1.26 | Numerical computation |
| NVIDIA RTX 4090 GPU | NVIDIA | 24 GB VRAM | Model training and inference |
| OpenCV | OpenCV Organization | 4.10 | Medical image preprocessing |
| OpenSSL | OpenSSL Project | 3.x | Encrypted communication |
| Pandas | Pandas Development Team | 2.2 | Clinical data processing |
| Python | Python Software Foundation | 3.11 | Machine learning implementation |
| PyTorch | PyTorch Foundation | 2.3 | Neural network implementation |
| Scikit-learn | Scikit-learn Developers | 1.5 | Data preprocessing and model evaluation |
| SciPy | SciPy Developers | 1.13 | Statistical analysis |
| SHAP | SHAP Development Community | 0.46 | Global explainability analysis |
| Statsmodels | Statsmodels Developers | 0.14 | Statistical significance testing |
| TensorBoard | 2.15 | Training monitoring | |
| TensorFlow | 2.15 | Deep learning framework | |
| Ubuntu Linux | Canonical | 22.04 LTS | Operating system |
| UCI Machine Learning Repository | University of California, Irvine | Latest | Structured clinical datasets |
| XlsxWriter | Open Source | 3.x | Export of experimental results |
المراجع
- Topol EJ. High-performance medicine: the convergence of human and artificial intelligence. Nat Med. 2019;25(1):44-56.
- Esteva A, et al. A guide to deep learning in healthcare. Nat Med. 2019;25(1):24-29.
- Rajpurkar P, et al. AI in health and medicine. Nat Med. 2022;28(1):31-38.
- Davenport T, Kalakota R. The potential for artificial intelligence in healthcare. Future Healthc J. 2019;6(2):94-98.
- Rudin C. Stop explaining black box machine learning models for high-stakes decisions and use interpretable models instead. Nat Mach Intell. 2019;1(5):206-215.
- Bhattacharya S, et al. Deep learning and medical image processing for coronavirus disease diagnosis. Sustain Cities Soc. 2021;65:102589.
- Dash S, et al. Explainable multimodal deep learning for transparent cancer diagnosis: integrating radiology, clinical features, and decision visualization. Front Artif Intell. 2026;9:1767612.
- Dash S, et al. Artificial intelligence for early endometrial cancer diagnosis using multimodal clinical data: integrating deep learning, explainability, and data privacy. Front Artif Intell. 2026;9:1787508.
- Rieke N, et al. The future of digital health with federated learning. NPJ Digit Med. 2020;3:119.
- Kaissis GA, Makowski MR, Rückert D, Braren RF. Secure, privacy-preserving and federated machine learning in medical imaging. Nat Mach Intell. 2020;2(6):305-311.
- Shenoy A, Appel JM. Safeguarding confidentiality in electronic health records. Camb Q Healthc Ethics. 2017;26(2):337-341.
- McMahan HB, et al. Communication-efficient learning of deep networks from decentralized data [conference paper]. Presented at: 20th International Conference on Artificial Intelligence and Statistics; Fort Lauderdale, FL; 2017. p. 1273-1282.
- Sheller MJ, et al. Federated learning in medicine: facilitating multi-institutional collaborations without sharing patient data. Sci Rep. 2020;10:12598.
- Li T, Sahu AK, Talwalkar A, Smith V. Federated learning: challenges, methods, and future directions. IEEE Signal Process Mag. 2020;37(3):50-60.
- Holzinger A, Carrington A, Müller H. Measuring the quality of explanations: the system causability scale. KI Kunstl Intell. 2020;34(2):193-198.
- Tjoa E, Guan C. A survey on explainable artificial intelligence: toward medical XAI. IEEE Trans Neural Netw Learn Syst. 2021;32(11):4793-4813.
- Pervez K, Sohail SI, Parwez F, Zia MA. Towards trustworthy AI-driven leukemia diagnosis: a hybrid hierarchical federated learning and explainable AI framework. Inform Med Unlocked. 2025;53:101618.
- Saeed F, et al. Explainable artificial intelligence: a systematic review of deep learning applications in healthcare. Comput Biol Med. 2023;153:106535.
- Nauta M, et al. From anecdotal evidence to quantitative evaluation methods: a systematic review on evaluating explainable AI. ACM Comput Surv. 2023;55(13S):295.
- Kelly CJ, et al. Key challenges for delivering clinical impact with artificial intelligence. Lancet Digit Health. 2019;1(1):e35-e36.
- Ghassemi M, Oakden-Rayner L, Beam AL. The false hope of current approaches to explainable artificial intelligence in health care. Lancet Digit Health. 2021;3(11):e745-e750.
- Cutillo CM, et al. Machine intelligence in healthcare—perspectives on trustworthiness, explainability, usability, and transparency. NPJ Digit Med. 2020;3:47.
- Rivera SC, et al. SPIRIT-AI extension: protocol guidelines for clinical trials evaluating artificial intelligence interventions. Nat Med. 2020;26(9):1351-1363.
- Beam AL, Manrai AK, Ghassemi M. Challenges to the reproducibility of machine learning models in health care. JAMA. 2020;323(4):305-306.
- Parwez K, et al. Explainable federated transformer framework for joint leukemia classification and stage prediction. Sci Rep. 2026;16:4493.
- Parwez K, et al. A trust-centered explainable deep-learning framework for acute lymphoblastic leukemia detection using multimodel fusion and interpretability scoring. Algorithms. 2026;19(2):162.
- Amann J, et al. Explainability for artificial intelligence in healthcare: a multidisciplinary perspective. BMC Med Inform Decis Mak. 2020;20:310.
- Wiens J, et al. Do no harm: a roadmap for responsible machine learning for health care. Nat Med. 2019;25(9):1337-1340.
- Callejón-Leblic MA, et al. A multimodal database for the collection of interdisciplinary audiological research data in Spain. Auditio. 2024;8:e109.