This prospective cohort study followed 200 patients undergoing five families of minimally invasive orthopedic procedures within an institutional enhanced-recovery pathway. Hospital stay, postoperative pain through discharge, time to independent ambulation, and functional outcomes at 3 months were assessed.
مقالة بحثية
Early Perioperative Recovery Patterns Across Diverse Minimally Invasive Orthopedic Procedures: A Prospective Cohort Study
في هذه المقالة
ملخص
الملخص
Minimally invasive orthopedic surgery (MIOS) has been increasingly adopted to reduce surgical trauma and facilitate postoperative recovery. However, few datasets describe real-world early recovery across diverse minimally invasive procedures. This prospective observational cohort study enrolled 200 adult patients who underwent minimally invasive orthopedic surgery at a tertiary academic center between 15 December 2022 and 31 December 2024. Procedures included minimally invasive spine surgery, minimally invasive total knee arthroplasty (TKA), minimally invasive total hip arthroplasty (THA), percutaneous sacroiliac joint fusion (SI arthrodesis), and arthroscopic or percutaneous fixation procedures. Primary outcomes were hospital stay, time to independent ambulation, VAS pain score, and patient-reported functional outcome. Secondary outcomes included operative time, blood loss in the operating room, complications, readmission, and reoperation. The median hospital stay was 2.1 days (interquartile range [IQR] 1.4–2.9), and the median time to independent ambulation was 1.6 days (IQR 1.1–2.1). Mean operative time was 91.1 ± 24.0 minutes, and mean estimated blood loss was 136.6 ± 47.7 mL. Preoperatively, patients had a mean VAS pain score of 7.2 ± 1.1, which decreased to 3.1 ± 0.8 at hospital discharge. There was a significant improvement in functional outcome for all procedure categories (p < 0.001). The overall incidence of complications was 7.5% (95% CI 3.8-11.2%). The 30-day readmission rate was 2.0% (n = 4), and the 90-day reoperation rate was 1.0% (n = 2). These findings characterize early perioperative recovery trajectories across five categories of minimally invasive orthopedic procedures, providing benchmark recovery timelines to support preoperative patient counseling and inform future comparative studies.
المقدمة
Minimally invasive orthopedic surgery (MIOS) has evolved substantially over the past two decades, driven by advances in surgical instrumentation, image-guided technologies, and perioperative care pathways. These approaches aim to minimize soft-tissue disruption, reduce perioperative morbidity, and facilitate faster postoperative recovery while maintaining the effectiveness of conventional open procedures. Consequently, minimally invasive techniques are now widely adopted across multiple orthopedic subspecialties, including spine surgery, joint arthroplasty, sacroiliac joint interventions, and arthroscopic procedures. At the same time, increasing emphasis has been placed on patient-centered outcomes, such as early mobilization, reduced postoperative pain, and shorter hospital length of stay, which are now recognized as key indicators of surgical recovery and healthcare efficiency1,2.
Conventional open orthopedic procedures are often associated with extensive soft-tissue dissection, increased intraoperative blood loss, and delayed functional recovery. Minimally invasive approaches seek to mitigate these limitations through smaller incisions, muscle-sparing techniques, and specialized instrumentation. These surgical strategies are frequently integrated with Enhanced Recovery After Surgery (ERAS) protocols, which incorporate multimodal analgesia, early mobilization, and standardized perioperative pathways to optimize recovery and improve clinical outcomes2,3.
A growing body of literature has evaluated outcomes associated with minimally invasive orthopedic techniques. Systematic reviews and meta-analyses have demonstrated that, in selected clinical settings, minimally invasive approaches may offer advantages such as reduced intraoperative blood loss, shorter hospital stays, and faster early recovery compared with conventional techniques4,5. Similarly, minimally invasive sacroiliac joint fusion has been associated with favorable safety profiles and functional outcomes in appropriately selected patient populations6. However, most of the available evidence is limited to single procedure types or specific subspecialties, thereby restricting the ability to derive broader insights into recovery patterns across the spectrum of minimally invasive orthopedic interventions.
Importantly, there remains a lack of prospective, real-world evidence describing early perioperative recovery trajectories across heterogeneous minimally invasive orthopedic procedures within a unified clinical setting. Existing studies are frequently retrospective, procedure-specific, or conducted in narrowly defined patient populations. As a result, there is limited understanding of how key recovery metrics, such as hospital length of stay, time to ambulation, pain trajectories, and short-term functional outcomes, vary across different minimally invasive procedures when delivered under standardized perioperative care models. This gap limits the ability to contextualize recovery expectations, optimize perioperative pathways, and inform patient counseling in routine clinical practice.
Understanding early recovery patterns is particularly relevant in the context of ERAS-based care, where timely mobilization, effective pain control, and efficient discharge planning are central to improving outcomes and healthcare resource utilization. A comprehensive prospective evaluation of these parameters across diverse minimally invasive procedures may therefore provide valuable insights into contemporary perioperative performance.
Accordingly, the present study aimed to prospectively evaluate perioperative outcomes and early recovery characteristics in patients undergoing a range of minimally invasive orthopedic procedures at a tertiary academic center. The study specifically aimed to (1) describe hospital length of stay across the five procedure categories; (2) describe the change in postoperative pain from baseline to hospital discharge; (3) describe time to independent ambulation; and (4) identify patient- and procedure-level predictors of length of stay. It was hypothesized that length of stay, discharge pain, and time to ambulation would differ across procedure categories, reflecting differences in surgical complexity rather than in the shared perioperative pathway. The procedures included vary in anatomical location and surgical complexity but share four minimally invasive surgical principles: minimizing soft-tissue disruption, providing muscle-sparing exposure, using fluoroscopic or arthroscopic guidance, and embedding within a standardized enhanced recovery pathway. These shared features are the basis for analyzing the five procedures together in a single cohort. The current study thus did not assess the effectiveness of the procedures but rather focused on common perioperative recovery areas.
البروتوكول
The study protocol was reviewed and approved by the Institutional Ethics Committee of Sanming Second Hospital (Approval No. sm2ykj20221215; approved 11 December 2022), and the study was conducted in accordance with the Declaration of Helsinki. Participant enrollment commenced on 15 December 2022, following ethics approval, and written informed consent was obtained from all participants before enrollment. As a non-interventional observational cohort study, this study was not registered in a clinical trial registry; prospective registration is not required for observational studies under the International Committee of Medical Journal Editors policy. This report follows the STROBE (Strengthening the Reporting of Observational Studies in Epidemiology) recommendations for cohort studies (Supplementary File 1).
Study population
Surgical procedures included minimally invasive spine surgery (MISS) involving degenerative spinal conditions, minimally invasive total knee (MIS-TKA) and hip arthroplasty (MIS-THA), percutaneous fusion of the sacroiliac (SI) joints, arthroscopic procedures, and percutaneous repair of the peripheral joints. These procedures were chosen to represent the current clinical applications of minimally invasive orthopedic techniques in various subspecialties1,4. The study subjects were adult patients undergoing an elective minimally invasive orthopedic operation at Sanming Second Hospital. Following ethics approval, all eligible consecutive patients were screened and enrolled from 15 December 2022 through 31 December 2024 according to predefined criteria until the predetermined target of 200 patients was reached; all 200 enrolled patients were included in the analysis, with discharge data complete for all participants and the 3-month patient-reported assessment completed by 180 (90%), the remainder handled by imputation as described in the Statistical Analysis section (Supplementary File 1). The participants had to be 18 years or older, diagnosed with a musculoskeletal condition, have a history of surgical procedures, and have an American Society of Anesthesiologists (ASA) physical status of I-III. In addition, participants had to be able to complete patient-reported outcome measures in the postoperative follow-up period. Patients were also excluded if they had an ongoing infection at or near the site of operation, had a prior significant operation at the index anatomical position, or had a malignancy at the site of operation.
Additional exclusion criteria were cognitive impairment preventing reliable informed consent or completion of outcome questionnaires, and emergency trauma cases requiring urgent surgical intervention. Prospective baseline demographic and clinical data were recorded at enrollment. These variables were age, sex, body mass index (BMI), smoking, comorbid conditions (diabetes mellitus and hypertension), baseline pain assessed using the Visual Analog Scale (VAS), and procedure-specific functional outcome scores. This was a prospective observational cohort study designed to evaluate perioperative outcomes and early recovery trajectories. No comparator group was included because the primary objective was to characterize recovery patterns in modern minimally invasive orthopedic practice.
Surgical techniques
All procedures were done by fellowship-trained orthopedic surgeons with over 5 years of independent clinical practice and documented experience of at least 50 minimally invasive procedures within their respective subspecialty. The surgical approach was selected according to the anatomical site, underlying pathology, and procedure-specific requirements. Although the five procedure groups differed in their operative techniques, all procedures used limited-access approaches and tissue-sparing instrumentation1.
Lumbar procedures were performed through a tubular or endoscopic working corridor. The operative level was localized with fluoroscopic guidance, followed by establishment of the working channel through sequential dilation and placement of the tubular/endoscopic access system. Decompression was then performed under direct visualization as indicated by the underlying degenerative pathology. When stabilization was required, percutaneous pedicle screws were placed under fluoroscopic guidance, followed by rod placement and confirmation of implant position with intraoperative imaging. The tubular/endoscopic access and percutaneous fixation systems used in the cohort are listed in the Table of Materials. This approach is consistent with established tubular minimally invasive lumbar decompression and fixation techniques7.
Minimally invasive total hip arthroplasty through direct anterior or mini-posterior approaches and minimally invasive total knee arthroplasty through mini-midvastus or subvastus approaches were performed based on the current arthroplasty literature5. Percutaneous sacroiliac joint fusion procedures were conducted using fluoroscopy-guided implant placement according to previously described surgical protocols6. Arthroscopic procedures were performed through joint-specific portals using an arthroscope, cannulae, and appropriate arthroscopic instruments. The joint was systematically inspected, and the identified pathology was treated using the appropriate arthroscopic instruments. Where percutaneous fixation was required, the target was localized using fluoroscopy, guidewires were positioned through limited incisions, and cannulated fixation hardware was inserted under fluoroscopic guidance. Because the subgroup included procedures involving different peripheral joints, the exact portal configuration and fixation technique varied according to the joint and pathology. The arthroscopic visualization, instrumentation, and fixation hardware are listed in the Table of Materials.
The surgical approach was procedure-specific, while postoperative management followed an institutional enhanced-recovery pathway, with procedure-specific modifications where appropriate across the five procedure groups. Preoperative education included expected recovery milestones and discharge criteria. Multimodal analgesia was used with a non-opioid baseline regimen, supplemented by regional or local anesthetic techniques and opioid-sparing rescue medication when appropriate. Early mobilization was encouraged within the first postoperative day, pharmacologic thromboprophylaxis followed the institution-specific protocol, and discharge was based on adequate pain control with oral medication, appropriate ambulation, and the absence of acute surgical concerns2.
Outcome measures
Clinical outcomes were recorded during the postoperative hospital stay and at discharge; VAS pain was assessed at baseline and hospital discharge, and procedure-specific functional outcomes were assessed at baseline and at the 3-month postoperative follow-up. A 6-week interim contact was originally scheduled for safety monitoring only (complication and readmission screening) and did not include repeat patient-reported outcome measures, which is why no 6-week functional or pain scores are reported. Early recovery factors, such as length of hospital stay (LOS), time to independent ambulation, severity of postoperative pain, and short-term functional recovery, were the primary outcomes of interest. Length of stay was defined as the number of days from the date of surgery to hospital discharge. Time to independent ambulation was defined as the first postoperative day on which the patient walked at least 20 meters without an assistive device and without human assistance. Pain intensity was measured using a 0–10 cm Visual Analog Scale (VAS), a validated instrument widely used for postoperative orthopedic pain assessment. Because LOS and time to independent ambulation were not normally distributed, these outcomes were summarized as medians and interquartile ranges (IQRs) and compared across procedure categories using the Kruskal–Wallis test.
Procedure-specific instruments were used to measure functional outcomes. The Oswestry Disability Index (ODI; scored 0-100, higher scores indicating greater disability) was used for patients undergoing spinal and sacroiliac procedures; the Western Ontario and McMaster Universities Osteoarthritis Index (WOMAC; scored 0-96, higher scores indicating worse symptoms and function) for patients undergoing hip and knee arthroplasty; and the American Orthopaedic Foot and Ankle Society (AOFAS) score and the Constant score (each scored 0-100, higher scores indicating better function) for foot/ankle and shoulder procedures, respectively, within the arthroscopy/percutaneous fixation group. Each instrument was administered at baseline and at the 3-month follow-up by trained assessors. Published measurement-property evidence supports the use of these instruments in their respective orthopedic populations; a detailed psychometric review of patient-reported outcome measures after knee arthroplasty is provided by Ramkumar et al8.
Secondary outcomes were operative time, estimated intraoperative blood loss, need for blood transfusion, postoperative complications, 30-day readmission rate, and 90-day reoperation rate. Postoperative complications were recorded systematically and classified using the modified Clavien-Dindo classification system, which provides a standardized way to report surgical adverse events9.
Given the heterogeneity of included procedures, outcomes were analyzed both for the overall cohort and stratified by procedure category. Procedure type was also included as a covariate in multivariable regression models to account for differences in surgical complexity and recovery profiles. Follow-up completion rates were recorded at each time point. Outcome data at discharge were available for all participants, while the 3-month patient-reported outcome assessment was completed in 90% of patients; the 6-week contact, being a safety check rather than an outcomes visit, is not separately tabulated. Missing 3-month follow-up values (approximately 10% of patients) were imputed, and the final analysis dataset therefore contained complete outcome data for all 200 patients; a complete-case sensitivity analysis was not performed, which is acknowledged as a limitation.
Sample size considerations
A target sample size of 200 patients was selected to provide adequate representation across the five predefined minimally invasive procedure categories and to support multivariable modeling of selected perioperative and recovery outcomes. The sample size was selected to support subgroup analyses by procedure type and to enable multivariate regression modeling of selected perioperative and recovery outcomes; however, it was not intended to meet an events-per-variable criterion for event-based regression analyses. No formal a priori sample size calculation was performed; the following precision-based justification was computed post hoc from the achieved dataset. With N = 200, the overall complication rate (7.5%) is estimated with a 95% confidence interval of 3.8% to 11.2% (margin of error ±3.7 percentage points), and the mean length of stay (2.2 ± 1.0 days) is estimated to within ±0.15 days at 95% confidence.
Statistical analysis
The primary outcomes of interest were hospital length of stay, time to independent ambulation, postoperative pain (VAS), and functional outcome scores. Secondary outcomes included operative time, blood loss, complications, readmissions, and reoperations. The statistical analysis was performed using SPSS version 26.0 (IBM Corp., Armonk, NY, USA) and R version 4.2. Continuous variables were summarized as mean ± standard deviation (SD) when approximately normally distributed and as median interquartile range (IQR) when distributions were non-normal, based on the Shapiro-Wilk test. Length of stay and time to independent ambulation were analyzed as non-normally distributed outcomes using the Kruskal-Wallis test. Frequencies and percentages were used to show categorical variables. Analysis of variance (ANOVA) was used for normally distributed continuous variables (operative time, blood loss, discharge VAS), and the Kruskal-Wallis test was used for non-normally distributed continuous variables (length of stay, time to ambulation), with normality assessed by the Shapiro-Wilk test within each procedure subgroup. Where the omnibus test was significant, pairwise comparisons were made using Tukey's HSD (for ANOVA) or Dunn's test with a Benjamini-Hochberg false discovery rate correction (for the Kruskal-Wallis test). Paired baseline-to-3-month changes in functional outcome scores were assessed with paired t-tests (all subgroups met normality of the difference scores), and are reported with 95% confidence intervals and Cohen's d. The association between procedure category and the occurrence of complications was assessed using a Monte Carlo exact test (50,000 permutations), given the small expected cell counts.
For the multivariable linear regression model predicting hospital length of stay, covariates included age, sex, BMI, baseline VAS pain, and procedure category, with procedure category entered as four indicator variables and minimally invasive spine surgery as the reference category. Model assumptions were assessed using standard diagnostic methods, including evaluation of residual distributions and multicollinearity. Adjusted regression coefficients with 95% confidence intervals were reported for the multivariable linear regression model. Missing 3-month patient-reported functional outcome data (20 of 200 patients, 10%) were addressed using last-observation-carried-forward, in which each patient's most recent previously observed functional outcome score was carried forward as the 3-month value; no other variables required imputation. Because this is a single deterministic approach rather than multiple imputation, it does not propagate uncertainty about the missing values into the standard errors of subsequent analyses, and no multiple-imputation pooling procedure (e.g., Rubin's rules) was applicable. LOCF-imputed values were included in the baseline-to-3-month functional outcome analyses reported in Tables and Figures. A two-sided p-value <0.05 was considered statistically significant for all analyses. To reduce bias due to procedural heterogeneity, outcomes were additionally stratified and descriptively analyzed by procedure category.
النتائج
Patient characteristics
A total of 200 patients were included in the final analysis; participant enrollment occurred from 15 December 2022 through 31 December 2024. The average age of the population studied was 58.4 ± 11.2, and 108 patients (54%) were female. The average body mass index (BMI) was 27.9 ± 4.6 kg/m2. Diabetes mellitus (32%) and hypertension (48%) were commonly comorbid, and 18% of patients were active smokers at surgery. Baseline pain intensity was clinically significant, with a mean ± SD Visual Analog Scale (VAS) score of 7.2 ± 1.1. Among spinal surgery patients, the average baseline Oswestry Disability Index (ODI) score was 48.6 ± 7.9, and the mean Western Ontario and McMaster Universities Osteoarthritis Index (WOMAC) score in the arthroplasty group was 60.6 ± 9.3 (Table 1).
| Variable | Value |
| Age (years), mean ± SD | 58.4 ± 11.2 |
| Female sex, n (%) | 108 (54%) |
| BMI (kg/m²), mean ± SD | 27.9 ± 4.6 |
| Diabetes mellitus, n (%) | 64 (32%) |
| Hypertension, n (%) | 96 (48%) |
| Smoking status (current), n (%) | 36 (18%) |
| Baseline VAS pain score | 7.2 ± 1.1 |
| Baseline ODI (spine subgroup) | 48.6 ± 7.9 |
| Baseline WOMAC (arthroplasty subgroup) | 60.6 ± 9.3 |
Table 1: Baseline demographic and clinical characteristics of the study population (N = 200). Data are presented as mean ± standard deviation (SD) for continuous variables and n (%) for categorical variables. The baseline ODI was calculated only for patients in the minimally invasive spine surgery subgroup. Baseline WOMAC was calculated for patients in the minimally invasive total knee or hip arthroplasty subgroups only. Abbreviations: BMI = body mass index; VAS = Visual Analog Scale; ODI = Oswestry Disability Index; WOMAC = Western Ontario and McMaster Universities Osteoarthritis Index.
Distribution of surgical procedures
Patients underwent a variety of orthopedic subspecialty procedures as part of minimally invasive orthopedics. Minimally invasive spine surgery (MISS) was the most widespread- 34% (n = 68). This was then accompanied by minimally invasive total knee arthroplasty (MIS-TKA) in 27% (n = 54) of patients and minimally invasive total hip arthroplasty (MIS-THA) in 21% (n = 42) of patients. Other less common procedures included percutaneous sacroiliac joint fusion (9%), arthroscopy or percutaneous fixation (9%) (Table 2).
| Procedure Type | N (%) |
| Minimally invasive spine surgery (MISS) | 68 (34%) |
| MIS–total knee arthroplasty (MIS-TKA) | 54 (27%) |
| MIS–total hip arthroplasty (MIS-THA) | 42 (21%) |
| Percutaneous SI joint fusion | 18 (9%) |
| Arthroscopy/percutaneous fixation | 18 (9%) |
Table 2: Distribution of minimally invasive procedures (N = 200). The table summarizes the frequency and percentage distribution of minimally invasive orthopedic procedures included in the prospective cohort study. Minimally invasive spine surgery (MISS) represented the largest subgroup, followed by minimally invasive total knee arthroplasty (MIS-TKA) and minimally invasive total hip arthroplasty (MIS-THA). Fewer patients underwent percutaneous sacroiliac joint fusion and arthroscopy/percutaneous fixation procedures.
Intraoperative outcomes
The mean operative time in the total cohort, weighted across the five procedure subgroups in Table 3, was 91.1 ± 24.0 minutes. The longest operative time was observed in minimally invasive spine surgery (104.6 ± 22.9 minutes), whereas arthroscopic or percutaneous fixation procedures had the shortest operative time (62.7 ± 14.4 minutes). Differences across procedure groups were statistically significant (one-way ANOVA, F (4,195) = 20.85, p < 0.001, eta-squared = 0.30). Tukey's HSD post-hoc testing confirmed that MISS had significantly longer operative times than every other procedure (all p <= 0.008), and arthroscopy/percutaneous fixation was significantly shorter than every other procedure (all p ≤ 0.001); MIS-TKA and MIS-THA did not differ significantly from each other (p = 0.90) (Table 3).
| Procedure | Operative Time (min) |
| MISS (n = 68) | 104.6 ± 22.9 |
| MIS-TKA (n = 54) | 92.1 ± 18.3 |
| MIS-THA (n = 42) | 88.4 ± 21.5 |
| SI Joint Fusion (n = 18) | 71.3 ± 16.9 |
| Arthroscopy/Percutaneous Fixation (n = 18) | 62.7 ± 14.4 |
Table 3: Mean operative time by procedure. Values are presented as mean ± standard deviation. Minimally invasive spine surgery (MISS) demonstrated the longest operative duration, whereas arthroscopy/percutaneous fixation procedures had the shortest operative time.
Intraoperative estimated blood loss also differed significantly between the categories of procedures (one-way ANOVA, F(4,195) = 40.07, p < 0.001, eta-squared = 0.45; Tukey's HSD confirmed MISS had significantly greater blood loss than every other procedure, all p ≤ 0.003, and arthroscopy/percutaneous fixation had significantly less blood loss than every other procedure, all p ≤ 0.008). The greatest level of blood loss (167.5 ± 40.2 mL) and the lowest level of blood loss (58.2 ± 22.8 mL) were reported by arthroscopic procedures for the arthroscopic/percutaneous fixation group. In general, 8 patients (4%) required perioperative blood transfusion; the highest transfusion rate was in the MIS-THA group (3 of 42, 7.1%) (Table 4).
| Procedure | Operative time (min) | Blood loss (mL) | Transfusion (%) |
| MISS (n = 68) | 104.6 ± 22.9 | 167.5 ± 40.2 | 3 (4.4%) |
| MIS-TKA (n = 54) | 92.1 ± 18.3 | 132.4 ± 35.1 | 2 (3.7%) |
| MIS-THA (n = 42) | 88.4 ± 21.5 | 142.1 ± 37.3 | 3 (7.1%) |
| SI Joint Fusion (n = 18) | 71.3 ± 16.9 | 98.4 ± 22.7 | 0 |
| Arthroscopy/Percutaneous Fixation (n = 18) | 62.7 ± 14.4 | 58.2 ± 22.8 | 0 |
Table 4: Intraoperative outcomes. The table summarizes operative duration, estimated blood loss, and perioperative transfusion requirements across minimally invasive orthopedic procedures. Values are presented as mean ± SD or frequency (%).
Primary outcomes
Length of hospital stay
The median hospital stay (LOS) for the overall cohort was 2.1 days (IQR 1.4–2.9). By procedure category, median LOS was 2.8 days (IQR 1.8–3.4) for MISS, 2.45 days (IQR 1.73–2.90) for MIS-TKA, 2.0 days (IQR 1.4–2.48) for MIS-THA, 1.8 days (IQR 1.35–2.33) for SI joint fusion, and 1.2 days (IQR 0.63–1.40) for arthroscopy/percutaneous fixation. Ninety-five of 200 patients (47.5%) were discharged by postoperative day 2. Differences in LOS across procedure groups were statistically significant (Kruskal–Wallis test, H(4) = 37.19, p < 0.001, epsilon-squared = 0.17); Dunn’s post-hoc test with FDR correction confirmed that arthroscopy/percutaneous fixation had significantly shorter LOS than every other procedure (all adjusted p ≤ 0.02) (Figure 1).
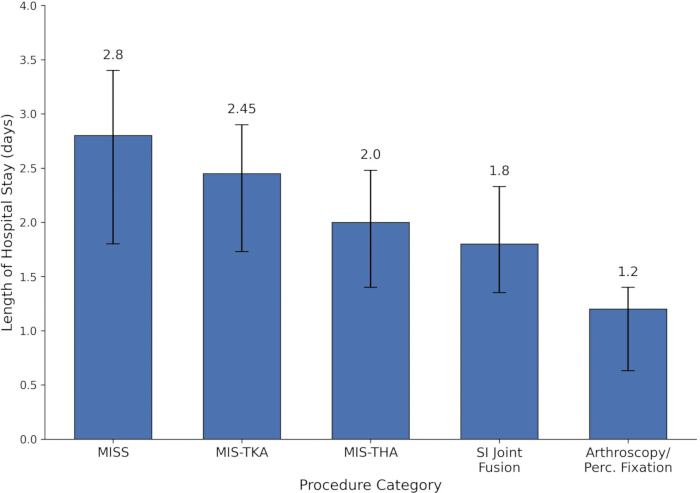
Figure 1: Comparison of hospital length of stay across minimally invasive orthopedic procedures. Bar chart illustrates the median hospital length of stay (LOS) across five minimally invasive orthopedic procedure categories. The median LOS was longest for minimally invasive spine surgery (2.8 days) and shortest for arthroscopy/percutaneous fixation (1.2 days). Group differences were statistically significant (Kruskal–Wallis test, H(4) = 37.19, p < 0.001); Dunn’s post-hoc test with FDR correction confirmed that arthroscopy/percutaneous fixation had significantly shorter LOS than every other procedure (all adjusted p ≤ 0.02). Bars represent median LOS, and error bars represent the interquartile range (IQR). Please click here to view a larger version of this figure.
Time to independent ambulation
The median time to independent ambulation for the overall cohort was 1.6 days (IQR 1.1–2.1). By procedure category, median time to ambulation was 1.8 days (IQR 1.6–2.3) for MISS, 1.7 days (IQR 1.13–2.10) for MIS-TKA, 1.4 days (IQR 1.10–1.85) for MIS-THA, 1.3 days (IQR 1.13–1.58) for SI joint fusion, and 0.9 days (IQR 0.73–1.08) for arthroscopy/percutaneous fixation. The differences in time to ambulation across procedure categories were statistically significant (Kruskal-Wallis test, H (4) = 43.44, p < 0.001, epsilon-squared = 0.20; Dunn's post-hoc with false discovery rate (FDR) correction confirmed arthroscopy/percutaneous fixation had significantly earlier ambulation than every other procedure, all adjusted p ≤ 0.03) (Table 5).
| Outcome | MISS | MIS-TKA | MIS-THA | SI Fusion | Arthroscopy/Fixation |
| LOS, median (IQR), days | 2.8 (1.8–3.4) | 2.45 (1.73–2.90) | 2.0 (1.4–2.48) | 1.8 (1.35–2.33) | 1.2 (0.63–1.40) |
| Ambulation, median (IQR), days | 1.8 (1.6–2.3) | 1.7 (1.13–2.10) | 1.4 (1.10–1.85) | 1.3 (1.13–1.58) | 0.9 (0.73–1.08) |
| VAS at discharge, mean ± SD | 3.4 ± 0.8 | 3.2 ± 0.7 | 3.1 ± 0.8 | 2.9 ± 0.6 | 2.4 ± 0.5 |
Table 5: Early postoperative recovery outcomes. Values are presented as median (IQR) for length of stay and time to independent ambulation and as mean ± SD for discharge VAS.
Postoperative pain outcomes
The intensity of postoperative pain was reduced considerably during the postoperative period. The mean VAS score decreased from 7.2 ± 1.1 at baseline to 3.1 ± 0.8 at hospital discharge, representing a significant within-patient reduction (paired t-test, t (199) = 40.94, p < 0.001, mean difference = −4.05 points, 95% CI −4.25 to −3.86, Cohen’s d = −2.89). Discharge VAS scores differed significantly across the five procedure categories (one-way ANOVA, F (4,195) = 7.35, p < 0.001, η2 = 0.131). Tukey HSD post-hoc comparisons showed that the arthroscopy/percutaneous fixation group had significantly lower discharge VAS scores than the MIS-THA (p = 0.007), MIS-TKA (p < 0.001), and MISS (p < 0.001) groups. No other pairwise comparisons were statistically significant. Figure 2 shows the reduction in VAS pain scores from baseline to hospital discharge.
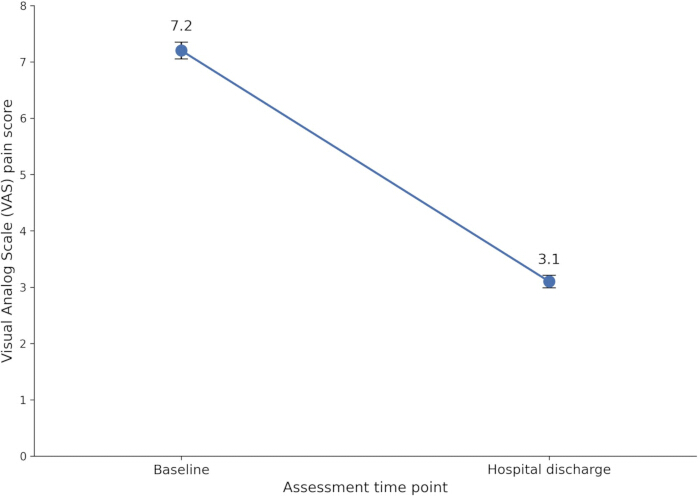
Figure 2: Change in VAS pain scores from baseline to hospital discharge. Points represent mean Visual Analog Scale (VAS) pain scores for the full cohort (N = 200), and error bars represent 95% confidence intervals. Mean VAS decreased from 7.2 at baseline to 3.1 at hospital discharge (paired t-test, t(199) = 40.94, p < 0.001). Please click here to view a larger version of this figure.
Functional outcomes
Significant improvements in functional outcomes were observed across all surgical categories during the follow-up period, confirmed by paired t-tests with 95% confidence intervals and effect sizes for each procedure: MISS ODI improved by a mean of 30.3 points (95% CI 27.9 to 32.7, Cohen's d = -2.99, p < 0.001); MIS-TKA WOMAC improved by 39.5 points (95% CI 36.7 to 42.3, Cohen's d = -3.73, p < 0.001); MIS-THA WOMAC improved by 37.2 points (95% CI 34.3 to 40.1, Cohen's d = -3.89, p < 0.001); SI fusion ODI improved by 24.2 points (95% CI 18.2 to 30.2, Cohen's d = -1.85, p < 0.001); and arthroscopy/percutaneous fixation AOFAS/Constant scores improved by 28.6 points (95% CI 22.6 to 34.6, Cohen's d = 2.20, p < 0.001). The disability scores of patients who have undergone minimal spine surgery improved significantly, with ODI values changing from 48.6 ± 7.9 at baseline to 18.3 ± 5.1 at three months (p < 0.001). Similarly, the WOMAC score in the MIS-TKA group improved from 62.3 ± 9.4 at baseline to 22.8 ± 6.7 at three months (p < 0.001). Similar results were found in MIS-THA, where the WOMAC hip scores improved from 58.4 ± 8.7 at baseline to 21.2 ± 5.5 at three months (p < 0.001). Percutaneous sacroiliac joint fusion patients showed significant improvements in ODI scores, whereas the use of arthroscopy/percutaneous fixation operations indicated significant functional improvement in terms of AOFAS and Constant (Table 6). Procedure-specific improvements are illustrated in Figure 3.
| Procedure | Baseline | 3-Month | p |
| MISS (ODI; n = 68) | 48.6 ± 7.9 | 18.3 ± 5.1 | <0.001 |
| MIS-TKA (WOMAC; n = 54) | 62.3 ± 9.4 | 22.8 ± 6.7 | <0.001 |
| MIS-THA (WOMAC hip; n = 42) | 58.4 ± 8.7 | 21.2 ± 5.5 | <0.001 |
| SI Joint Fusion (ODI; n = 18) | 52.1 ± 8.3 | 27.9 ± 6.9 | <0.001 |
| Arthroscopy/Percutaneous Fixation (AOFAS/Constant; n = 18) | 58.1 ± 10.4 | 86.7 ± 6.3 | <0.001 |
Table 6: Functional outcome scores. The table summarizes baseline and 3-month postoperative functional outcome scores across categories of minimally invasive orthopedic procedures. Procedure-specific validated assessment instruments were used, including ODI, WOMAC, AOFAS, and Constant scores. Values are presented as mean ± standard deviation.
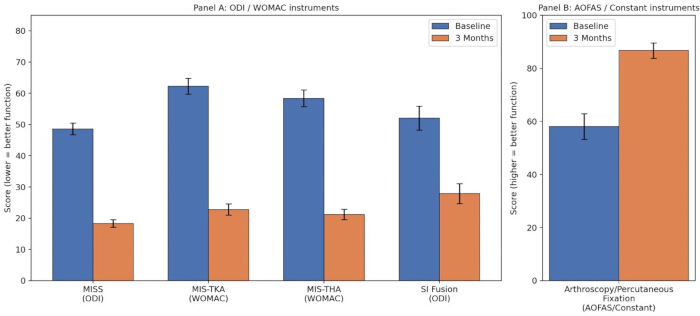
Figure 3: Functional outcome improvements across minimally invasive orthopedic procedures. Bar chart illustrating functional outcome scores at baseline and 3-month follow-up, split into two panels by scoring direction to avoid displaying instruments with opposite scoring conventions on one axis. (A) Oswestry Disability Index (ODI, MISS and SI joint fusion) and Western Ontario and McMaster Universities Osteoarthritis Index (WOMAC, MIS-TKA and MIS-THA), where lower scores indicate better function. (B) American Orthopedic Foot and Ankle Society (AOFAS) and Constant scores (arthroscopy/percutaneous fixation), where higher scores indicate better function. All within-procedure changes were statistically significant (paired t-tests, all p < 0.001; see Results for exact 95% CIs and effect sizes). Data are presented as mean ± 95% confidence interval (CI); error bars represent the 95% CI. Please click here to view a larger version of this figure.
Secondary outcomes
Postoperative complications
Complication rates were calculated based on the total study population (N = 200). A total of 15 complications (7.5%) were recorded in the study cohort. Most complications were considered minor (Clavien-Dindo grade I-II), comprising 12 cases (6%), and 3 patients (1.5%) had major complications requiring surgical or interventional interventions (grade III). Minimally invasive spine surgery (MISS) had the highest count (n = 6 of 68, 8.8%), followed by SI joint fusion (n = 2 of 18, 11.1%, the highest rate), MIS-TKA (n = 4 of 54, 7.4%), arthroscopy/percutaneous fixation (n = 1 of 18, 5.6%), and MIS-THA (n = 2 of 42, 4.8%, the lowest rate). A Monte Carlo exact test (50,000 permutations) found no statistically significant association between procedure category and complication occurrence (chi-square = 1.06, p = 0.89) - the numeric range across procedures is consistent with chance, given the small subgroup sizes, and should not be over-interpreted as a true difference in risk between procedures (Table 7). Procedure-specific complication rates are shown in Figure 4.
| Outcome | Value |
| Overall complications | 15 (7.5%) |
| By procedure category: | |
| MISS | 6/68 (8.8%) |
| MIS-TKA | 4/54 (7.4%) |
| MIS-THA | 2/42 (4.8%) |
| SI Joint fusion | 2/18 (11.1%) |
| Arthroscopy/Percutaneous fixation | 1/18 (5.6%) |
| Minor (Clavien-Dindo I–II) | 12 (6%) |
| Major (Clavien-Dindo III) | 3 (1.5%) |
| 30-day readmission | 4 (2%) |
| 90-day reoperation | 2 (1%) |
Table 7: Complications and readmissions. The table summarizes postoperative complications, readmissions, and reoperations observed in the study cohort. Complications were classified according to the modified Clavien-Dindo grading system. Values are presented as frequency (%).
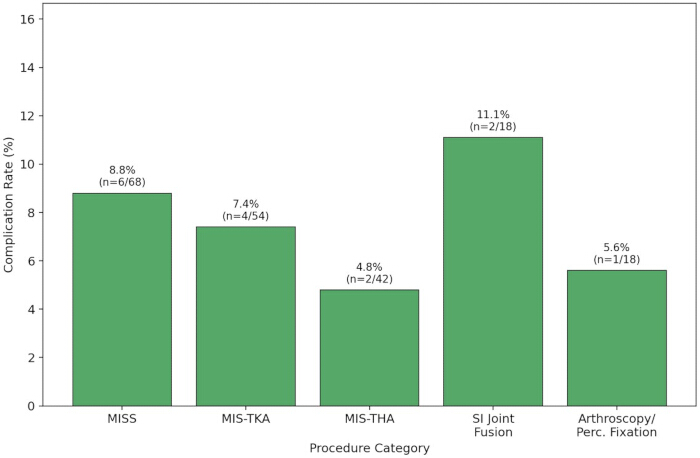
Figure 4: Postoperative complication rates across minimally invasive orthopedic procedures. Bar chart illustrating procedure-specific postoperative complication rates: MISS 8.8% (n = 6/68), MIS-TKA 7.4% (n = 4/54), MIS-THA 4.8% (n = 2/42), SI joint fusion 11.1% (n = 2/18, the highest rate), and arthroscopy/percutaneous fixation 5.6% (n = 1/18). The overall complication rate was 7.5% (15/200). A Monte Carlo exact test (50,000 permutations) found no statistically significant association between procedure category and complication occurrence (chi-square = 1.06, p = 0.89). Please click here to view a larger version of this figure.
Readmissions and reoperations
The 30-day hospital readmission rate was 2% (n = 4). The 90-day reoperation rate was 1% (n = 2), with both reoperations performed for implant repositioning. No procedure-related mortality occurred during the follow-up period.
Multivariable regression analysis
Multivariable linear regression analysis was performed to identify predictors of hospital length of stay. The model included age, sex, BMI, baseline VAS pain, and procedure category, with the category entered as four indicator variables, with minimally invasive spine surgery (MISS) as the reference category. In the multivariable model (R-squared = 0.181, adjusted R-squared = 0.146, F(8,191) = 5.27, p < 0.001), procedure category was significantly associated with length of stay. MIS-THA (β = −0.53 days relative to MISS, 95% CI −0.91 to −0.15, p = 0.007), SI joint fusion (β = −0.71 days, 95% CI −1.22 to −0.19, p = 0.008), and arthroscopy/percutaneous fixation (β = −1.51 days, 95% CI −2.02 to −1.01, p < 0.001) were each associated with significantly shorter hospital stays than MISS. MIS-TKA did not differ significantly from MISS (β = −0.24 days, 95% CI −0.60 to 0.11, p = 0.17). BMI (β = −0.018 days per unit, 95% CI −0.048 to 0.012, p = 0.23), age (p = 0.17), sex (p = 0.96), and baseline VAS pain (p = 0.73) were not statistically significant predictors of length of stay. Variance inflation factors for all covariates were below 1.4, indicating no meaningful multicollinearity (Figure 5).
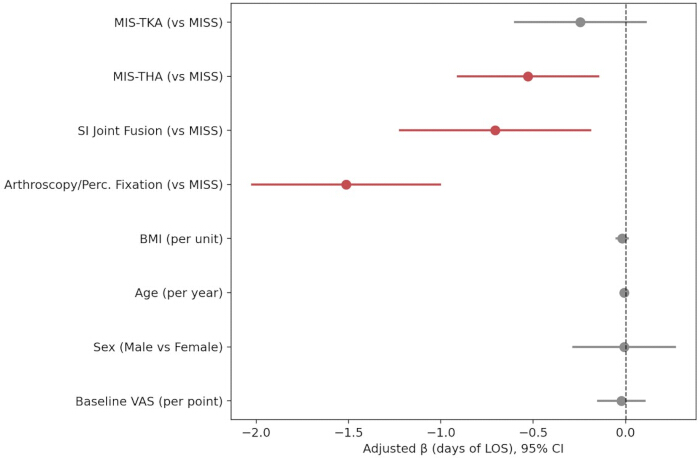
Figure 5: Multivariable regression model predicting length of hospital stay. Forest plot illustrating adjusted regression coefficients (β) with 95% confidence intervals for predictors of hospital length of stay (LOS), with minimally invasive spine surgery (MISS) as the reference procedure category. MIS-THA, SI joint fusion, and arthroscopy/percutaneous fixation were each associated with significantly shorter stay than MISS (shown in red); MIS-TKA, BMI, age, sex, and baseline VAS pain were not statistically significant predictors (shown in gray, confidence intervals cross zero). Vertical dashed reference line indicates β = 0. Model: R-squared = 0.181, adjusted R-squared = 0.146, F (8,191) = 5.27, p < 0.001. Please click here to view a larger version of this figure.
DATA AVAILABILITY:
The de-identified participant-level data supporting the findings of this study are publicly available in the Figshare repository at https://doi.org/10.6084/m9.figshare.33737332.
Supplementary Figure 1: Participant flow through enrollment, follow-up, and analysis. All 200 screened patients met the eligibility criteria and were enrolled. The 3-month patient-reported outcome assessment was completed by 180 participants; missing 3-month functional outcome data for 20 participants were handled using last observation carried forward (LOCF). Please click here to download this file.
Supplementary File 1: STROBE checklist. Completed the Strengthening the Reporting of Observational Studies in Epidemiology (STROBE) checklist for the prospective observational cohort study, indicating where each recommended reporting item is addressed in the manuscript. Please click here to download this file.
المناقشة
In this prospective cohort of 200 patients undergoing five families of minimally invasive orthopedic procedures within an institutional enhanced-recovery pathway, the median hospital stay was 2.1 days (IQR 1.4–2.9), and the median time to independent ambulation was 1.6 days (IQR 1.1–2.1). Pain decreased from 7.2 ± 1.1 at baseline to 3.1 ± 0.8 at discharge, while the overall complication rate was 7.5%. The present study was not designed as a comparative effectiveness study, but rather as a prospective cohort study describing perioperative recovery pathways in everyday clinical practice under a standardized perioperative treatment concept. The anatomical indications for the procedures varied, and their surgical complexity varied, but they shared common minimally invasive principles and enhanced recovery strategies, which justified evaluation of common early recovery domains: postoperative pain, ambulation, hospital length of stay, and short-term functional recovery.
Notably, since no open-surgery comparator group was included in the study at the time, the findings should be interpreted as descriptive reports of recovery profiles associated with minimally invasive orthopedic surgeries rather than evidence of comparative superiority. The observed patterns of recovery can largely be attributed to the extensive body of literature on favorable perioperative outcomes of minimally invasive orthopedic techniques. Some systematic reviews have found that minimally invasive surgical techniques in spine and joint surgeries may be associated with fewer soft-tissue injuries, less perioperative bleeding, and earlier postoperative mobilization than conventional techniques4,5. The median hospital length of stay in the overall cohort was 2.1 days (IQR 1.4–2.9), and 47.5% of patients were discharged by postoperative day 2. Similar results may be explained by improved recovery-based orthopedic research, which has shown a decrease in hospitalizations with the use of minimally invasive methods and standardized perioperative pathways2,3.
Early mobilization is another important sign of postoperative recovery in contemporary orthopedic practice. The median time to independent ambulation was 1.6 days (IQR 1.1–2.1) in the overall cohort. Arthroscopy/percutaneous fixation had the shortest median time to ambulation (0.9 days), whereas minimally invasive spine surgery had the longest (1.8 days). This trend probably indicates variations in the complexity of surgery and underlying pathology, rather than in surgical technique itself. Other research studies on minimally invasive spine surgery have also documented a slightly longer recovery course than other types of surgery, such as arthroscopic or joint surgery, given the structural pathology it addresses7,10. Nevertheless, the median time to independent ambulation in the spine surgery subgroup was 1.8 days, consistent with contemporary enhanced recovery protocols.
The postoperative pain reduction observed in this study was substantial by hospital discharge. Mean VAS scores decreased from 7.2 preoperatively to 3.1 at hospital discharge, demonstrating a substantial early reduction in postoperative pain. This reduction is consistent with previously reported results in minimally invasive orthopedic surgery, in which there is less tissue disruption and muscle-sparing surgical techniques, and is thought to reduce the inflammatory reaction and lead to a faster resolution of pain10,11. This study design does not allow a causal conclusion about whether these improvements are specifically related to the use of minimally invasive procedures or to other factors, such as perioperative care pathways. Substantial improvements were also observed in functional outcome measures across all procedure categories. Patients who underwent minimally invasive spine surgery showed significant improvements in Oswestry Disability Index scores, and those who underwent minimally invasive total knee and hip arthroplasty showed significant improvements in WOMAC scores at 3 months. These findings are consistent with other outcome studies that have shown significant functional improvements after minimally invasive arthroplasty and spine surgery, as measured by validated patient-reported outcome measures8,12. Similarly, patients undergoing sacroiliac joint fusion and arthroscopic procedures demonstrated clinically meaningful improvements in functional scores during follow-up. These findings are broadly comparable with published evidence: in the randomized-trial evidence summarized by Martin et al., mean ODI improvement after minimally invasive SI joint fusion was 26 points at 6 months, compared with 6 points with nonsurgical management, while the SI fusion subgroup showed a mean functional improvement of 24.2 points at 3 months. These cross-study comparisons should be interpreted with caution because the studies assessed outcomes at different follow-up durations and therefore do not represent directly comparable estimates of outcomes11. Likewise, in a meta-analysis of 38 trials (3,296 procedures), minimally invasive TKA achieved shorter hospitalization, lower estimated blood loss, and higher Knee Society functional scores than the standard medial parapatellar approach, at the cost of a longer operative time, a trade-off mirrored in the cohort, where MIS-TKA had a median hospital stay of 2.45 days (IQR 1.73–2.90) and a mean operative time of 92.1 minutes12. For hip arthroplasty, meta-analytic evidence across 47 randomized trials likewise supports comparable safety of minimally invasive relative to conventional approaches, consistent with the low complication rate (4.8%) observed in the MIS-THA subgroup5.
The magnitude of the functional gains observed exceeds commonly cited minimal clinically important difference (MCID) thresholds for these instruments: published MCID estimates for the Oswestry Disability Index in lumbar spine surgery populations are commonly reported in the range of approximately 10 to 15 points13, well below the 30.3-point (MISS) and 24.2-point (SI fusion) improvements observed here; published minimal important differences for the WOMAC index in knee arthroplasty populations are likewise substantially smaller than the 39.5-point (MIS-TKA) and 37.2-point (MIS-THA) improvements observed in this cohort14. This suggests the observed changes are not only statistically significant but also clinically meaningful by established benchmarks, though the absence of a comparator group means the relative contribution of the surgical approach itself, versus the shared perioperative pathway, cannot be isolated. Postoperative complication rates in the present study were relatively low, with an overall complication rate of 7.5% and major complications occurring in only 1.5% of patients. These findings are similar to the complication rates found in recent systematic reviews of minimally invasive orthopedic procedures4. Importantly, most complications were grade 1 or 2 complications (Classified as minor in accordance with the Clavien-Dindo system). While minimally invasive surgical approaches have been hypothesized to reduce perioperative morbidity, the current study does not permit the establishment of a causal link between surgical technique and complication rates because of its observational design.
The multivariable analysis indicated that procedure category was the principal factor associated with hospital length of stay after adjustment for age, sex, BMI, baseline VAS pain, and procedure category. MIS-THA, SI joint fusion, and arthroscopy/percutaneous fixation were associated with shorter stays than MISS, whereas MIS-TKA did not differ significantly from MISS. Age, sex, BMI, and baseline VAS pain were not statistically significant independent predictors of length of stay. These findings should be interpreted in the context of the substantial differences in procedure type and underlying pathology across the cohort. The association between procedure category and recovery measures suggests that differences in surgical complexity and underlying pathology may contribute to variation in length of stay and ambulation time. Because the study lacked a comparator group and included heterogeneous procedure categories, these findings should not be interpreted as evidence that the minimally invasive approach itself caused the observed recovery patterns.
This study did not collect cost, bed occupancy, or throughput data, so any implications for healthcare system efficiency remain hypothetical rather than demonstrated. Shorter hospital stay and earlier ambulation, if replicated in comparative studies, could plausibly support improved resource utilization and surgical throughput in high-volume orthopedic institutions, but this was not directly assessed here. Enhanced recovery pathways that combine minimally invasive surgical techniques have been increasingly explored as part of efforts to optimize perioperative efficiency and patient-centered outcomes3. Nevertheless, the scalability of such approaches remains dependent on institutional resources, surgical expertise, and the availability of standardized perioperative care pathways.
Limitations
Several limitations of the present study should be acknowledged. First, the absence of a comparator group limits direct conclusions regarding relative effectiveness. This design aligns with the study objective of describing recovery patterns in contemporary minimally invasive practice. Future comparative and randomized studies are warranted to further evaluate relative benefits. Second, the heterogeneous nature of procedural categories leads to heterogeneity in baseline pathology, surgical complexity, and recovery curves. Although outcomes were stratified by procedure category, residual heterogeneity in anatomical site, underlying pathology, surgical complexity, and subgroup size limits the interpretation of cross-procedure comparisons. Third, the study was performed at a single tertiary center and may not be generalizable to other clinical settings. Approximately 10% of participants had missing 3-month functional outcome assessments, and these values were addressed using last-observation-carried-forward (LOCF). The resulting estimates should therefore be interpreted with appropriate caution, as this deterministic approach does not account for uncertainty in the missing values and may bias the estimated 3-month changes if the missing data are not completely at random. Finally, the follow-up period was limited to three months, so the long-term consequences of the procedure, such as implant survival, revision surgery, and long-term functional durability, could not be assessed. In addition, no formal sample size calculation was performed a priori, which may affect the precision of subgroup estimates; approximately 10% of patients were lost to follow-up and their outcomes were imputed, which could bias results if missingness was not random; surgeon-level variation and learning-curve effects were not adjusted for beyond a minimum case-volume threshold; four different functional outcome instruments were used across procedure subgroups, which prevents direct comparison of functional gain between categories; the cohort was drawn from a single country and ethnicity and assessed with instruments normed on other populations. Outcome assessment was not blinded; no radiographic, implant survival, or patient satisfaction outcomes were collected. The arthroscopy/percutaneous fixation subgroup pooled AOFAS (foot/ankle) and Constant (shoulder) scores from two different anatomical sites, preventing joint-specific analysis. Future studies should report these outcomes separately by anatomical site. Finally, the study was not designed to determine whether minimally invasive surgery is better than traditional open surgery. Thus, the early recovery pattern observed in this study is not considered evidence of the superior efficacy or durability of minimally invasive methods, or of their overall superiority. Comparative, long-term randomized studies are still needed. Future multicenter studies with standardized outcome measures and longer follow-up durations are warranted to further validate these findings.
Conclusion
This prospective cohort characterizes early recovery patterns across five families of minimally invasive orthopedic procedures performed under a single standardized perioperative pathway. The results suggest consistent improvements in postoperative recovery parameters, including reduced pain, improved function, and early mobilization. Multicenter studies with sufficiently large sample sizes and controlled, extended follow-up periods are to be conducted in the future to assess long-term implications and further compare the comparative effectiveness of minimally invasive and traditional surgical methodologies. The study should primarily be interpreted as a real-world descriptive assessment of perioperative recovery rather than a comparative evaluation of surgical effectiveness.
الإفصاحات
The authors have no conflicts of interest to declare that are relevant to the content of this article.
AI-assisted tools were used for language editing, figure preparation, and verification of statistical calculations derived from the study dataset. All statistical analyses were computed by Jinji Zhang using IBM SPSS Statistics version 26.0 and R version 4.2; the AI tool was not used as the primary statistical analysis software. The reported statistical results were reviewed and verified by the authors, who take full responsibility for their accuracy and interpretation.
شكر وتقدير
The authors sincerely thank the staff members of the Department of Orthopedic Surgery and the perioperative nursing team at Sanming Second Hospital, Fujian Province, China, for their assistance with patient care, clinical coordination, and postoperative follow-up throughout participant enrollment and postoperative follow-up. The authors also acknowledge the contributions of all participating patients whose cooperation made this prospective observational study possible. This work received no external funding. AI-assisted tools were used for language editing, statistical verification, and figure preparation. The authors take full responsibility for the content of this manuscript.
المواد
| الاسم | الشركة | رقم فهرسي | التعليقات |
|---|---|---|---|
| American Orthopaedic Foot and Ankle Society (AOFAS) score | Kitaoka et al. (instrument) | N/A | Foot and ankle score, 0-100 (higher = better function). Foot/ankle cases within arthroscopy/percutaneous fixation subgroup. |
| Arthroscopic instrumentation set | Arthrex, Inc., Naples, FL, USA | AR-8730-12H–60H | Arthroscopic hand instruments, shaver and cannulae. Arthroscopy/percutaneous fixation subgroup (n = 18). |
| Arthroscopy imaging system (camera, light source, monitor) | KARL STORZ SE & Co. KG, Tuttlingen, Germany | TC301 / IMAGE1 S X-LINK | Arthroscopic visualization. Arthroscopy/percutaneous fixation subgroup (n = 18). |
| Constant-Murley score | Constant & Murley (instrument) | N/A | Shoulder function score, 0-100 (higher = better function). Shoulder cases within arthroscopy/percutaneous fixation subgroup. |
| Mobile C-arm fluoroscopy unit | Siemens Healthineers, Erlangen, Germany | Cios Select (VA21C/VA21B) | Intraoperative fluoroscopic guidance for minimally invasive spine surgery and percutaneous sacroiliac joint fusion. |
| Oswestry Disability Index (ODI) | Fairbank & Pynsent (instrument) | N/A | Patient-reported disability instrument, 0-100 (higher = greater disability). MISS and SI joint fusion subgroups. |
| Percutaneous fixation hardware (cannulated screws) | Arthrex, Inc., Naples, FL, USA | AR-8737S | Percutaneous repair of peripheral joints. Arthroscopy/percutaneous fixation subgroup (n = 18). |
| Percutaneous pedicle screw fixation system | Medtronic Sofamor Danek, Inc., Memphis, TN, USA | 55850046545 | Percutaneous pedicle fixation under fluoroscopic guidance. MISS subgroup (n = 68). |
| Percutaneous sacroiliac joint fusion implant system | SI-BONE, Inc., Santa Clara, CA, USA | 13550T | Fluoroscopy-guided implant placement. SI joint fusion subgroup (n = 18). |
| R statistical software, version 4.2 | R Foundation for Statistical Computing, Vienna, Austria | N/A | Post-hoc testing, effect sizes, Monte Carlo exact test. |
| SPSS Statistics, version 26.0 | IBM Corp., Armonk, NY, USA | N/A | Descriptive statistics, ANOVA/Kruskal-Wallis testing, regression modeling. |
| Total hip arthroplasty implant system | Stryker Orthopaedics, Mahwah, NJ, USA | Trident Tritanium Acetabular System | Implanted via direct anterior or mini-posterior approach. MIS-THA subgroup (n = 42). |
| Total knee arthroplasty implant system | Stryker Orthopaedics, Mahwah, NJ, USA | 5520-B-X00 | Implanted via mini-midvastus or subvastus approach. MIS-TKA subgroup (n = 54). |
| Tubular/endoscopic spinal access system | Medtronic Sofamor Danek, Inc., Memphis, TN, USA | 9560102 | Muscle-sparing access for minimally invasive spine surgery. MISS subgroup (n = 68). |
| Visual Analog Scale (VAS) for pain | Generic validated instrument | N/A | 0-10 cm pain scale recorded at baseline and hospital discharge. |
| Western Ontario and McMaster Universities Osteoarthritis Index (WOMAC) | Bellamy et al. (instrument) | N/A | Patient-reported osteoarthritis index, 0-96 (higher = worse symptoms/function). MIS-TKA and MIS-THA subgroups. |
المراجع
- Liang W, et al. Current advancements in therapeutic approaches in orthopedic surgery: a review of recent trends. Front Bioeng Biotechnol. 2024;12:1328997.
- Wainwright TW, et al. Consensus statement for perioperative care in total hip replacement and total knee replacement surgery: Enhanced Recovery After Surgery (ERAS) Society recommendations. Acta Orthop. 2020;91(1):3-19.
- Hu ZC, et al. An enhanced recovery after surgery program in orthopedic surgery: a systematic review and meta-analysis. J Orthop Surg Res. 2019;14(1):77.
- Rafaqat W, et al. Is minimally invasive orthopedic surgery safer than open? A systematic review of systematic reviews. Int J Surg. 2022;101:106616.
- Ramadanov N, Marinova-Kichikova P, Hable R, Dimitrov D. Minimally invasive versus conventional approaches in total hip arthroplasty: a systematic review and meta-analysis of 47 randomized controlled trials. Prosthesis. 2023;5(3):962-91.
- Whang PG, et al. Minimally invasive SI joint fusion procedures for chronic SI joint pain: systematic review and meta-analysis of safety and efficacy. Int J Spine Surg. 2023;17(6):794.
- Mooney J, et al. Minimally invasive versus open lumbar spinal fusion: a matched study investigating patient-reported and surgical outcomes. J Neurosurg Spine. 2021;36(5):753-66.
- Ramkumar P, Harris JD, Noble P. Patient-reported outcome measures after total knee arthroplasty: a systematic review. Bone Joint Res. 2015;4(7):120-7.
- Dindo D, Demartines N, Clavien PA. Classification of surgical complications: a new proposal with evaluation in a cohort of 6336 patients and results of a survey. Ann Surg. 2004;240(2):205-13.
- Haibier A, Yusufu A, Hang L, Abudurexiti T. Comparison of clinical outcomes and complications between endoscopic and minimally invasive transforaminal lumbar interbody fusion for lumbar degenerative diseases: a systematic review and meta-analysis. J Orthop Surg Res. 2024;19(1):92.
- Martin CT, Haase L, Lender PA, Polly DW Jr. Minimally invasive sacroiliac joint fusion: the current evidence. Int J Spine Surg. 2020;14(Suppl 1):S20.
- Migliorini F, et al. Better outcomes after minimally invasive surgeries compared to the standard invasive medial parapatellar approach for total knee arthroplasty: a meta-analysis. Knee Surg Sports Traumatol Arthrosc. 2021;29(11):3608-20.
- Copay AG, et al. Minimum clinically important difference in lumbar spine surgery patients: a choice of methods using the Oswestry Disability Index, Medical Outcomes Study questionnaire Short Form 36, and pain scales. Spine J. 2008;8(6):968-74.
- Holtz N, et al. Minimal important differences for the WOMAC osteoarthritis index and the Forgotten Joint Score-12 in total knee arthroplasty patients. BMC Musculoskelet Disord. 2020;21(1):1-9.