This study integrates multiple public transcriptomic datasets to identify and prioritize prognostic and metastasis-associated biomarkers in prostate cancer and functionally evaluates the top candidate, myosin VI, in human prostate cancer cell lines using lentiviral knockdown, migration, invasion, proliferation, and Western blotting assays.
مقالة بحثية
Multi-Dataset Transcriptomic Screening Identifies Myosin VI as a Prognostic Biomarker Linked to Migration in Prostate Cancer
* These authors contributed equally
في هذه المقالة
ملخص
الملخص
Distant metastasis remains a principal determinant of mortality in prostate cancer (PCa), yet markers associated with metastatic potential at an early stage remain scarce. Here, cross-cohort mining of public transcriptomic data was combined with in vitro loss-of-function experiments to nominate and characterize candidate prognostic and metastasis-associated markers in PCa. Six independent cohorts—the Cancer Genome Atlas prostate adenocarcinoma cohort (TCGA-PRAD) and five Gene Expression Omnibus (GEO) series—were analyzed separately for differential expression between tumor and adjacent normal tissue, with Benjamini–Hochberg control of the false discovery rate (FDR) applied within each dataset before cross-dataset comparison. This analysis identified 81 consensus differentially expressed genes (DEGs). Candidates were prioritized by protein–protein interaction (PPI) network analysis, weighted gene co-expression network analysis (WGCNA), and exploratory Kaplan–Meier survival screening. The two leading genes were re-examined using the Tumor Immune Estimation Resource (TIMER) database, where only myosin VI (MYO6) remained associated with shorter overall survival (hazard ratio [HR] = 2.35, P = 0.0385). Lentiviral short hairpin RNA (shRNA) silencing of MYO6 in PC-3 and DU145 cells reduced migration and invasion, whereas colony-formation and MTS assays showed a concurrent increase in proliferation, a dissociation compatible with a “go-or-grow” trade-off. Immunoblotting after MYO6 silencing showed higher E-cadherin and Claudin-1 and lower N-cadherin, whereas Vimentin changed in the opposite direction, indicating a partial rather than complete epithelial shift. These findings identify MYO6 as a prognostic and metastasis-associated candidate in PCa and support the broader applicability of this screening framework for biomarker nomination in other tumor types.
المقدمة
Prostate cancer (PCa) ranks second among malignancies diagnosed in men and is the fifth most frequent cause of male cancer death worldwide1. In the United States, the age-adjusted incidence of PCa fell sharply between 2007 and 2014 following changes in prostate-specific antigen (PSA)-screening recommendations but has subsequently risen by approximately 3% per year, with the steepest increases confined to advanced disease2. Distant-stage disease has become more common over the past decade, with annual increases of about 2.6% in men under 55 years, 6.0% in men aged 55–69 years, and 6.2% in men aged 70 years or older2. PCa also shows striking survival heterogeneity according to metastatic burden: the 5-year relative survival rate approaches 100% for localized or regional disease but drops to approximately 30–37% for distant-stage disease3. What remains lacking are dependable molecular indicators that can be applied early in the disease course to gauge the likelihood of metastasis and anticipate prognosis. Markers of this kind would make risk-adapted follow-up and individualized treatment feasible.
Substantial transcriptomic heterogeneity between tumor and adjacent normal tissues has made integrative mining of public genomic databases a feasible strategy for biomarker discovery. The Cancer Genome Atlas (TCGA) assembles comprehensive multi-omics profiles for a broad range of patients across diverse cancer types4, while the Gene Expression Omnibus (GEO) curates an extensive collection of independent microarray and RNA-seq datasets5. Together, these repositories constitute a valuable resource for cross-cohort re-analysis and for the identification of novel diagnostic and prognostic candidates across a wide spectrum of diseases6.
Although numerous candidate biomarkers for PCa have been proposed from transcriptomic analyses, most were identified from single cohorts, which limits their reproducibility across patient populations and sequencing platforms. Few have undergone experimental validation. It therefore remains unclear which candidates are consistently dysregulated in PCa and which are functionally associated with the metastatic behavior of PCa cells. In particular, the functional role of MYO6 in PCa cell migration and metastasis, and the molecular mechanisms underlying it, have not been established. To address this gap, the present study aimed to identify robust PCa biomarkers by integrating differentially expressed genes (DEGs) across multiple independent datasets and then to experimentally evaluate the function of MYO6, a key candidate emerging from this screen. We performed a series of in vitro loss-of-function assays to assess the effects of MYO6 knockdown on PCa cell migration, invasion, and proliferation and examined whether these changes were accompanied by alterations in epithelial–mesenchymal transition (EMT)-related marker expression. The overall study design is illustrated in Figure 1.
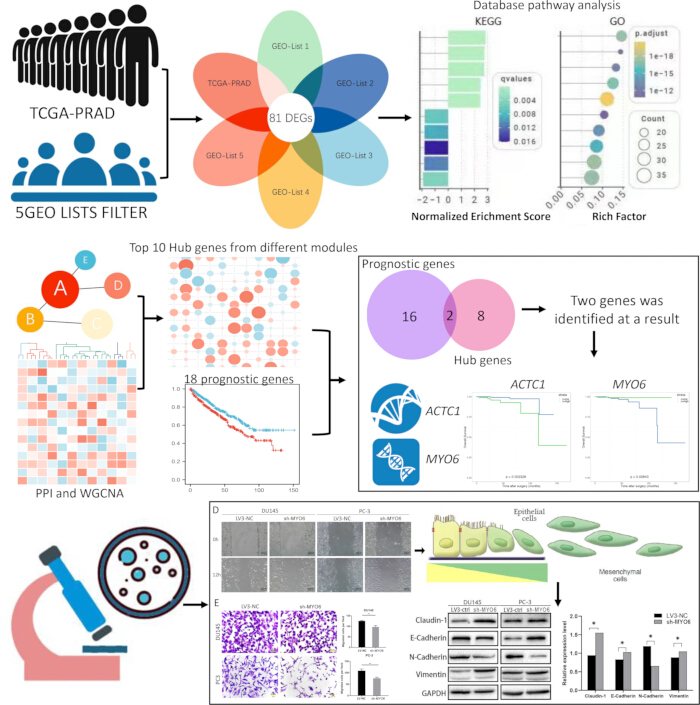
Figure 1. Overall study workflow. Schematic of the analytical pipeline, from multi-dataset DEG identification using TCGA-PRAD and five GEO datasets through functional enrichment, PPI network and WGCNA analyses, prognostic prioritization, and in vitro functional validation of MYO6 in prostate cancer cells. Please click here to view a larger version of this figure.
البروتوكول
This study used only publicly available, de-identified data from TCGA and GEO and commercially available established human cell lines; therefore, institutional ethics approval was not required.
Bioinformatics analysis
Data acquisition:
mRNA expression profiling data were retrieved from GEO5 and TCGA4. Five GEO microarray series were included: GSE21034, GSE89194, GSE70770, GSE60329, and GSE6919. The sample sizes of all datasets are shown in Table 1. Clinical and follow-up data for TCGA cases were downloaded directly from the TCGA data portal.
| Dataset | Tumor | Non-tumor |
| GSE21034 | 131 | 29 |
| GSE89194 | 49 | 49 |
| GSE70770 | 206 | 172 |
| GSE60329 | 54 | 14 |
| GSE6919 | 65 | 81 |
| TCGA-PRAD | 499 | 52 |
Table 1: Sample sizes of the transcriptomic datasets. Numbers of tumor and non-tumor samples included in each of the five GEO datasets and the TCGA-PRAD cohort.
Identification of differentially expressed genes:
For the TCGA-PRAD RNA-seq dataset, DEGs between prostate cancer and adjacent normal tissues were identified using the edgeR quasi-likelihood (QL) pipeline (glmQLFit/glmQLFTest)7 in R (v4.1.3). Raw P values were adjusted for multiple testing, and genes with an adjusted P value (false discovery rate, FDR) < 0.01 and a fold change |FC| > 1.5 (equivalent to |log2FC| > 0.585) were called differentially expressed. The five GEO microarray series were analyzed with the limma package8 using the identical two criteria. To maximize the retention of biologically relevant candidates while accounting for inter-dataset variability, a relaxed intersection criterion was applied, requiring statistical significance in at least four of the five GEO datasets. Overlapping DEGs were visualized using a Venn diagram. This approach yielded a final set of 81 consensus DEGs for downstream analysis. Volcano plots of DEGs were generated using the gplots package in R.
Functional enrichment analysis:
Gene Ontology (GO)9 and Kyoto Encyclopedia of Genes and Genomes (KEGG)10 pathway enrichment analyses of the 81 consensus DEGs were performed using the clusterProfiler R package11, with a significance threshold of adjusted P < 0.05. GO enrichment results were categorized into three ontologies—biological process (BP), molecular function (MF), and cellular component (CC)—and visualized using the ggplot2 package in R. To evaluate the interaction landscape among the 81 consensus DEGs, a PPI network was constructed using the STRING database (v11.5) with a minimum required interaction score of 0.412 and subsequently visualized in Cytoscape13. For each gene in the network, the degree (number of direct interaction partners) was calculated, and the 10 genes with the highest degree were defined as hub genes.
Weighted gene co-expression network analysis:
WGCNA was performed using the R package WGCNA14 to investigate co-expression relationships among the 81 consensus DEGs and their associations with clinical traits. Prior to network construction, genes with FPKM ≥ 1 and a coefficient of variation (CV) ≥ 0.5 were retained to ensure reliable expression levels and sufficient inter-sample variation. An unsigned weighted gene co-expression network was constructed using a soft-thresholding power of β = 13, which satisfied the scale-free topology fit index (R2 > 0.85). The adjacency matrix was transformed into a topological overlap matrix (TOM), and the corresponding dissimilarity matrix (1 − TOM) was used for hierarchical clustering. Initial modules were identified using the Dynamic Hybrid Tree Cut algorithm with a minimum module size of 10 genes. In this study, “cancer progression” was specifically defined as tumor metastasis status. This clinical trait was coded as a binary variable: 0 for non-metastatic (pathologically confirmed N0 and M0, n = 398) and 1 for metastatic (N+ and/or M+, n = 66). For each identified module, the module eigengene (ME) was calculated as the first principal component of the module’s expression matrix. Pearson correlation analysis was performed between each ME and the binary metastasis status to evaluate module–trait associations.
Survival analysis:
Prognostic screening was carried out in R (v4.1.3) with the survival package. As an exploratory screen, each of the 81 consensus DEGs was tested individually by log-rank statistics in the TCGA-PRAD cohort without correction for multiple comparisons; this analysis was therefore intended for candidate prioritization rather than for definitive prognostic inference. Patients were split at the median expression value into high- and low-expressing groups, with overall survival (OS) displayed as Kaplan–Meier curves. Differential expression of ACTC1 and MYO6 between tumor and normal prostate tissue was then checked in GEPIA215, and their prognostic relevance was further interrogated in TIMER16. Significance was set at P < 0.05 throughout.
Experimental methods
Cell culture and transduction:
The human prostate cancer cell lines PC-3, DU145, and 22Rv1 were used. DU145 cells were maintained in Minimum Essential Medium (MEM), PC-3 cells in Ham’s F-12K medium, and 22Rv1 cells in RPMI-1640 medium. All media were supplemented with 10% fetal bovine serum (FBS), and cells were cultured at 37°C in a humidified atmosphere containing 5% CO₂. All cell lines were routinely tested for mycoplasma contamination and were confirmed negative. Lentiviral vectors expressing MYO6-targeting short hairpin RNA (sh-MYO6) and a non-targeting negative-control shRNA (LV3-NC) were designed and constructed commercially, with the shRNA target sequences selected by the supplier. The target sequences were as follows: LV3-NC, 5′-TTCTCCGAACGTGTCACGT-3′; sh-MYO6, 5′-GCAGTCGATTTGGGAAATTTG-3′. Knockdown efficiency was verified by Western blotting.
For lentiviral transduction, cells were seeded in 6-well plates at a density of 2 × 10⁵ cells per well 24 h prior to transduction, achieving approximately 60%–70% confluence at the time of infection. On the day of transduction, the culture medium was replaced with fresh medium containing lentiviral particles at a multiplicity of infection (MOI) of 10, supplemented with polybrene (5 µg/mL) to enhance transduction efficiency. The cells were incubated with the viral mixture for 12 h, after which the medium was replaced with fresh complete medium to remove residual viral particles. At 48 h post-transduction, stably transduced cells were selected by adding puromycin (2 µg/mL) to the culture medium. After 72 h of selection, surviving cells were expanded in puromycin-free complete medium for an additional 24 h before being harvested for downstream assays. Knockdown efficiency was verified by Western blotting prior to all functional experiments.
Protein extraction and Western blotting:
Cells were lysed in RIPA buffer supplemented with protease and phosphatase inhibitors, and lysate concentrations were determined by BCA assay. Aliquots containing 30 µg of total protein were resolved on 10% SDS–PAGE gels and blotted onto PVDF membranes. After a 1-h block in 5% non-fat milk prepared in TBST, membranes were probed overnight at 4°C with primary antibodies diluted in TBST, followed by HRP-conjugated secondary antibodies for 1 h at room temperature. GAPDH served as the loading control. The GAPDH loading controls were derived from the same protein samples as the corresponding target proteins. Signals were captured using a ChemiDoc XRS+ chemiluminescence imaging system, and band intensities were quantified using ImageJ image-analysis software17. Primary antibodies comprised an anti-MYO6 antibody together with antibodies against Claudin-1, N-cadherin, E-cadherin, and Vimentin.
Cell-proliferation assays:
Colony-formation assay: PCa cells (PC-3 and DU145) from the transfection group and control group were seeded in 6-well plates at 500 cells per well. After incubation at 37°C and 5% CO₂ for 10–13 days, cells were fixed with 4% paraformaldehyde and stained with 1% crystal violet in 70% ethanol. Colonies containing 50 or more cells were counted.
MTS assay: PCa cells were seeded at 1,000 cells per well in 96-well plates with 100 µL of growth medium. At 24, 48, and 72 h after seeding, 20 µL of CellTiter 96 AQueous One Solution MTS reagent was added to each well, and cell viability was determined by measuring absorbance at 490 nm after 2 h of incubation.
Cell migration and invasion assays:
For the scratch/wound-healing assay, transduced PCa cells were grown in 6-well plates until the monolayer was confluent. A scratch was then drawn across each well with a sterile 200-µL pipette tip, dislodged cells were rinsed away with pre-warmed PBS, and the cultures were switched to medium containing 1% FBS. The same fields were photographed at 0 and 12 h, and wound area was measured using the image-analysis software to derive the healing rate. Wound healing rate (%) = (Wound area at 0 h − Wound area at 12 h) / Wound area at 0 h × 100%.
For the invasion assay, 8-µm-pore Transwell chambers were pre-coated with Matrigel basement membrane matrix diluted 1:8 in cold serum-free medium; 50 µL of the diluted Matrigel was added to the upper surface of each insert and incubated at 37 °C for 1 h to allow gel formation. PC-3 cells (3 × 10⁴ per well) or DU145 cells (5 × 10⁴ per well) were resuspended in serum-free medium and loaded into the upper compartment, while medium supplemented with 10% FBS was placed below to serve as a chemoattractant. After 24 h, cells left on the upper face of the membrane were wiped off with cotton swabs; those that had traversed the insert were fixed in anhydrous methanol, stained with 0.1% crystal violet, photographed, and counted using the image-analysis software17. Invaded cells were counted in five randomly selected, non-overlapping fields per insert under a light microscope at 200× magnification, and the mean count per field was used for analysis.
Statistical analysis (experimental)
Each experiment was performed in three independent biological replicates (n = 3). For the colony-formation, MTS, wound-healing, and Transwell assays, each group was additionally plated in triplicate wells as technical replicates, and the mean of the technical replicates was used as the value for each independent experiment. Results are expressed as mean ± SD. Between-group comparisons were carried out using a two-tailed unpaired Student’s t-test. Densitometric quantification of images was conducted using the image-analysis software17, while data visualization and statistical computations were performed using statistical software. A P value below 0.05 was defined as the threshold for statistical significance.
النتائج
Identification of consensus DEGs across PCa datasets
DEGs between prostate cancer and adjacent normal tissues were first identified in each dataset. The TCGA-PRAD dataset yielded 9,458 DEGs. The five GEO datasets yielded 650, 7,199, 377, 1,748, and 1,195 DEGs in GSE21034, GSE60329, GSE6919, GSE70770, and GSE89194, respectively (Table 1). These gene lists were then compared using Venn analysis (Figure 2A), and 81 genes were identified as significant in both the TCGA-PRAD dataset and at least four of the five GEO datasets (Figure 2B; Supplementary Table 1). GO and KEGG pathway enrichment analyses were conducted on the 81 consensus DEGs. Functional enrichment analysis revealed that these genes were predominantly associated with GO biological process categories including muscle contraction, muscle system process, and wound healing (Figure 2C; Supplementary Table 2). KEGG pathway mapping further demonstrated significant enrichment in pathways related to actin cytoskeleton regulation, drug metabolism, and smooth muscle contraction (Figure 2D).
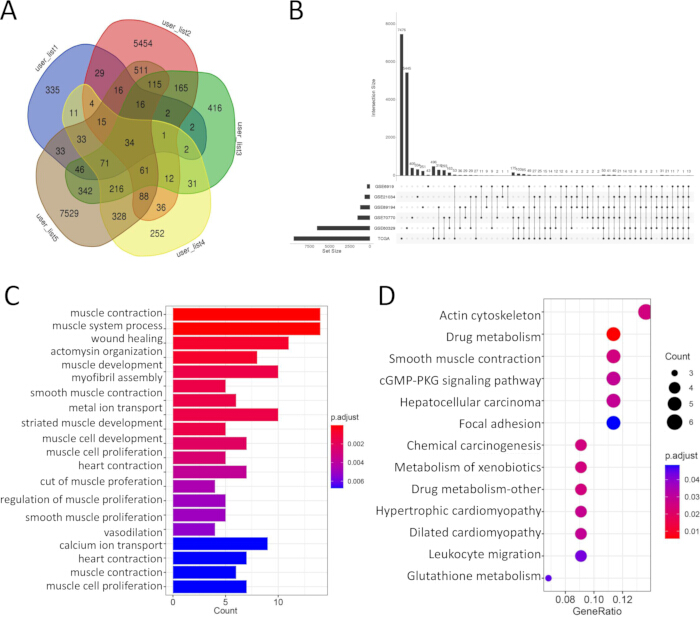
Figure 2. Identification and functional annotation of consensus DEGs. (A) Venn diagram showing DEG overlap across the five GEO datasets. (B) Intersection of GEO consensus DEGs with TCGA-PRAD DEGs, yielding 81 consensus DEGs. (C) Enriched GO biological-process terms. (D) Enriched KEGG pathways. Adjusted P < 0.05. Please click here to view a larger version of this figure.
MYO6 and ACTC1 emerge as candidate prognostic biomarkers via PPI network and survival analyses
To explore protein–protein interactions, a PPI network was constructed using the 81 consensus DEGs, from which the 10 highest-connectivity hub genes were selected for downstream investigation (Figure 3A,B). The overall DEG distribution was visualized using a volcano plot (Figure 3C). Exploratory survival analysis across the 81 DEGs using the log-rank test without multiple-testing correction identified 18 genes with nominal prognostic associations (P < 0.05). Overlap of these 18 genes with the 10 hub genes yielded two shared candidates, MYO6 and ACTC1 (Figure 3D; Table 2). Differential expression patterns between tumor and adjacent normal tissues, together with the corresponding survival curves, are presented in Figure 3E,F. Validation in TIMER showed a significant association with overall survival for MYO6 (Figure 3G; HR = 2.35, P = 0.0385). Although ACTC1 reached significance in the initial exploratory survival analysis, this association was not reproduced in TIMER (Figure 3H; HR = 0.655, P = 0.139); therefore, ACTC1 was not carried forward into the functional experiments.
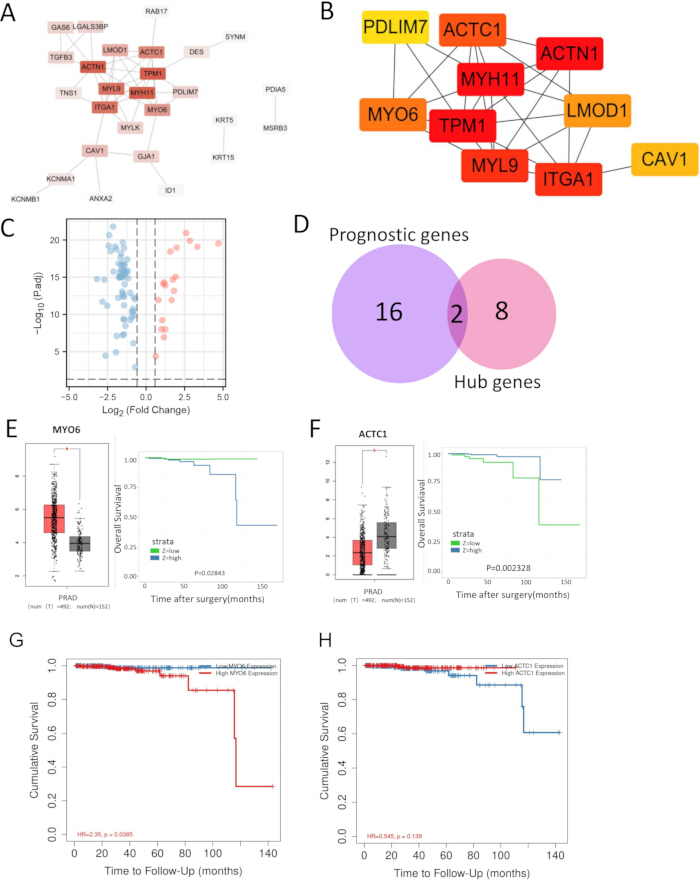
Figure 3. Hub gene identification and prognostic validation. (A) PPI network of the 81 consensus DEGs. (B) Top 10 hub genes ranked by connectivity. (C) Volcano plot of DEGs. (D) Intersection of the top 10 hub genes and 18 genes with nominal prognostic associations, identifying MYO6 and ACTC1. (E,F) Expression levels and Kaplan–Meier survival curves for MYO6 and ACTC1 from GEPIA2. (G,H) Prognostic validation of MYO6 (G) and ACTC1 (H) in TIMER. P < 0.05. Please click here to view a larger version of this figure.
| Category | n | Gene symbols |
| PPI ∩ Survival | 2 | MYO6, ACTC1 |
| Survival only | 16 | ANXA2, GAS1, HOXC6, CYP3A5, PARM1, CES1, APOBEC3C, GSTM5, CD177, AMACR, EPCAM, AOX1, PDIA5, CSRP1, PGM5, NEFH |
| PPI only | 8 | CAV1, TPM1, ITGA1, ACTN1, LMOD1, MYL9, MYH11, PDLIM7 |
Table 2: Intersection of PPI hub genes and genes with nominal prognostic associations. The top 10 hub genes from the protein–protein interaction (PPI) network were compared with the 18 genes identified by exploratory Kaplan–Meier survival analysis. Two genes, MYO6 and ACTC1, were shared between the two sets. PPI ∩ Survival indicates genes shared between the two sets; Survival only indicates genes identified only by survival analysis; and PPI only indicates genes identified only among the top 10 PPI hub genes.
WGCNA identifies three co-expression modules from the 81 consensus DEGs
The 81 consensus DEGs were clustered according to their expression patterns. Using WGCNA, three co-expression modules were constructed from the expression data (Figure 4A,C,H). Heatmaps showed the relationships between each module and its member genes (Figure 4B,D), with the blue and turquoise modules showing the strongest correlations. Scatter plots illustrated the associations between genes in each module and cancer progression, with 14, 17, and 22 genes in the brown, blue, and turquoise modules, respectively; the remaining unassigned genes were grouped in the grey module (Figure 4E–G). Module–trait correlation analysis indicated that the grey module was the only module negatively associated with cancer progression and showed the smallest P value (r = −0.15, P = 3 × 10⁻4) (Figure 4I). Because the grey module comprises genes not assigned to any co-expression module, and all module–trait correlations were weak (|r| ≤ 0.15), this association should be interpreted with caution. The distribution of prognostic hub genes derived from the PPI network across the modules, including the grey module to which MYO6 was assigned, is illustrated in Figure 4J.
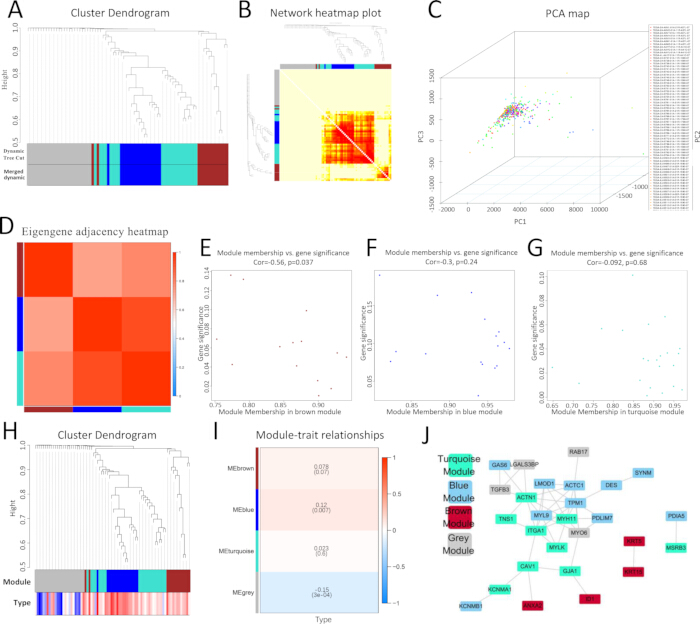
Figure 4. WGCNA of consensus DEGs. (A) Hierarchical clustering dendrogram with module color assignments. (B) Topological overlap network heatmap. (C) Principal component analysis of module genes. (D) Module eigengene adjacency heatmap. (E–G) Scatter plots of module membership versus gene significance for the brown, blue, and turquoise modules. (H) Gene dendrogram with metastasis status. (I) Module–trait correlation heatmap. (J) Distribution of prognostic hub genes across modules. Please click here to view a larger version of this figure.
MYO6 knockdown is associated with reduced migration and invasion and a partial EMT marker shift
To further evaluate the function of MYO6, a series of in vitro experiments was performed. Western blot analysis confirmed that MYO6 protein expression was markedly downregulated in PCa cells transduced with sh-MYO6 compared with the LV3-NC negative control, supporting the efficacy of the knockdown system (Figure 5A). Colony-formation and MTS assays showed that MYO6 knockdown was associated with increased cell proliferation (Figure 5B,C). In contrast, MYO6 knockdown was associated with reduced migration in the wound-healing assay (Figure 5D) and reduced invasion in the Matrigel-coated Transwell assay (Figure 5E). These observations indicate that MYO6 knockdown was associated with changes in prostate cancer cell migration and invasion, accompanied by an unexpected increase in proliferation. EMT-related markers were subsequently examined by Western blotting. Upon MYO6 silencing, E-cadherin and Claudin-1 were upregulated, whereas N-cadherin was downregulated. Vimentin was also upregulated following MYO6 knockdown (Figure 5F). Thus, MYO6 knockdown was accompanied by a mixed, partial EMT-related marker shift rather than a uniform reversal of the mesenchymal phenotype.
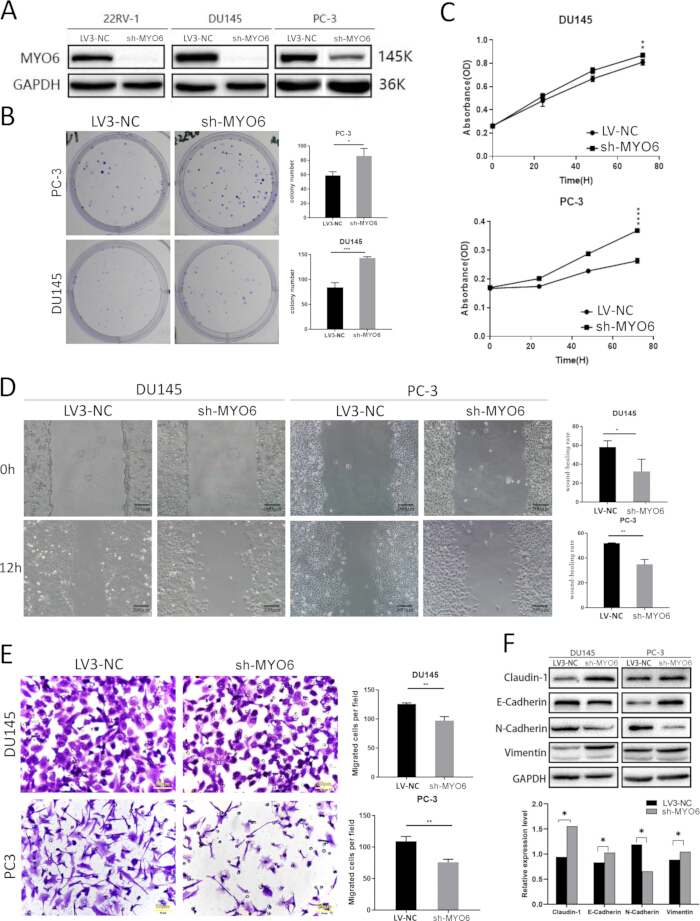
Figure 5. Functional validation of MYO6 in prostate cancer cells. (A) Western blot confirming MYO6 knockdown, with GAPDH as the loading control. (B) Colony-formation assay with quantification. (C) MTS proliferation assay in sh-MYO6 and LV3-NC cells at 24, 48, and 72 h. (D) Scratch/wound-healing migration assay with quantification. (E) Matrigel-coated Transwell invasion assay with quantification. (F) Western blot of EMT-related markers (E-cadherin, Claudin-1, N-cadherin, and Vimentin) in sh-MYO6 and LV3-NC cells, with GAPDH as the loading control. Data are presented as mean ± SD, n = 3; *P < 0.05, **P < 0.01, ***P < 0.001. Please click here to view a larger version of this figure.
Integration of TCGA-PRAD and five independent GEO datasets identified 81 consensus DEGs, from which MYO6 emerged through PPI and exploratory survival analyses as a candidate associated with prognosis. Functional experiments showed that MYO6 knockdown was associated with reduced migration and invasion, increased proliferation, and a mixed shift in EMT-related marker expression. Taken together, these results support an association between MYO6 and the migratory and invasive phenotype of PCa cells while avoiding a definitive causal or independent prognostic interpretation.
Data Availability:
All datasets analyzed in this study are publicly available. TCGA-PRAD data are available through the Genomic Data Commons portal (https://portal.gdc.cancer.gov/), and the GEO datasets GSE21034, GSE89194, GSE70770, GSE60329, and GSE6919 are available through the Gene Expression Omnibus (https://www.ncbi.nlm.nih.gov/geo/). The supporting data and analysis materials underlying the experimental and computational results, including the Western blot source data, quantitative data for the functional assays, and R analysis code, are available from the corresponding author upon reasonable request.
Supplementary Table 1. Differential expression statistics for the 81 consensus DEGs across TCGA-PRAD and five GEO datasets. For each dataset, log2 fold change (log2FC), P value, false discovery rate (FDR), and direction of regulation are reported. N/A indicates that the gene was not detected or did not pass filtering in the corresponding dataset. Consensus inclusion required significance in TCGA-PRAD and in at least four of the five GEO datasets. Please click here to download this file.
Supplementary Table 2. GO and KEGG functional enrichment results for the 81 consensus DEGs. Enriched Gene Ontology (GO) biological process terms and Kyoto Encyclopedia of Genes and Genomes (KEGG) pathways identified from the 81 consensus DEGs are reported. Please click here to download this file.
المناقشة
This study couples integrative multi-dataset transcriptomic mining with targeted in vitro functional validation to nominate and test prognostic biomarkers of PCa metastasis. The most critical step in the workflow is the consensus DEG definition: requiring concordance across multiple independent cohorts and then cross-validating prognostic candidates in an independent database (TIMER) before committing to labor-intensive functional experiments reduces the false-positive risk inherent in single-dataset analyses and prioritizes candidates for subsequent experimental evaluation. Applying this pipeline identified MYO6 as a hub gene with prognostic associations; knockdown in PC-3 and DU145 cells reduced migration and invasion while producing changes in epithelial and mesenchymal markers consistent with a partial EMT-related marker shift. These findings support the hypothesis that MYO6 is associated with PCa cell migration, invasion, and a partial EMT phenotype, while the exploratory nature of the survival analysis precludes interpretation of MYO6 as an independently validated prognostic factor.
MYO6 is an unconventional myosin that, unlike most other myosins, moves toward the minus end of actin filaments18. The first study of MYO6 in PCa reported that the protein was strongly overexpressed in tumor tissue from 240 patients and that its knockdown in LNCaP cells reduced cell migration18. Later work showed that MYO6 expression increased with Gleason score and that MYO6 is also active in ovarian, lung, and colorectal cancers19,20. More recently, AR was shown to drive MYO6 expression, with MYO6 supporting tumor growth and enzalutamide resistance through the FAK pathway21. The migration data obtained in the present study are consistent with these earlier reports and further support an association between MYO6 and PCa cell motility. One of the more striking findings obtained in this study was the dissociation between migration and proliferation: after MYO6 knockdown, PC-3 and DU145 cells migrated less but grew faster. This pattern differs from some earlier reports. Using shRNA in DU145 and PC-3 cells, one study observed reduced proliferation with cell-cycle arrest at the G2/M phase20, and another, using knockdown and overexpression in LNCaP, C4-2, and 22Rv1 cells, reported that MYO6 silencing reduced both growth and migration21. By contrast, the original LNCaP study found that MYO6 knockdown reduced migration without changing proliferation18.
The observed dissociation between migration and proliferation can be considered in light of the long-standing “go-or-grow” hypothesis, first proposed in glioma research, which holds that migration and division draw on overlapping cellular resources so that tumor cells can switch between the two states22; subsequent modeling and experimental work extended this idea to other tumor types, although the trade-off is not absolute and its strength depends on tumor type and experimental setting23,24. Differences across studies may also reflect cell line, knockdown method, AR status, and culture conditions: PC-3 and DU145 cells are AR-negative and androgen-independent, whereas LNCaP, C4-2, and 22Rv1 cells are AR-positive21. These results suggest that the role of MYO6 in PCa is not limited to growth control and that a motility–division trade-off may be relevant to understanding its cellular effects. MYO6 knockdown was confirmed in 22Rv1, PC-3, and DU145 cells, whereas the downstream functional experiments were performed in PC-3 and DU145 cells. 22Rv1 cells were included to confirm that MYO6 knockdown could be achieved across models of differing AR status, but they were not carried forward into the functional assays: compared with PC-3 and DU145, 22Rv1 cells grow more slowly and are considerably less motile, which narrows the dynamic range of migration and invasion assays and makes knockdown-associated differences difficult to resolve. For this reason, we performed the functional characterization in the PC-3 and DU145 lines.
The EMT marker data also showed an internal inconsistency that merits consideration. After MYO6 knockdown, the epithelial markers E-cadherin and Claudin-1 were upregulated, whereas the mesenchymal marker N-cadherin was downregulated—three changes consistent with a partial reversal of EMT. Vimentin, however, did not follow the same pattern. This dissociation is not unusual: EMT is now viewed as a step-by-step process with several intermediate states—often called partial or hybrid EMT—rather than a simple switch between two end points25,26. In these intermediate states, cells can simultaneously express a mixture of epithelial and mesenchymal markers, and the 2020 EMT consensus statement notes that no single marker is sufficient to define EMT and that different markers can change at different rates and in different directions26. Clinical work in PCa supports this view. An examination of EMT markers in 23 radical prostatectomy samples found that N-cadherin, vimentin, and fibronectin were rarely co-expressed in the same tumor area and that loss of E-cadherin tracked closely with a gain in N-cadherin but not with a gain in vimentin27, suggesting that the cadherin switch and vimentin expression can be regulated separately.
Several factors may explain why vimentin differed from the other markers in the present study. First, vimentin is an intermediate filament protein with a long half-life, so its filaments may persist after the upstream signal changes28. Second, vimentin transcription is controlled by several factors, including Slug, Snail, ZEB1, and Twist, which do not always move in step with the regulators of E-cadherin and N-cadherin28,29. Third, vimentin can act independently to support ERK activity and Slug phosphorylation, stabilizing its own levels even after upstream EMT signals weaken29. Together, these points indicate that the cadherin switch and vimentin expression can change on different timescales and through different pathways and that MYO6 knockdown is accompanied by a partial, rather than complete, reversal of the EMT program. Nevertheless, the present marker data do not establish the molecular mechanism linking MYO6 to EMT-related changes. Alternative approaches to studying this hypothesis could include examining additional EMT-related transcription factors and using complementary gain-of-function experiments. In particular, the link between MYO6 and key EMT transcription factors such as Snail, Slug, and ZEB1 remains an open question.
Beyond PCa, the approach described in this study can be extended to other tumor types for the nomination and prioritization of candidate molecules by integrating evidence across independent transcriptomic datasets before experimental validation. Several limitations, however, warrant mention. The discovery phase depends on the quality and comparability of public datasets, and the relaxed intersection criterion (significance in at least four of five GEO datasets) trades specificity for sensitivity; candidates should therefore be confirmed experimentally, as performed here. The experimental validation is based on the PC-3 and DU145 cell lines only; because both are AR-negative, the functional results may not generalize to AR-positive PCa, and animal models and clinical samples are needed for confirmation. In the present study, MYO6 knockdown was confirmed at the protein level by Western blotting but was not independently verified at the mRNA level by RT-qPCR; transcript-level validation of knockdown efficiency should be included in future work. Future studies should also examine MYO6 protein expression in clinical PCa samples, investigate how MYO6 interacts with the AR/FAK axis, evaluate its relationship with EMT-related regulators, and determine whether the observed associations are reproduced in additional experimental models. Thus, the present workflow provides an approach for prioritizing transcriptomically reproducible candidates for focused functional investigation, while further mechanistic and clinical validation is required before MYO6 can be considered for prognostic or therapeutic applications.
الإفصاحات
Author Contributions:
Lei Liang conceived and supervised the study and acquired funding. Ruyue Tian and Weiwei Zhang designed and performed the bioinformatic analyses and cell-based experiments and wrote the first draft of the manuscript; these authors contributed equally. Jiajun Wang and Xuedi Han performed the lentiviral transduction, Western blotting, and image quantification. Ya Sun and Hongying Ma performed the migration, invasion, and proliferation assays and analyzed the data. Lei Liang revised the manuscript. All authors read and approved the final version of the manuscript.
Conflict of Interest:
The authors have no conflicts of interest to disclose
شكر وتقدير
The authors thank The Cancer Genome Atlas, the Gene Expression Omnibus, and the TIMER consortia for providing open-access data and iCell Bioscience Inc. and GenePharma for technical support. This study was supported by the Science Foundation of AMHT (grant numbers 2021YK01 and 2024YK07) and the National Natural Science Foundation of China (grant number 62371010).
المواد
| الاسم | الشركة | رقم فهرسي | التعليقات |
|---|---|---|---|
| 22Rv1 cell line | iCell Bioscience Inc. | iCell-c010 | Human prostate cancer cell line; originally derived from ATCC (CRL-2505) |
| Anti-GAPDH antibody | Proteintech | 60004-1-Ig | Loading control for Western blotting; mouse monoclonal, 1:5000 |
| Anti-MYO6 antibody | Abcam | ab230478 | Primary antibody for Western blotting; rabbit polyclonal, 1:1000 |
| BCA protein assay kit | Thermo Fisher Scientific | 23225 | Protein quantification |
| Cell culture plates, 6-well | Corning (Costar) | 3516 | Lentiviral transduction and wound-healing assay |
| Cell culture plates, 96-well | Corning (Costar) | 3599 | MTS proliferation assay |
| ChemiDoc imaging system | Bio-Rad | ChemiDoc XRS+ | Chemiluminescence imaging |
| clusterProfiler (R package) | Bioconductor | – | GO and KEGG enrichment analysis |
| CO2 incubator | Thermo Fisher Scientific | Heracell 150i | Cell culture at 37 °C with 5% CO2 |
| Crystal violet | Sigma-Aldrich | C0775 | Staining in colony-formation (1%) and invasion (0.1%) assays |
| Cytoscape | Cytoscape Consortium | – | PPI network visualization |
| DU145 cell line | iCell Bioscience Inc. | iCell-c011 | Human prostate cancer cell line; originally derived from ATCC (HTB-81) |
| ECL chemiluminescence substrate | Thermo Fisher Scientific (Pierce) | 32106 | Western blot signal detection |
| edgeR (R package) | Bioconductor | – | Differential expression analysis of TCGA-PRAD RNA-seq data |
| EMT Antibody Sampler Kit | Cell Signaling Technology | 9782T | Claudin-1, N-cadherin, E-cadherin, and Vimentin antibodies for Western blotting; rabbit monoclonal, 1:1000 each |
| Fetal bovine serum (FBS) | Corning | 35-079-CV | Medium supplement |
| Gene Expression Omnibus (GEO) | National Center for Biotechnology Information | – | Source of GSE21034, GSE89194, GSE70770, GSE60329, and GSE6919 |
| GEPIA2 | Peking University | – | Tumor-versus-normal expression validation |
| ggplot2 (R package) | CRAN | – | Visualization of enrichment results |
| gplots (R package) | CRAN | – | Volcano plots |
| GraphPad Prism 9 | GraphPad Software | – | Statistical analysis and graphing |
| Ham’s F-12K medium | iCell Bioscience Inc. | iCell-0007 | Culture medium for PC-3 |
| HRP-conjugated secondary antibodies | Cell Signaling Technology | 7074 (anti-rabbit); 7076 (anti-mouse) | Secondary antibodies for Western blotting; 1:2000 each |
| ImageJ | National Institutes of Health | – | Image quantification |
| limma (R package) | Bioconductor | – | Differential expression analysis of GEO microarray data |
| Matrigel | Corning | 354234 | Coating for invasion assay |
| Methanol, anhydrous | Sigma-Aldrich | 322415 | Fixation of invasion-assay membranes |
| Microplate reader | BioTek (Agilent) | Synergy H1 | Absorbance measurement at 490 nm for MTS assay |
| Microscope, inverted, with camera | Olympus | IX73 | Imaging of wound-healing and invasion assays |
| Minimum Essential Medium (MEM) | iCell Bioscience Inc. | iCell-0012 | Culture medium for DU145 |
| MTS reagent (CellTiter 96 AQueous One Solution) | Promega | G3580 | Proliferation assay |
| Mycoplasma detection kit | Beyotime | C0301S | Routine mycoplasma testing of cell lines |
| Non-fat milk powder | BD Difco | 232100 | Membrane blocking; 5% in TBST |
| Paraformaldehyde | Beyotime | P0099 | Fixation in colony-formation assay; 4% |
| PC-3 cell line | iCell Bioscience Inc. | iCell-c012 | Human prostate cancer cell line; originally derived from ATCC (CRL-1435) |
| Phosphate-buffered saline (PBS) | Beyotime | ST476 | Cell washing |
| Phosphatase-inhibitor cocktail | Beyotime | P1082 | Protein extraction |
| Pipette tips, 200 μL, sterile | Axygen | T-200-C-R-S | Wound creation in scratch/wound-healing assay |
| Polybrene | Sigma-Aldrich | TR-1003-G | Enhancement of lentiviral transduction; 5 μg/mL |
| Protease-inhibitor cocktail | Beyotime | P1045 | Protein extraction |
| Puromycin | InvivoGen | ant-pr-1 | Selection of transduced cells; 2 μg/mL |
| PVDF membrane | Merck Millipore | IPVH00010 | Protein transfer for Western blotting |
| R software (v4.1.3) | R Foundation | – | Bioinformatics analysis |
| RIPA lysis buffer | Beyotime | P0013B | Protein extraction |
| RPMI-1640 medium | iCell Bioscience Inc. | iCell-0002 | Culture medium for 22Rv1 |
| SDS-PAGE gel preparation kit | Beyotime | P0012AC | Preparation of 10% separating gels |
| sh-MYO6/LV3-NC lentivirus | GenePharma | Custom-made (not applicable) | MYO6 knockdown and negative control; target sequences selected by GenePharma (LV3-NC, 5′-TTCTCCGAACGTGTCACGT-3′; sh-MYO6, 5′-GCAGTCGATTTGGGAAATTTG-3′) |
| STRING database (v11.5) | STRING Consortium | – | PPI network construction |
| survival (R package) | CRAN | – | Kaplan–Meier and log-rank survival analysis |
| TBST buffer | Beyotime | ST673 | Antibody dilution and membrane washing |
| TCGA-PRAD dataset (The Cancer Genome Atlas) | National Cancer Institute, Genomic Data Commons | – | RNA-seq and clinical data |
| TIMER | Liu Lab, Dana-Farber Cancer Institute | – | Prognostic validation |
| Transwell chambers, 8-μm pore | Corning | 3422 | Invasion assay |
| Venn diagram web tool | Bioinformatics & Evolutionary Genomics, Ghent University/VIB | – | Visualization of DEG overlap |
| WGCNA (R package) | CRAN | – | Weighted gene co-expression network analysis |
المراجع
- Bray F et al. Global cancer statistics 2022: GLOBOCAN estimates of incidence and mortality worldwide for 36 cancers in 185 countries. CA Cancer J Clin. 2024;74(3):229-263. doi:10.3322/caac.21834.
- Kratzer TB et al. Prostate cancer statistics, 2025. CA Cancer J Clin. 2025;75(6):485-497. doi:10.3322/caac.70028.
- Siegel RL, Giaquinto AN, Jemal A. Cancer statistics, 2024. CA Cancer J Clin. 2024;74(1):12-49. doi:10.3322/caac.21820.
- Cancer Genome Atlas Research Network et al. The Cancer Genome Atlas Pan-Cancer analysis project. Nat Genet. 2013;45(10):1113-1120. doi:10.1038/ng.2764.
- Edgar R, Domrachev M, Lash AE. Gene Expression Omnibus: NCBI gene expression and hybridization array data repository. Nucleic Acids Res. 2002;30(1):207-210. doi:10.1093/nar/30.1.207.
- Barrett T et al. NCBI GEO: archive for functional genomics data sets—update. Nucleic Acids Res. 2013;41(D1):D991-D995. doi:10.1093/nar/gks1193.
- Robinson MD, McCarthy DJ, Smyth GK. edgeR: a Bioconductor package for differential expression analysis of digital gene expression data. Bioinformatics. 2010;26(1):139-140. doi:10.1093/bioinformatics/btp616.
- Ritchie ME et al. limma powers differential expression analyses for RNA-sequencing and microarray studies. Nucleic Acids Res. 2015;43(7):e47. doi:10.1093/nar/gkv007.
- Ashburner M et al. Gene Ontology: tool for the unification of biology. Nat Genet. 2000;25(1):25-29. doi:10.1038/75556.
- Kanehisa M, Goto S. KEGG: Kyoto Encyclopedia of Genes and Genomes. Nucleic Acids Res. 2000;28(1):27-30. doi:10.1093/nar/28.1.27.
- Yu G, Wang LG, Han Y, He QY. clusterProfiler: an R package for comparing biological themes among gene clusters. OMICS. 2012;16(5):284-287. doi:10.1089/omi.2011.0118.
- Szklarczyk D et al. The STRING database in 2023: protein–protein association networks and functional enrichment analyses for any sequenced genome of interest. Nucleic Acids Res. 2023;51(D1):D638-D646. doi:10.1093/nar/gkac1000.
- Shannon P et al. Cytoscape: a software environment for integrated models of biomolecular interaction networks. Genome Res. 2003;13(11):2498-2504. doi:10.1101/gr.1239303.
- Langfelder P, Horvath S. WGCNA: an R package for weighted correlation network analysis. BMC Bioinformatics. 2008;9:559. doi:10.1186/1471-2105-9-559.
- Tang Z, Kang B, Li C, Chen T, Zhang Z. GEPIA2: an enhanced web server for large-scale expression profiling and interactive analysis. Nucleic Acids Res. 2019;47(W1):W556-W560. doi:10.1093/nar/gkz430.
- Li T et al. TIMER: a web server for comprehensive analysis of tumor-infiltrating immune cells. Cancer Res. 2017;77(21):e108-e110. doi:10.1158/0008-5472.CAN-17-0307.
- Schneider CA, Rasband WS, Eliceiri KW. NIH Image to ImageJ: 25 years of image analysis. Nat Methods. 2012;9(7):671-675. doi:10.1038/nmeth.2089.
- Dunn TA et al. A novel role of myosin VI in human prostate cancer. Am J Pathol. 2006;169(5):1843-1854. doi:10.2353/ajpath.2006.060316.
- Yoshida H et al. Lessons from border cell migration in the Drosophila ovary: a role for myosin VI in dissemination of human ovarian cancer. Proc Natl Acad Sci U S A. 2004;101(21):8144-8149. doi:10.1073/pnas.0400400101.
- Wang D et al. MYO6 knockdown inhibits the growth and induces the apoptosis of prostate cancer cells by decreasing the phosphorylation of ERK1/2 and PRAS40. Oncol Rep. 2016;36(3):1285-1292. doi:10.3892/or.2016.4910.
- Zheng S et al. MYO6 contributes to tumor progression and enzalutamide resistance in castration-resistant prostate cancer by activating the focal adhesion signaling pathway. Cell Commun Signal. 2024;22(1):517. doi:10.1186/s12964-024-01897-z.
- Giese A et al. Dichotomy of astrocytoma migration and proliferation. Int J Cancer. 1996;67(2):275-282. doi:10.1002/(SICI)1097-0215(19960717)67:2<275::AID-IJC20>3.0.CO;2-9.
- Hatzikirou H, Basanta D, Simon M, Schaller K, Deutsch A. “Go or grow”: the key to the emergence of invasion in tumour progression? Math Med Biol. 2012;29(1):49-65. doi:10.1093/imammb/dqq011.
- Garay T et al. Cell migration or cytokinesis and proliferation?—revisiting the “go or grow” hypothesis in cancer cells in vitro. Exp Cell Res. 2013;319(20):3094-3103. doi:10.1016/j.yexcr.2013.08.018.
- Jolly MK et al. Implications of the hybrid epithelial/mesenchymal phenotype in metastasis. Front Oncol. 2015;5:155. doi:10.3389/fonc.2015.00155.
- Yang J et al. Guidelines and definitions for research on epithelial–mesenchymal transition. Nat Rev Mol Cell Biol. 2020;21(6):341-352. doi:10.1038/s41580-020-0237-9.
- Kolijn K, Verhoef EI, van Leenders GJLH. Morphological and immunohistochemical identification of epithelial-to-mesenchymal transition in clinical prostate cancer. Oncotarget. 2015;6(27):24488-24498. doi:10.18632/oncotarget.4177.
- Strouhalová K et al. Vimentin intermediate filaments as potential target for cancer treatment. Cancers (Basel). 2020;12(1):184. doi:10.3390/cancers12010184.
- Virtakoivu R et al. Vimentin–ERK signaling uncouples Slug gene regulatory function. Cancer Res. 2015;75(12):2349-2362. doi:10.1158/0008-5472.CAN-14-2842.