تدمج منصة أتمتة قبول الجهد المنخفض المقترحة بين إنترنت الأشياء (IoT)، وتنسيق سير العمل المرئي، وحوسبة الحافة والسحابة، وهندسة الميزات، والتعلم الآلي لأتمتة اختبارات قبول أنظمة الجهد المنخفض (LV). وتتيح هذه المنصة الكشف الذكي عن الأعطال، واتخاذ القرارات في الوقت الفعلي، والقبول المؤتمت، مع ضمان دقة عالية، وزمن استجابة تشغيلي منخفض، وإمكانية نشر قابلة للتوسع.
يتطلب اشتراك JoVE لعرض هذا المحتوى. تسجيل الدخول أو ابدأ نسخة تجريبية مجانية
مقالة بحثية
منصة أتمتة لقبول الجهد المنخفض مدفوعة بالعمليات مع تنسيق مرئي لسير العمل والتحقق باستخدام تعلم الآلة
في هذه المقالة
ملخص
الملخص
يتطلب التوسع السريع في شبكات الجهد المنخفض (LV) وتكاملها مع موارد الطاقة الموزعة حلول إدارة ذكية ومؤتمتة. وتدعم منصات إنترنت الأشياء (IoT) التعاونية بين السحابة والحافة عمليات المراقبة والتحكم واقتناء البيانات في الوقت الفعلي. ومع ذلك، تفتقر المنصات الحالية عموماً إلى أتمتة تدفقات العمل، والتنسيق المرئي للعمليات، ودعم اتخاذ القرار الموجه للمستخدم، والتحقق الشامل. وبناءً على ذلك، فهي لا توفر حلولاً قائمة على العمليات لاختبارات قبول شبكات الجهد المنخفض المؤتمتة. تقدم هذه الدراسة تصميم وتقييم منصة أتمتة قبول الجهد المنخفض استناداً إلى لوحة عمليات مرئية. وتعتمد المنصة المقترحة بنية قائمة على العمليات، حيث يتم إنشاء تدفقات عمل القبول وإدارتها وتنفيذها بصرياً. وتعمل لوحة العمليات المرئية على تحويل المراقبة الساكنة التقليدية إلى أتمتة ديناميكية لتدفقات العمل من خلال تمكين تنفيذ تدفقات العمل والتحقق منها واتخاذ القرارات في الوقت الفعلي. ويتضمن الإطار شبكة Open LV Network &؛ مجموعة بيانات العدادات الذكية لدعم النمذجة الواقعية لسلوك الحمل الكهربائي. يتضمن سير العمل الحصول على البيانات استناداً إلى إنترنت الأشياء (IoT)، والمعالجة المسبقة للبيانات، وهندسة الميزات، وتنسيق سير العمل باستخدام لوحة العمليات المرئية، والتحقق من الصحة استناداً إلى تعلم الآلة، وتصور البيانات عبر لوحة تحكم في الوقت الفعلي. حقق الإطار المقترح معدل كشف عن الأعطال بنسبة 98.4%، ومساحة تحت المنحنى لخاصية تشغيل المستقبل (ROC-AUC) بلغت 0.968، وزمن وصول لاتخاذ القرار التشغيلي قدره 31 مللي ثانية، متفوقاً بذلك على النهج الأساسية التقليدية المرتكزة على السحابة وتلك القائمة على إنترنت الأشياء بنسبة تتراوح بين 30% و40% تقريباً.
المقدمة
تتحقق الثورة الصناعية الرابعة (Industry 4.0)1 من خلال عدة تقنيات ناشئة، ويعد إنترنت الأشياء الصناعي (IIoT) أحد أهم هذه التقنيات. يشير إنترنت الأشياء الصناعي إلى تطبيق تقنيات إنترنت الأشياء (IoT) في البيئات الصناعية، حيث تتواصل الأجهزة والآلات المترابطة بشكل أساسي من خلال تفاعلات من آلة إلى آلة. ونظراً لأن الإخفاقات في الأنظمة الصناعية قد تؤدي إلى خسائر تشغيلية كبيرة، فإن تطبيقات إنترنت الأشياء الصناعي تتطلب اتصالات عالية الموثوقية بينما تولد أحجاماً من البيانات أكبر بكثير من أنظمة إنترنت الأشياء التقليدية2. بالإضافة إلى ذلك، تعتبر بعض الدراسات إنترنت الأشياء الصناعي مفهوماً مرتبطاً ارتباطاً وثيقاً بالثورة الصناعية الرابعة3. وتعمل تقنيات إنترنت الأشياء على تحويل البنيات الهرمية التقليدية من خلال تمكين أنظمة أكثر مرونة مع تبادل سلس للبيانات4. وقد قامت العديد من الدراسات الحديثة بمراجعة بنيات إنترنت الأشياء الصناعي الحالية واقترحت تصميمات لأطر عمل جديدة5,6,7,8,9. ورغم هذه التطورات، لا يزال هناك محددان رئيسيان؛ أولاً، يتم اقتراح أطر عمل جديدة بشكل متكرر للتغلب على قصور البنيات السابقة، مما يؤدي إلى زيادة عدد النماذج البديلة التي تزيد من التنوع البنيوي وتعقيد التنفيذ. ثانياً، فإن المستوى العالي من التجريد المرتبط بالعديد من البنيات المقترحة يحد من تبنيها العملي في البيئات الصناعية10.
تم الإبلاغ عن العديد من بنيات إنترنت الأشياء الصناعية (IIoT) في الدراسات السابقة. حيث عُرضت بنية IIoT تعتمد على معيار اتصالات المنصة المفتوحة (OPC) بالتزامن مع برمجية وسيطة بلغة Python لإدارة اتصالات OPC11. كما اقتُرحت بنية IIoT مكونة من سبع طبقات؛ ومع ذلك، لم يتم تقديم تفاصيل التنفيذ وتجارب التحقق12. ووُصف إطار عمل يدمج تقنيات الجيل الخامس (5G) وIIoT مع حالة استخدام نموذجية، على الرغم من محدودية التحقق التجريبي13. كما قُدم إطار تصميم عاطفي للصناعة 4.0، ونُوقشت تداعياته المحتملة دون تحقق تجريبي14. وفي دراسة أخرى، تم تقييم منصة IIoT متعددة الطبقات في بيئة اختبار واقعية، مع التركيز على اعتبارات الاتصالات السلكية واللاسلكية15. وبالمثل، عُرض إطار عمل نمطي لإنترنت الأشياء (IoT) لمراقبة جودة الهواء الداخلي وتم تقييم أدائه باستخدام بيانات جُمعت من 84 منزلاً بها أطفال16.
أصبحت إنترنت الأشياء (IoT) تقنية تتطور بسرعة ولديها إمكانات كبيرة للتطبيق في قطاع الطاقة الكهربائية17,18. إن دمج تقنيات إنترنت الأشياء في عقد نظام الطاقة يتيح توليداً ونقلاً وتوزيعاً وتشغيلاً واستخداماً للطاقة بشكل أكثر ذكاءً وكفاءة، وذلك من خلال اتخاذ قرارات ذاتية مدعومة بالمراقبة المستمرة والآنية لتدفق الكهرباء داخل الشبكة الذكية. ونتيجة لذلك، تعمل هذه العقد الذكية على تحسين الأداء التشغيلي العام للشبكة الكهربائية19. وتمثل تكنولوجيا الاتصالات مكوناً أساسياً في تنفيذ الشبكة الذكية نظراً لضرورة نقل فئتين رئيستين من المعلومات بموثوقية: قياسات المستشعرات وإشارات التحكم. وبالإضافة إلى انخفاض زمن انتقال الاتصالات، تتطلب تطبيقات الشبكة الذكية جودة خدمة (QoS) مناسبة وأمناً كافياً للبيانات لضمان التشغيل الموثوق20.
يتطلب اختيار تقنية اتصال مناسبة لتطبيقات الشبكات الذكية مراعاة فترات الاتصال، ومعدلات نقل البيانات، وتكاليف الاتصال21. وتتكون شبكات اتصال إنترنت الأشياء (IoT) عادةً من طبقات البرمجيات، والأمن، والخدمة، والنظام، والاتصال. وضمن طبقة الاتصال، تُصنف بروتوكولات الاتصال عمومًا إلى ثلاث فئات؛ تشمل البروتوكولات بعيدة المدى LoRa و Narrowband-IoT (NB-IoT)، وتشمل البروتوكولات متوسطة المدى Wi-Fi و 4G/LTE و 5G، بينما تشمل البروتوكولات قصيرة المدى Bluetooth و ZigBee. ومع تزايد تحرير أسواق الكهرباء، اكتسب التنبؤ بالأحمال أهمية أكبر لتقييم آثار الظروف الجوية، وأعطال المعدات، والتغييرات التنظيمية، وغيرها من العوامل التشغيلية على تكلفة خدمات الكهرباء. وبناءً على ذلك، أصبح التنبؤ الدقيق بالأحمال السكنية أمرًا ضروريًا لتشغيل والإشراف على الشبكات الذكية، والشبكات الصغيرة، والمباني الذكية22.
يعتمد التشغيل الموثوق لشبكات الجهد المنخفض (LV) على الحفاظ على جودة عالية للطاقة23. وتتحدد جودة الطاقة بمدى فعالية تنظيم الجهد، وتوازن التيار، والحد من الاضطرابات التقنية في ظل ظروف التشغيل غير المتوازنة24. ومن بين هذه العوامل، يكتسب توازن الأطوار أهمية خاصة لأنه يحدد التوزيع الموحد للجهود والتيارات عبر الأطوار25. وقد يؤدي ضعف توازن الأطوار إلى زيادة تسخين الموصلات، وانحرافات الجهد، وتيارات النقطة المحايدة، مما يقلل من كفاءة النظام وموثوقية التشغيل26. وبناءً على ذلك، يجب مراعاة توازن الأطوار أثناء عملية التصميم لتحسين أداء النظام، واستقراره التشغيلي، وموثوقيته على المدى الطويل. ومع ذلك، نادراً ما يتم دمج هذا الجانب في منهجيات تصميم الشبكات الصغيرة التقليدية.
أظهرت التطورات الحديثة في أنظمة تنظيم سير العمل فوائد الأتمتة القائمة على الأحداث والإدارة المرئية للعمليات ضمن بيئات إنترنت الأشياء الصناعية. ومع ذلك، لا يزال تطبيقها في التحقق من صحة شبكات التوزيع واختبارات القبول للجهد المنخفض محدوداً. تركز معظم أنظمة أتمتة الجهد المنخفض الحالية بشكل أساسي على المراقبة والتحكم الإشرافي، بينما تبحث دراسات قليلة نسبياً في إدارة القبول الموجهة بسير العمل أو التحقق المؤتمت من الامتثال. وبالمثل، على الرغم من أن تقنيات تعلم الآلة قد حظيت باهتمام كبير في اكتشاف الشذوذ في العدادات الذكية وتقييم جودة الطاقة، إلا أن هذه النهج يتم تطويرها عموماً كنماذج تحليلية مستقلة بدلاً من كونها مكونات في إطار عمل متكامل لتنظيم سير العمل.
تم اقتراح حلول متنوعة لعدادات الطاقة الذكية لإدارة المباني الذكية وأتمتة المنازل في السنوات الأخيرة27. وقد عُرض نموذج أولي لعداد ذكي في المرجع27 لتوضيح كيفية دمج المفاهيم التعليمية على المستوى الجامعي في تقنيات القياس الذكي. وأظهر العداد الذكي المطور إمكانات كبيرة في إدارة الطاقة والتحكم بها، مما أدى إلى تقليل استهلاك الطاقة وتحقيق الفائدة لكل من شركات المرافق والمستهلكين من خلال اتصالات إنترنت الأشياء (IoT) ثنائية الاتجاه. وعقب ذلك، تم تقديم نظام مقبس ذكي يعتمد على المتحكم الدقيق لدعم المراقبة الذكية للطاقة28.
يعرض نظام المقبس الذكي المقترح استهلاك الطاقة في الوقت الفعلي من خلال واجهة مستخدم رسومية تعتمد على نظام Android. بالإضافة إلى ذلك، يمكن للجهاز اكتشاف وجود الأجهزة الكهربائية المتصلة، وهي قدرة يُشار إليها باسم قياس الحمل الاجتياحي (invasive load measurement)28. وقد استُخدم مقبس ذكي تجاري منخفض التكلفة في التنفيذ. وتشمل التحسينات المستقبلية مراقبة تيار جذر متوسط المربعات (RMS)، والقدرة الحقيقية، والقدرة التفاعلية، وزاوية الطور بين الجهد والتيار. وكما هو موضح في دراساتنا السابقة، تستخدم شبكة صغرى كهروضوئية متصلة جزئياً بالشبكة بروتوكولات اتصال ZigBee وLoRa لتبادل المعلومات مع أجهزة العدادات الذكية، مما يثبت جدوى الاتصالات الممكنة عبر إنترنت الأشياء (IoT) لأنظمة الطاقة الموزعة29,30.
لمعالجة القصور في التخطيط التقليدي لأنظمة التوزيع، تقدمت الممارسات الهندسية والبحوث العلمية في عدة اتجاهات متكاملة. فقد ركز أحد الاتجاهات البحثية على التخطيط رفيع المستوى باستخدام نظم المعلومات الجغرافية (GIS) لاختيار المواقع والتقييم الأولي للموارد31,32. بينما ركز اتجاه آخر على تحسين المكونات والأنظمة الفرعية الفردية، بما في ذلك اختيار الموصلات، والتحديد الأمثل لأحجام التوليد وتخزين الطاقة، والتقييمات المقارنة لأنظمة توزيع التيار المتردد (AC) والتيار المستمر (DC)33,34,35,36. وطبق اتجاه بحثي ثالث خوارزميات الأمثلة على تخطيط شبكة التوزيع، وتوجيه المغذيات، وتصميم طبولوجيا الشبكة. وتشمل التطورات الحديثة أطراً عمليّة مثل منصة uGrid الخاصة بالباحثين، والتي تدمج توزيع الأجهزة وتهيئة الشبكة ولكنها تفتقر إلى تحليل قياسي لتدفق الطاقة لأغراض التحقق والأمثلة. وتعتمد مناهج أخرى على الضبط اليدوي للمعاملات لتوليد الطبولوجيا أو تركز على تطبيقات متخصصة مثل الشبكات الدقيقة للتيار المستمر منخفضة القدرة37,38,39. ورغم أن هذه المناهج تمثل تقدماً ملموساً، إلا أن هناك حاجة إلى مزيد من العمل لإرساء منهجية متكاملة للتصميم الشامل لأنظمة التوزيع ذات الجهد المنخفض. علاوة على ذلك، لا تزال التقييمات التقنية-الاقتصادية الشاملة لأنظمة الجهد المنخفض أحادية الطور وثلاثية الطور والهجينة محدودة.
ساهمت التطورات الأخيرة في الذكاء الاصطناعي (AI) وتعلم الآلة في توسيع قدرات أنظمة الطاقة الذكية بشكل أكبر. وقد قدمت مراجعة شاملة ملخصاً لتطبيقات الذكاء الاصطناعي وتعلم الآلة في الشبكات الذكية، بما في ذلك التقنيات الناشئة مثل التعلم الاتحادي (Federated Learning)، والذكاء الاصطناعي التوليدي (Generative AI)، والنماذج اللغوية الكبيرة (Large Language Models)، والذكاء الاصطناعي للأشياء (AIoT)، والتوائم الرقمية (Digital Twins)40. وسلطت المراجعة الضوء على التطبيقات في مجالات التنبؤ بالأحمال، والصيانة التنبؤية، وكشف الشذوذ، وإدارة جانب الطلب، ودمج المركبات الكهربائية، مع التأكيد على التحديات المستمرة المتعلقة بالتوافق التشغيلي، والخصوصية، وقابلية التوسع، والمتانة، والاعتبارات الأخلاقية. كما قيمت مراجعة حديثة أخرى طرق الذكاء الاصطناعي لإدارة الطاقة الموزعة في البنى التحتية القائمة على الحوسبة الحافية والسحابية وإنترنت الأشياء (IoT-edge-cloud)، مع التركيز على تعلم الآلة، والتعلم التعزيزي، والأنظمة متعددة الوكلاء للتحكم اللامركزي في الطاقة41.
لقد ساهمت الدراسات السابقة مجتمعة في تطوير المراقبة المعتمدة على إنترنت الأشياء (IoT)، والقياس الذكي، وحوسبة السحابة والحافة، والذكاء الاصطناعي، والإدارة الذكية للطاقة لأنظمة التوزيع ذات الجهد المنخفض (LV). ومع ذلك، فقد تم تطوير هذه التقنيات بشكل مستقل إلى حد كبير؛ حيث لا يزال تنسيق سير العمل، والإدارة المؤتمتة للقبول، والتحقق القائم على العمليات، ودعم القرار المتكامل محدودة، مما يسلط الضوء على الحاجة إلى إطار عمل مؤتمت وموحد موجه نحو سير العمل.
بناءً على ذلك، تقدم هذه الدراسة منصة أتمتة لقبول الجهد المنخفض تعتمد على لوحة عمليات مرئية. يدمج الإطار المقترح بين الحصول على البيانات القائم على إنترنت الأشياء (IoT)، والمعالجة المسبقة للبيانات، وهندسة الميزات، وتنسيق سير العمل، والتحقق القائم على تعلم الآلة، والحوسبة السحابية والحافة، والتصور في الوقت الفعلي ضمن بنية موحدة لدعم اختبارات قبول شبكات الجهد المنخفض (LV) بشكل مؤتمت وموثوق باستخدام بيانات العدادات الذكية من العالم الحقيقي. يوفر الشكل 1 نظرة عامة على البنية الموجهة لسير العمل في المنصة المقترحة. يتكون سير العمل من الحصول على البيانات، والمعالجة المسبقة، وهندسة الميزات، وتنسيق سير العمل، واتخاذ القرار الذكي، والتكامل السحابي والحافة، مما يتيح التحقق المؤتمت من شبكات توزيع الجهد المنخفض من خلال إطار عمل موجه للعمليات. وقد أظهرت المنصة دقة تحقق عالية مع تقليل زمن انتقال القرارات التشغيلية ووقت تنفيذ سير العمل مقارنة بالأساليب التقليدية.
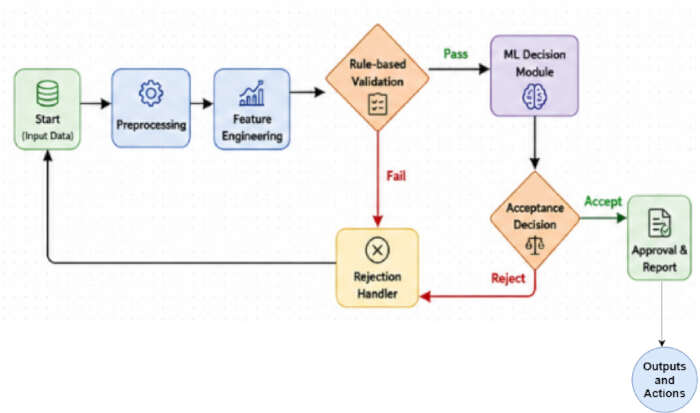
الشكل 1. البنية الموجهة بسير العمل لمنصة أتمتة قبول الجهد المنخفض المقترحة. بنية رفيعة المستوى لمنصة أتمتة قبول الجهد المنخفض (LV) المقترحة والقائمة على العمليات. يوضح الإطار التكامل التسلسلي لجمع البيانات الممكنة بواسطة IoT، والمعالجة المسبقة للبيانات، وهندسة الميزات، وتنسيق سير العمل، واتخاذ القرار الذكي، والتعاون بين السحابة والحافة، والقبول المؤتمت للتحقق من شبكة توزيع الجهد المنخفض. IoT = إنترنت الأشياء؛ LV = جهد منخفض؛ ML = تعلم الآلة. يرجى النقر هنا لعرض نسخة أكبر من هذا الشكل.
الوصول مقيد. يرجى تسجيل الدخول أو بدء فترة تجريبية لعرض هذا المحتوى.
البروتوكول
This study did not involve human participants, animals, or identifiable personal data. The analyses were performed using a publicly available dataset (UK Power Networks Open LV Network & Smart Meter dataset) together with synthetically generated data for validation; therefore, ethics committee approval and informed consent were not required. The research tools used in the protocol are listed in the Table of Materials.
1. Data acquisition
The Low-Voltage (LV) Acceptance Automation Platform was developed using electrical measurements acquired from smart meters, IoT sensors, and the Open LV Network & Smart Meter Dataset. Electrical parameters, including voltage, current, active power, reactive power, and energy consumption, were collected through Wi-Fi-, PLC-, and RS-485-based communication protocols. Real-time measurements were used for live system monitoring, whereas historical data supported model development and validation.
The proposed framework used the Open LV Network & Smart Meter Dataset provided by UK Power Networks42. The dataset comprises household smart meter consumption, feeder-level load profiles, and feeder voltage measurements. Time-series subsets containing load consumption and voltage data were selected for model training and evaluation. In addition, a simulated smart meter dataset was generated to represent operational conditions and fault scenarios required for workflow validation and machine learning model evaluation. The simulated dataset included timestamped measurements of voltage, current, active power, reactive power, energy consumption, total harmonic distortion (THD), and voltage imbalance. Fault samples were generated by simulating undervoltage, overvoltage, excessive harmonic distortion, and voltage imbalance based on established low-voltage operational thresholds. The dataset characteristics are summarized in Table 1.
| Attribute | Description |
| Dataset Name | Open LV Network & Smart Meter Dataset |
| Simulated Smart Meter Dataset | Geneated 1000 smaples for Fault simulation and workflow validation |
| Data Type | Time-series (historical smart meter data) |
| Data Granularity | Household-level and feeder-level measurements |
| Key Features | Voltage, current, active power, reactive power, energy consumption, timestamps |
| Data Frequency | High-resolution (e.g., half-hourly / minute-level depending on subset) |
| Coverage | Residential low-voltage distribution networks |
| Usage in Proposed Work | Model training, validation, load behavior analysis, and acceptance workflow evaluation |
Table 1: Dataset description. Summary of the Open LV Network & Smart Meter dataset used for model development and performance evaluation. The table presents the dataset components, measured electrical variables, sampling characteristics, and dataset partitioning for training, validation, and testing.
Because the Open LV Network & Smart Meter Dataset does not contain predefined fault labels, a rule-based labeling strategy was applied to both the real and simulated datasets. Samples satisfying normal operating limits were assigned a label of 0 (Normal), whereas samples exceeding operational thresholds (e.g., voltage deviations greater than ±10% of the nominal voltage, THD > 5%, or voltage unbalance > 2%) were assigned a label of 1 (Fault). These labels served as the ground truth during model training, validation, and testing. The proposed rule engine also allows threshold values to be configured in accordance with regional standards or utility-specific acceptance criteria.
The dataset was partitioned into training (70%), validation (15%), and testing (15%) subsets. Missing values were addressed using linear interpolation, mean imputation, and forward-fill techniques as described in the preprocessing stage. To ensure statistical robustness and reproducibility, all experiments were repeated five times using different random seeds.
2. Data preprocessing
Raw data from the Open LV Network & Smart Meter Dataset and IoT sensor measurements were preprocessed to improve data quality prior to feature extraction and model development. Missing values, noise, and inconsistencies caused by communication interruptions and sensor malfunctions were identified and corrected using interpolation, mean imputation, and forward-fill techniques. The detailed mathematical derivations are provided in Supplementary File 1 (Section S1).
The preprocessed time-series data were segmented into representative operational intervals (S₁–S₅ and Sk). Statistical and electrical features, including average load, peak load, minimum load, standard deviation, voltage deviation, and power consumption, were extracted from each segment. The extracted features are summarized in Table 2 and served as inputs for the subsequent feature engineering stage.
| Segment ID | Mean Load (kW) | Peak Load (kW) | Min Load (kW) | Std Deviation (kW) | Voltage Deviation (p.u.) | Power Consumption (kWh) | Time Interval |
| S₁ | 2.45 | 3.8 | 1.2 | 0.65 | 0.032 | 58.4 | 00:00–01:00 |
| S₂ | 2.9 | 4.1 | 1.5 | 0.72 | 0.028 | 64.2 | 01:00–02:00 |
| S₃ | 3.25 | 4.85 | 1.8 | 0.81 | 0.035 | 71.6 | 02:00–03:00 |
| S₄ | 3.8 | 5.2 | 2.1 | 0.9 | 0.041 | 78.9 | 03:00–04:00 |
| S₅ | 4.1 | 5.75 | 2.4 | 0.95 | 0.045 | 85.3 | 04:00–05:00 |
| Sk | 3.6 | 5.1 | 2 | 0.88 | 0.038 | 76.5 | tk |
Table 2: Representative feature representation extracted from time-series segments. Representative statistical, electrical, load behavior, voltage stability, and power quality features extracted from segmented LV time-series data during feature engineering. The values illustrate the engineered feature representation and are not experimental performance results. LF = Load Factor; PAR = Peak-to-Average Ratio; VSI = Voltage Stability Index; PF = Power Factor; THD = Total Harmonic Distortion.
3. Feature engineering
Feature engineering was performed to improve the representation of the preprocessed data for workflow orchestration and intelligent decision-making. Principal Component Analysis (PCA)^43 was applied to reduce data dimensionality by removing redundant and highly correlated variables while retaining the most informative feature components. The mathematical derivations are provided in Supplementary File 1 (Section S2).
Statistical descriptors, load behavior indicators, voltage stability indices, and power quality metrics were derived from the segmented time-series data. These engineered features included Load Factor (LF), Peak-to-Average Ratio (PAR), Voltage Stability Index (VSI), Voltage Unbalance Index, Power Factor (PF), and Total Harmonic Distortion (THD). The resulting feature set was used as the input to the workflow orchestration and intelligent decision-making modules.
The feature engineering workflow is summarized in Supplementary File 1 (Supplementary Algorithm 1). The procedure consisted of segmenting the preprocessed data, extracting statistical and electrical features, calculating load behavior, voltage stability, and power quality indicators, and applying PCA to generate the final feature vector used for model training and validation.
4. Visualized process canvas design
The Visualized Process Canvas was developed as a graph-based workflow orchestration framework for automating low-voltage (LV) acceptance procedures. The workflow was represented as a directed graph, G = (N, E), where N = {n1, n2, …, nm}denotes the workflow nodes corresponding to individual processing stages (e.g., data input, preprocessing, validation, and decision-making), and E = {eij}represents the directed edges defining the execution sequence between nodes. This graph-based representation enabled the creation of configurable workflows and their automated execution without manual coding.
Each workflow node performed a specific processing task by receiving input data, executing predefined operations, and forwarding the processed output to subsequent nodes. Acceptance criteria, including voltage and load thresholds, were implemented as configurable validation rules that could be updated without modifying the workflow structure. The workflow supported both sequential and parallel execution to improve computational efficiency. Machine learning models were integrated into designated workflow nodes to perform anomaly detection and automated acceptance validation (Figure 2).
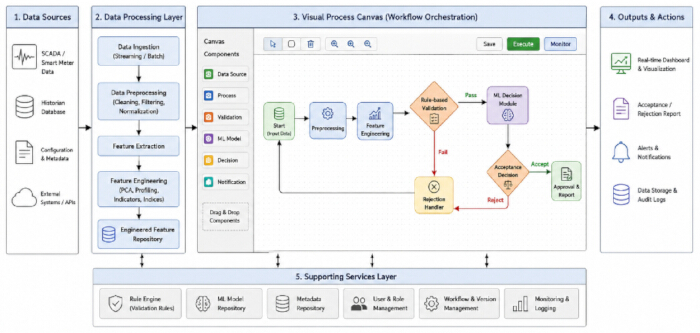
Figure 2: Visualized process canvas architecture for LV acceptance automation. Overview of the visual workflow orchestration framework used for LV acceptance automation. The process canvas illustrates the graphical organization of workflow nodes for data processing, feature engineering, rule-based validation, intelligent decision-making, and output generation to support workflow design, execution, and monitoring. Please click here to view a larger version of this figure.
The mathematical formulation describing information flow through the workflow graph is provided in Supplementary File 1 (Section S3). Supplementary File 1 (Supplementary Algorithm 2) describes the workflow orchestration procedure, including workflow traversal, node execution, rule validation, decision generation, and output aggregation.
The Visualized Process Canvas was implemented using a microservice-oriented software architecture to support scalability and modular deployment. The graphical workflow interface was developed using React.js to provide drag-and-drop workflow configuration. Backend orchestration services were implemented using Flask/FastAPI, while Eclipse Mosquitto served as the MQTT message broker for communication between workflow modules. EdgeX Foundry provided edge device management and IoT integration. Machine learning services were implemented with Scikit-learn, TensorFlow, and PyTorch, and containerized with Docker and Kubernetes.
5. Workflow orchestration engine
The workflow orchestration engine coordinated execution of the configured acceptance workflow. A detailed description is provided in Supplementary File 1 (Section S4), and the execution sequence is summarized in Supplementary Figure 1.
The workflow execution process consisted of validating the workflow definition, initializing the execution environment, scheduling workflow nodes according to their dependencies, executing nodes sequentially or in parallel, applying rule-based validation, aggregating intermediate outputs, and generating the final acceptance or rejection decision based on rule-based and machine learning evaluation. Execution results were published through dashboards, reports, application programming interfaces (APIs), and data storage services. The overall workflow orchestration process is illustrated in Figure 3.
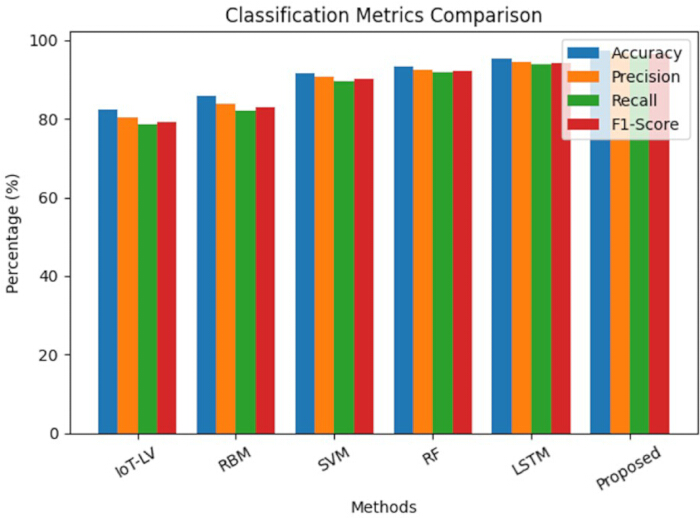
Figure 3: Comparison of classification performance metrics across different methods. Comparison of the classification performance of IoT-LV, RBM, Support Vector Machine (SVM), Random Forest (RF), Long Short-Term Memory (LSTM), and the proposed framework using the Open LV Network & Smart Meter dataset. Performance is evaluated using Accuracy, Precision, Recall, and F1-score. Results are presented as mean ± standard deviation (SD) from five independent experimental runs using a 70%/15%/15% training/validation/testing split. Error bars represent one standard deviation. Please click here to view a larger version of this figure.
6. Intelligent decision module
The Intelligent Decision Module was developed to automate low-voltage (LV) acceptance decisions using supervised machine learning models. Classification and regression algorithms were applied to the engineered feature vectors to support operational decision-making. Classification models identified normal and abnormal operating conditions, whereas regression models estimated future energy consumption and operational trends.
The input feature vector, X ∈ ℝd, comprised the statistical, voltage stability, load behavior, and power quality features extracted during the feature engineering stage. Standalone Support Vector Machine (SVM)44, Random Forest (RF)45, and Long Short-Term Memory (LSTM)46 models were implemented as baseline classifiers for comparative evaluation. The mathematical formulation of the learning models is provided in Supplementary File 1 (Section S5).
For classification, the output variable y ∈ {0,1} represented normal (0) and abnormal (1) operating conditions. When abnormal operating conditions or overload events were detected, the workflow generated a fault notification and flagged the acceptance process as invalid; otherwise, the process was classified as accepted.
The workflow orchestration engine integrated machine-learning predictions with rule-based validation, using a priority-based conflict-resolution strategy. Safety-critical operational rules and regulatory acceptance criteria were treated as hard constraints and therefore took precedence over machine-learning predictions when conflicts occurred. Final acceptance decisions were generated using the combined outputs of the rule-based validation and intelligent decision modules.
7. Cloud–edge integration and visualization dashboard
A cloud-edge computing architecture was implemented to support scalable data processing, storage, and visualization for the LV acceptance automation platform. Smart meters, SCADA systems, and IoT devices continuously collect electrical measurements, which are processed at the edge layer via filtering, normalization, feature extraction, and real-time inference to reduce communication overhead and enable low-latency decision-making. The mathematical derivations are provided in Supplementary File 1 (Section S6).
Processed data were transmitted to the cloud layer for long-term storage, advanced analytics, feature engineering, model training, and model management. Interactive dashboards provided real-time system monitoring, alerts, reporting, and operational decision support. The cloud-edge architecture is illustrated in Supplementary Figure 2, and the implementation details are summarized in Table 3.
| Layer | Component | Hardware / Software | Specification / Version | Purpose / Description |
| Edge Layer | Edge Device | Raspberry Pi 4 / NVIDIA Jetson Nano | Quad-core CPU, 4–8 GB RAM | Real-time data acquisition and local processing |
| IoT Gateway | Industrial IoT Gateway | MQTT / Modbus / OPC-UA support | Communication between sensors and edge/cloud | |
| Sensors / Smart Meters | Digital Smart Meters | Voltage, Current, Power Measurement | Data collection from LV network | |
| Edge Software | Python, EdgeX Foundry, MQTT Broker | Python 3.x | Data preprocessing, filtering, local inference | |
| Communication Protocols | Wi-Fi / PLC / RS-485 | Standard protocols | Data transmission to cloud layer | |
| Cloud Layer | Cloud Platform | AWS / Microsoft Azure / Google Cloud | Scalable cloud services | Data storage, analytics, and model training |
| Storage | AWS S3 / Azure Blob / InfluxDB | Time-series database | Storing historical and real-time data | |
| Compute & ML | Python, TensorFlow, PyTorch, Scikit-learn | ML libraries (latest versions) | Model training, evaluation, deployment | |
| Containerization | Docker, Kubernetes | Latest stable versions | Workflow orchestration and scalability | |
| Data Processing | Apache Spark / Pandas | Distributed processing | Large-scale data analytics | |
| Visualization Layer | Dashboard Tools | Grafana / Apache Superset / Plotly Dash | Web-based tools | Real-time monitoring and visualization |
| Web Framework | React.js / Angular / Flask / FastAPI | Modern web stack | UI development and API integration | |
| Notification System | Email / SMS Gateway / Push Notifications | Twilio / Firebase | Alert generation and communication | |
| API Services | REST APIs | JSON-based communication | Integration between modules |
Table 3: System implementation details. Summary of the hardware configuration, software environment, communication protocols, and cloud–edge computing components used for implementing the proposed LV acceptance automation platform.
الوصول مقيد. يرجى تسجيل الدخول أو بدء فترة تجريبية لعرض هذا المحتوى.
النتائج
تم تقييم أداء منصة الأتمتة المقترحة للقبول عند الجهد المنخفض (LV) باستخدام شبكة Open LV المفتوحة &؛ ومجموعة بيانات العدادات الذكية مع مجموعة بيانات عدادات ذكية اصطناعية تم إنشاؤها لتمثيل ظروف تشغيل إضافية وسيناريوهات الأعطال. وقد مكّنت مجموعة البيانات الاصطناعية من تقييم منضبط لتنظيم سير العمل، واتخاذ القرارات الذكية، واكتشاف الأعطال في ظل ظروف تشغيل غير طبيعية. الشبكة المفتوحة منخفضة الجهد &تتألف مجموعة بيانات العداد الذكي من قياسات العدادات الذكية المنزلية، وملفات الأحمال على مستوى المغذي، والقياسات الجهدية....
الوصول مقيد. يرجى تسجيل الدخول أو بدء فترة تجريبية لعرض هذا المحتوى.
المناقشة
أظهر التقييم التجريبي أن منصة أتمتة قبول الجهد المنخفض (LV) المقترحة والموجهة نحو سير العمل قد تفوقت باستمرار على النهج المرجعية في التصنيف، والتنبؤ، وكشف الأعطال، وزمن استجابة القرار التشغيلي، وقابلية التوسع. وقد نتجت هذه التحسينات في الأداء عن دمج الهندسة المتقدمة للميزات، وتنسيق سير العمل، والتعاون بين السحابة والحافة، واتخاذ القرار الهجين القائم على القواعد وتعلم الآلة، بدلاً من الاعتماد على نموذج واحد لتعلم الآلة. وتتفق هذه النتائج مع الدراسات السابقة التي أثبتت أن الأتمتة الموجهة نحو سير العمل وبنيات إنترنت الأشياء...
الوصول مقيد. يرجى تسجيل الدخول أو بدء فترة تجريبية لعرض هذا المحتوى.
الإفصاحات
يصرح المؤلفون بأنه لا توجد لديهم أي تضاربات في المصالح المالية أو غير المالية.
شكر وتقدير
يتوجه المؤلفون بالشكر إلى بوابة البيانات المفتوحة لشركة UK Power Networks لتوفير شبكة Open LV المتاحة للعموم. &؛ مجموعة بيانات العدادات الذكية المستخدمة في هذه الدراسة. لم يتلق هذا البحث أي تمويل خارجي.
الوصول مقيد. يرجى تسجيل الدخول أو بدء فترة تجريبية لعرض هذا المحتوى.
المواد
| الاسم | الشركة | رقم فهرسي | التعليقات |
|---|---|---|---|
| Apache Spark | Apache Software Foundation | Version 3.4+ | تحليلات البيانات واسعة النطاق |
| Apache Superset | Apache Software Foundation | Version 3.x | لوحة تحكم تحليلية |
| Docker Engine | Docker Inc. | Version 24.x | نشر التطبيقات |
| Eclipse Mosquitto MQTT Broker | Eclipse Foundation | Version 2.x | تبادل البيانات |
| EdgeX Foundry (Jakarta Release or later) | LF Edge (Linux Foundation) | Version Jakarta / Geneva | إدارة أجهزة الحافة |
| Flask / FastAPI | Pallets Projects / Sebastián Ramírez | Flask 2.3+ / FastAPI 0.100+ | تكامل واجهة برمجة تطبيقات الخلفية |
| Grafana | Grafana Labs | Version 10.x | التصور والمراقبة |
| Industrial IoT Gateway | Advantech / Siemens | ECU-1251 / SIMATIC IOT2040 | الاتصال من المستشعر إلى السحابة |
| IoT Sensors (Voltage/Current Sensors) | Texas Instruments / Analog Devices | INA219 / ACS712 | مراقبة الشبكة في الوقت الفعلي |
| Jetson Nano Developer Kit | NVIDIA Corporation | 945-13450-0000-100 | استنتاج الذكاء الاصطناعي عند الحافة |
| Kubernetes | Cloud Native Computing Foundation (CNCF) | Version 1.27+ | قابلية توسع سير العمل |
| LSTM Model (Keras/TensorFlow) | Google (TensorFlow/Keras) | Included in TF 2.12+ | التنبؤ بالأحمال والاستشراف |
| PLC (Power Line Communication) Module | STMicroelectronics | ST7580 | اتصالات الشبكة الذكية |
| Plotly Dash | Plotly Inc. | Version 2.x | التصور التفاعلي |
| Python 3.10 | Python Software Foundation | Version 3.10.x | معالجة البيانات وتحليلها |
| PyTorch | Meta AI | Version 2.0+ | تنفيذ التعلم العميق |
| Random Forest Algorithm | Scikit-learn | Included in v1.3+ | تصنيف الأعطال |
| Raspberry Pi 4 Model B (4GB RAM) | Raspberry Pi Foundation | RPI4-MODBP-4GB | المعالجة عند الحافة |
| React.js / Angular | Meta / Google | React 18.x / Angular 16+ | تطوير واجهة المستخدم |
| RS-485 Transceiver Module | Maxim Integrated (Analog Devices) | MAX485 | اتصال الأجهزة الصناعية |
| Scikit-learn | Scikit-learn Developers | Version 1.3+ | نماذج تعلم الآلة |
| Support Vector Machine (SVM) | Scikit-learn | Included in v1.3+ | التصنيف والتحقق |
| TensorFlow | Google LLC | Version 2.12+ | تدريب النماذج |
| Twilio / Firebase Cloud Messaging | Twilio Inc. / Google | Not applicable | التنبيهات والإشعارات |
| Wi-Fi Module | Espressif Systems | ESP8266 / ESP32 | نقل البيانات |
| XGBoost | DMLC (Distributed ML Community) | Version 1.7+ | دعم القرار الذكي |
المراجع
- Tong L, Zhou J, Li J. IoT-based low-voltage power distribution system management and control platform. Front Energy Res. 2022;10:902715. https://doi.org/10.3389/fenrg.2022.902715
- Babayigit B, Abubaker M. Industrial Internet of Things: A review of improvements over traditional SCADA systems for industrial automation. IEEE Syst J. 2023;18:120–133.
- Nakagawa EY, et al. Industry 4.0 reference architectures: State of the art and future trends. Comput Ind Eng. 2021;156:107241. https://doi.org/10.1016/j.cie.2021.107241
- Ladegourdie M, Kua J. Performance analysis of OPC UA for industrial interoperability towards Industry 4.0. Internet Things. 2022;3:507–525.
- Bader SR, Maleshkova M, Lohmann S. Structuring reference architectures for the industrial Internet of Things. Future Internet. 2019;11:151. https://doi.org/10.3390/fi11070151
- Fun TS, Samsudin A. Recent technologies, security countermeasure and ongoing challenges of industrial Internet of Things (IIoT): A survey. Sensors (Basel). 2021;21:6647. https://doi.org/10.3390/s21196647
- Mirani AA, et al. Key challenges and emerging technologies in industrial IoT architectures: A review. Sensors (Basel). 2022;22:5836. https://doi.org/10.3390/s22155836
- Fraile F, et al. Reference models for digital manufacturing platforms. Appl Sci. 2019;9:4433. https://doi.org/10.3390/app9204433
- Serôdio C, et al. Software and architecture orchestration for process control in Industry 4.0 enabled by cyber-physical systems technologies. Appl Sci. 2024;14:2160. https://doi.org/10.3390/app14052160
- Ungurean I, Gaitan NC. A software architecture for the industrial Internet of Things—A conceptual model. Sensors (Basel). 2020;20:5603. https://doi.org/10.3390/s20195603
- Hsiao CH, Lee WP. OPIIoT: Design and implementation of an open communication protocol platform for industrial Internet of Things. Internet Things. 2021;16:100441. https://doi.org/10.1016/j.iot.2021.100441
- Domínguez-Bolaño T, et al. An overview of IoT architectures, technologies, and existing open-source projects. Internet Things. 2022;20:100626. https://doi.org/10.1016/j.iot.2022.100626
- Sasiain J, et al. Towards flexible integration of 5G and IIoT technologies in Industry 4.0: A practical use case. Appl Sci. 2020;10:7670. https://doi.org/10.3390/app10217670
- Cañas H, et al. A conceptual framework for smart production planning and control in Industry 4.0. Comput Ind Eng. 2022;173:108659. https://doi.org/10.1016/j.cie.2022.108659
- Cabrini FH, et al. Enabling the industrial Internet of Things to cloud continuum in a real city environment. Sensors (Basel). 2021;21:7707. https://doi.org/10.3390/s21227707
- Gabriel MF, et al. Implementation of an IoT architecture for promoting healthy air quality in 84 homes of families with children. Build Environ. 2024;266:112040. https://doi.org/10.1016/j.buildenv.2024.112040
- Silva BN, Khan M, Han K. Internet of Things: A comprehensive review of enabling technologies, architecture, and challenges. IETE Tech Rev. 2018;35:205–220.
- Dhaou ISB, et al. Internet of Things technologies for smart grid. In: Research Anthology on Smart Grid and Microgrid Development. IGI Global; Hershey; 2022. p. 805–832.
- Kondoro A, et al. A low latency secure communication architecture for microgrid control. Energies. 2021;14:6262. https://doi.org/10.3390/en14196262
- Tightiz L, Yang H. A comprehensive review on IoT protocols' features in smart grid communication. Energies. 2020;13:2762. https://doi.org/10.3390/en13112762
- Kondoro A, et al. Real-time performance analysis of secure IoT protocols for microgrid communication. Future Gener Comput Syst. 2021;116:1–12.
- Rodrigues R, et al. A review of solid-state circuit breakers. IEEE Trans Power Electron. 2020;36:364–377.
- IEEE. IEEE Std 1159-2019: IEEE recommended practice for monitoring electric power quality. IEEE; Piscataway (NJ); 2019. https://doi.org/10.1109/IEEESTD.2019.8800097
- Otcenasova A, et al. The influence of power quality indices on active power losses in a local distribution grid. Energies. 2019;12:1389. https://doi.org/10.3390/en12071389
- Ma K, et al. Review of distribution network phase unbalance: Scale, causes, consequences, solutions, and future research direction. CSEE J Power Energy Syst. 2020;6:479–488.
- Peppanen J, et al. Modeling power electronic equipment to improve distribution feeder current and voltage balance [Presentation]. Presented at: IEEE PES Transmission and Distribution Conference and Exposition (T&D); Denver, CO; 2018. Available from: https://ieeexplore.ieee.org/ https://doi.org/10.1109/TDC.2018.8440261
- Sayed S, et al. Design and realization of an open-source and modular smart meter. Energy Sci Eng. 2019;7:1405–1422.
- Satapathy LM, et al. Arduino based home automation using Internet of Things (IoT). Int J Pure Appl Math. 2018;118:769–778.
- Shaban M, et al. Design of a partially grid-connected photovoltaic microgrid using IoT technology. Appl Sci. 2021;11:11651. https://doi.org/10.3390/app112411651
- Shaban M, Dhaou IB. Design of an IoT-enabled microgrid architecture for a partial grid-connected mode [Presentation]. Presented at: 18th International Multi-Conference on Systems, Signals and Devices (SSD); Virtual; 2021. Available from: https://ieeexplore.ieee.org/ https://doi.org/10.1109/SSD52085.2021.9429443
- Taye BZ, et al. Rural electrification planning using geographic information system (GIS). Cogent Eng. 2020;7:1836730. https://doi.org/10.1080/23311916.2020.1836730
- Huld T, et al. Geospatial analysis of photovoltaic mini-grid system performance. Energies. 2017;10:218. https://doi.org/10.3390/en10020218
- Domínguez J, et al. IntiGIS-Local: A geospatial approach to assessing rural electrification alternatives for sustainable socio-economic development in isolated communities—A case study of Guasasa, Cuba. Energies. 2024;17:3835. https://doi.org/10.3390/en17153835
- Tafula JE, et al. Multicriteria decision-making approach for optimum site selection for off-grid solar photovoltaic microgrids in Mozambique. Energies. 2023;16:2894. https://doi.org/10.3390/en16062894
- Isihak S, et al. Evolution of GIS-based rural electrification planning models and an application of OnSSET in Nigeria. Renew Sustain Energy Transit. 2022;2:100019. https://doi.org/10.1016/j.rset.2022.100019
- Korkovelos A, et al. The role of open access data in geospatial electrification planning and the achievement of SDG7: An OnSSET-based case study for Malawi. Energies. 2019;12:1395. https://doi.org/10.3390/en12071395
- Cicilio P, et al. uGrid: Reliable minigrid design and planning toolset for rural electrification. IEEE Access. 2019;7:163988–163999.
- Nasir M, et al. Optimal planning and design of low-voltage low-power solar DC microgrids. IEEE Trans Power Syst. 2018;33:2919–2928.
- Vai V, et al. Optimal low-voltage distribution topology with integration of PV and storage for rural electrification in developing countries: A case study of Cambodia. J Mod Power Syst Clean Energy. 2020;8:531–539.
- Banad Y, Sharif S, Rezaei Z. Artificial intelligence and machine learning for smart grids: from foundational paradigms to emerging technologies with digital twin and large language model-driven intelligence. Energy Convers Manag X. 2025;28:101329. https://doi.org/10.1016/j.ecmx.2025.101329
- Álvarez-López C, González-Briones A, Li T. Explainable AI and multi-agent systems for energy management in IoT-edge environments: a state-of-the-art review. Electronics. 2026;15(2):385. https://doi.org/10.3390/electronics15020385
- UK Power Networks. Open data portal [Online]. Available from: https://www.ukpowernetworks.co.uk/our-company/open-data-portal (Accessed June 2026).
- Jolliffe IT. Principal Component Analysis. 2nd ed. Springer; New York; 2002. https://doi.org/10.1007/b98835
- Cortes C, Vapnik V. Support-vector networks. Mach Learn. 1995;20:273–297.
- Breiman L. Random forests. Mach Learn. 2001;45:5–32.
- Hochreiter S, Schmidhuber J. Long short-term memory. Neural Comput. 1997;9:1735–1780.
- Fawcett T. An introduction to ROC analysis. Pattern Recognit Lett. 2006;27:861–874.
- Montgomery DC, Runger GC. Applied Statistics and Probability for Engineers. 8th ed. John Wiley & Sons; Hoboken (NJ); 2020.
- Montgomery DC. Design and Analysis of Experiments. 10th ed. John Wiley & Sons; Hoboken (NJ); 2020.
الوصول مقيد. يرجى تسجيل الدخول أو بدء فترة تجريبية لعرض هذا المحتوى.