This retrospective study included 862 VTE-confirmed inpatients to analyze the epidemiology of CRT and subtype-correlated indicators, and to assess the discriminative capacity of combined D-dimer and catheter indwelling time. CVC carriers showed a higher 6-month VTE recurrence rate, offering preliminary hypotheses for subtype-targeted vascular access management.
مقالة منهجية
Epidemiological Characteristics of Venous Thromboembolism and Associated Indicators for Catheter-Related Thrombosis Subtypes
في هذه المقالة
ملخص
الملخص
Venous thromboembolism (VTE) is a severe and life-threatening complication in hospitalized patients, and central venous catheter (CVC) insertion significantly increases the risk of catheter-related thrombosis (CRT). Epidemiological profiles of hospitalized patients with confirmed VTE are characterized; indicators correlated with CRT subtype are identified; the discriminative performance of circulating biomarkers is evaluated; and VTE recurrence metrics are contrasted between cohorts with and without CVC placement. A single-center retrospective case-case comparative analysis is conducted on 862 patients with imaging-confirmed VTE. Analytical methodologies incorporate univariate and multivariate logistic regression, Kaplan–Meier survival analysis, and receiver operating characteristic (ROC) curve testing. The in-hospital VTE incidence was 2.1%, concentrated in elderly, malignancy, and postoperative patients. CRT incidence was 10.2%, highest with peripherally inserted central catheter (PICC). Five clinical indicators correlated with CRT subtype were identified: prolonged catheter indwelling, catheter malposition, elevated D-dimer levels, malignant tumor history, and prior VTE events. The combination of D-dimer and catheter indwelling time exhibited robust discriminative power (AUC = 0.82) for differentiating CRT from non-CRT VTE among patients with confirmed VTE. The 6-month VTE recurrence rate was 28.4% in the CVC group and 9.7% in the non-CVC group. These observational findings yield only tentative clinical hypotheses aimed at distinguishing thrombotic subtypes among VTE patients. Further multicenter prospective research is necessary to validate these indicators and develop mature, standardized prevention protocols for broad clinical application.
المقدمة
Venous thromboembolism (VTE) is a common vascular obstructive disorder caused by abnormal venous coagulation, encompassing deep vein thrombosis (DVT) and pulmonary embolism (PE) as two clinical phenotypes of the same disease1. VTE represents a leading fatal complication among hospitalized patients worldwide, with incidence rising markedly with age. Major acquired risk factors include cancer, surgery, trauma, immobilization, and chronic diseases2. In China, the burden of VTE-related hospitalization has increased in recent years, making in-hospital VTE a key focus for patient safety and quality management3.
Central venous catheters (CVCs) are widely used in clinical practice, but catheter-related thrombosis (CRT) has become a major subtype of VTE4. In clinical settings including intensive care, chemotherapy, parenteral nutrition, and hemodynamic monitoring, CVCs are indispensable, yet CRT remains a frequent and serious complication5. CRT may cause catheter dysfunction, infection, symptomatic DVT, and PE, leading to additional clinical burden5. CRT can also result in catheter failure and unplanned catheter removal, increasing clinical management burden4,5. Reported CRT incidence ranges from 5% to 15%, and PICCs show higher thrombosis rates than internal jugular or subclavian vein catheters6. CVC placement induces the three pathological changes outlined in Virchow's triad: endothelial damage, disturbed venous hemodynamics, and local hypercoagulability7. These catheter-mediated changes interact with systemic risk factors such as advanced age, malignancy, infection, and impaired mobility to facilitate CRT development5,8.
Despite these trends, most Chinese studies focus on the epidemiology of VTE in general, with limited data from consecutive inpatient cohorts in large general hospitals. Subgroup comparisons and long-term recurrence analyses remain scarce, hindering stratified prevention and individualized management. National surveys also show that in-hospital VTE prevention systems remain suboptimal, with variations in implementation across hospitals9.
Current CRT prevention remains largely uniform and does not fully reflect the heterogeneity of VTE risk. Studies have classified VTE risk into patient-, tumor-, treatment-, and biomarker-related domains, with varying contributions from tumor site, therapy, and biomarker levels8. Recent reviews have also highlighted variations and limitations in CRT prevention guidelines and the evidence supporting some preventive recommendations10,11. This lack of risk-stratified intervention may contribute to persistent CRT and recurrence rates. Most existing studies are single-center, small-sample, or limited to specific tumors or departments, and lack validated independent associated indicators, predictive models, and long-term recurrence data for hospital-wide CVC12.
Most existing CRT-related research relies on small sample sizes from single centers and is limited to one department or one type of cancer. Few studies conduct cross-subgroup analyses that cover all clinical departments in general hospitals among patients already confirmed to have VTE. Many past papers label binary D-dimer values and catheter indwelling duration as general indicators for predicting new thrombotic events among all inpatients, without distinguishing between study participants who already have a formal VTE diagnosis and those who do not. This blurs two distinct statistical uses: forecasting new thrombosis risk in people without VTE and distinguishing different thrombosis subtypes among patients already diagnosed with VTE. In addition, few published analyses conduct competing-risk assessments of VTE recurrence after adjusting for multiple confounding factors, and few studies compare their findings with established VTE risk stratification tools. Two scoring systems commonly used in clinical practice for VTE risk screening are the Caprini score and the Padua score13,14. Both tools are used to assess baseline VTE risk in hospitalized patients and are primarily intended to identify patients at risk of developing VTE. These scoring tools can estimate the overall risk of developing new VTE during hospital stays, but cannot identify whether subsequent thrombosis is associated with central venous catheter use. No simple combined evaluation tool has been designed specifically for patients with confirmed VTE to distinguish CRT from non-CRT venous thromboembolism. The combined model built in this study, using D-dimer levels and catheter indwelling time, targets only hospitalized patients with imaging-verified VTE. In this model, D-dimer >0.5 mg/L fibrinogen equivalent units (FEU) and catheter indwelling time >7 days were used as the respective thresholds. Its sole function is to differentiate thrombotic subtypes, and it cannot serve as a universal screening tool for all inpatients or for all patients undergoing CVC placement.
This retrospective case-case comparative study used medical record data from Beijing Friendship Hospital. The study described the epidemiological characteristics of hospitalized patients with imaging-confirmed VTE, identified indicators associated with CRT subtype, evaluated the discriminative capacity of combined D-dimer and catheter indwelling time to distinguish CRT from non-CRT venous thrombosis, and compared 6-month VTE recurrence between patients with and without CVC use. The combined index was designed to distinguish CRT from non-CRT among patients with confirmed VTE rather than to predict new-onset CRT among all patients receiving CVC placement. Given the single-center retrospective design and lack of external validation, the findings provide preliminary evidence for subtype-targeted VTE management and require prospective and multicenter validation.
البروتوكول
This study was a single-center retrospective case-case comparative study. The research protocol was reviewed and approved by the Ethics Committee of Beijing Friendship Hospital, Capital Medical University (approval No. 2022-P2-234-01). The study was conducted in strict accordance with the Declaration of Helsinki, ICH/GCP, Chinese GCP, and relevant laws and regulations. All research procedures were completed within the validity period of ethical approval. The equipment and software used are listed in the Table of Materials.
Study subjects
Patients hospitalized in Beijing Friendship Hospital, Capital Medical University, and diagnosed with venous thromboembolism (VTE) by imaging examination from August 2022 to August 2023 were selected as study subjects. The diagnostic criteria met the relevant requirements of the Guidelines for Diagnosis and Treatment of Venous Thromboembolism; clinical data, imaging results, laboratory tests, and relevant records of central venous catheter (CVC) indwelling were complete.
The following patients were excluded from both study cohorts: those transferred solely for follow-up with incomplete clinical records; individuals with congenital coagulation disorders or active autoimmune disease; pregnant or breastfeeding women; and patients with a hospital stay of less than 24 h or a diagnosis of pseudo-thrombosis.
Judgment of CVC exposure relied on all catheter placement and retention records generated throughout each patient’s admission period, covering two types of participants: those who already had a CVC upon admission and those who received a new catheter placement during hospitalization. For patients who underwent catheter removal followed by reinsertion, placement and removal records were reviewed based on the recorded catheterization time, and CVC exposure was treated as a time-dependent variable in subsequent Cox regression analysis. Two senior vascular surgeons jointly assessed whether a thrombus was classified as CRT. CRT was defined when the thrombus was located in the same venous segment as the indwelling CVC, and imaging showed that the thrombus was distributed along the catheter wall. If the two reviewers reached different conclusions, the imaging findings were re-evaluated by a panel of three or more senior clinicians to reach a final consensus. Two patient groups with a nested relationship were used for different analyses. During the study period, there were 41,048 hospital admissions, of which 3,108 patients received CVC placement and 37,940 did not. Two overlapping analytical cohorts were established. Cohort A comprised 862 patients with imaging-confirmed VTE, including 317 patients with CVC exposure who were classified as CRT-positive and 545 patients without CVC exposure who were classified as having non-CRT VTE. Cohort B comprised all 3,108 patients who received CVC placement, including 317 CRT-positive patients and 2,791 CRT-negative patients. Thus, the 317 CRT-positive patients were included in both Cohort A and Cohort B. Cohort B was used to calculate the overall CRT detection rate and evaluate catheter-related characteristics, whereas Cohort A was used to describe VTE characteristics, distinguish CRT from non-CRT VTE, and assess 6-month VTE recurrence according to CVC exposure. The study population and cohort allocation are shown in Figure 1.
Within Cohort A, patients were classified according to CVC exposure as the CVC-exposed group (n = 317) or the non-CVC-exposed group (n = 545). Within Cohort B, patients were classified as CRT-positive (n = 317) or CRT-negative (n = 2,791). Patients in Cohort B were further categorized according to catheterization site as PICC, internal jugular vein catheterization, or subclavian vein catheterization groups.
Data collection
Baseline demographics, clinical diagnosis and treatment records, laboratory parameters, CVC implantation metrics, and follow-up information are extracted uniformly from hospital electronic medical record platforms, laboratory information systems, and picture archiving and communication systems. The data were extracted according to the predefined study variables and recorded in a standardized database. The extracted information was checked against the original medical records to ensure data completeness and accuracy.
Gender, age (grouped as <40 years, 40–59 years, 60–79 years, and ≥80 years), height, weight, history of underlying diseases (hypertension, diabetes mellitus, coronary heart disease, etc.), history of malignant tumor (tumor type, pathological stage, and treatment plan), and previous VTE history.
Admission department, hospital stay, surgical history (surgery type, operation duration, and postoperative bed rest time), and CVC indwelling-related decisions.
D-dimer with a cut-off value of 0.5 mg/L FEU, PT, APTT, INR, and routine blood test data were recorded from admission and during CVC stay. For all regression and ROC analyses, only baseline D-dimer drawn before catheter insertion and thrombus imaging was adopted. Samples tested after thrombosis appeared were excluded, as raised levels from secondary fibrinolysis would introduce temporal bias.
Catheterization site (PICC, internal jugular vein, subclavian vein), catheter indwelling time (grouped as ≤7 days and > 7 days), abnormal catheter position (catheter tip deviating from the predetermined vascular anatomical position confirmed by imaging examination), catheter operation duration, and catheter maintenance frequency.
Results of lower extremity venous ultrasound, pulmonary computed tomography angiography (CTPA), venography, and other imaging examinations, VTE diagnosis time, lesion location (deep vein thrombosis DVT/pulmonary embolism PE), and thrombus involvement range.
For continuous variables with a missing proportion lower than 5%, multiple imputation by chained equations was performed using R version 4.3.1. Five imputed datasets were generated, with 20 iterations per dataset to achieve convergence of the imputation models. Pooled estimates across all imputed datasets were adopted for subsequent regression analyses. Missing categorical variables were coded as an independent "unknown" category and retained in the analysis. Any patient lacking core key information, including baseline D-dimer results, catheter indwelling duration, or confirmed thrombus imaging reports, was excluded per pre-set eligibility criteria.
Patients lost to follow-up were marked as censored events in survival analysis, with exact loss time and relevant reasons fully documented. Over the 6-month follow-up period, 19 participants failed to complete follow-up, and 76 patients died from any cause. Death was treated as a competing risk and adjusted via the Fine-Gray competing risk model during recurrence analysis.
Diagnostic and review criteria
All VTE diagnoses were independently assessed by two senior vascular surgeons in accordance with domestic Guidelines for the Diagnosis and Treatment of Venous Thromboembolism. DVT was confirmed by the detection of solid intravascular echoes and filling defects on venous color Doppler ultrasound. PE was diagnosed if filling defects were visible in the main pulmonary artery or its branches on a pulmonary CTPA.
If inconsistent diagnostic conclusions appeared between the two reviewers, a panel of three or more senior clinicians would jointly re-evaluate all imaging data to reach a unified final diagnosis.
For CRT identification, an extra criterion was adopted: the detected thrombus must be localized within the same venous access as the indwelling CVC, and isolated spontaneous thrombosis in distant vessels would not be categorized as CRT.
Follow-up protocol
All subjects were followed up after treatment/diagnosis using a combination of hospital electronic medical record follow-up and telephone follow-up. Telephone follow-up was conducted by trained research staff. Calls were initiated at 1-month, 3-month, and 6-month time-points after discharge. Before each call, researchers reviewed electronic medical records to confirm baseline information. During telephone contact, investigators inquired about symptoms suggestive of recurrent VTE, including limb swelling-pain, chest tightness, and hemoptysis; participants were reminded to provide results of relevant imaging examinations if they had received re-examination at outside hospitals. When telephone contact failed, two additional repeat calls were made on different working-day time slots. Patients who remained unreachable after repeated attempts were defined as loss-to-follow-up and marked as censored events. During the 6-month follow-up period, information on VTE recurrence, all-cause death, and loss to follow-up was recorded. The follow-up endpoint was VTE recurrence, 6 months after discharge, or death (whichever occurred first). The diagnostic criteria for recurrent VTE were as follows: new VTE-related clinical symptoms (limb swelling and pain, chest tightness, hemoptysis) occurred during follow-up, and new thrombotic lesions were confirmed by imaging examination. Recurrence time, recurrence site, and adverse outcomes were recorded for all subjects to analyze the thrombosis recurrence rate.
Statistical methods
Data processing was performed using SPSS 26.0. GraphPad Prism 9.0 was used for statistical visualization, including ROC curves and Kaplan-Meier survival curves. R version 4.3.1 was used for multiple imputation, DeLong testing, and Fine-Gray competing-risk modeling. Normally distributed measurement data are presented as mean ± standard deviation (SD), with intergroup comparisons conducted via independent sample t-tests. Non-normal distributed data are reported as median (interquartile range) [IQR], with non-parametric tests adopted for intergroup comparisons. Categorical data are presented as number and percentage [n (%)], and intergroup differences are assessed via χ2 testing. Multivariate logistic regression analysis was performed to screen clinical indicators correlated with CRT subtype among patients with confirmed VTE. Variables with p < 0.05 in univariate analysis are incorporated as independent predictors, while CVC-related VTE onset serves as the binary dependent variable (present = 1, absent = 0). A stepwise regression method was used to construct the multivariate logistic regression model. Kaplan–Meier methods were used to generate survival curves, and the log-rank test was used to compare cumulative VTE recurrence between patients with and without CVC use. Patients without documented recurrence were censored at the last available follow-up or at six months. Because all-cause death could preclude observation of VTE recurrence, death was treated as a competing event. A Fine-Gray competing-risk model was fitted using R version 4.3.1 to account for the competing risk of death during recurrence analysis. The Fine-Gray model was adjusted for prespecified clinical covariates associated with VTE recurrence. ROC curve analysis quantifies the discriminative capacity of candidate markers to distinguish CRT from non-CRT venous thrombosis in patients diagnosed with VTE, with area under the curve (AUC) calculated as a discriminative metric; an AUC exceeding 0.8 indicates strong discriminative capacity for differentiating thrombotic subtypes. All statistical testing adopts a two-sided design, with statistical significance defined as p < 0.05. The DeLong test was performed using R version 4.3.1 to compare the AUCs of individual indicators and the combined marker.
النتائج
Baseline epidemiological characteristics of study subjects
During the study period, there were 41,048 hospital admissions, among which 862 patients had imaging-confirmed VTE, corresponding to an in-hospital VTE incidence of 2.1%. The baseline epidemiological characteristics of the study subjects are summarized in Table 1. There were 457 males (53.0%) with a VTE incidence of 2.3% and 405 females (47.0%) with a VTE incidence of 1.9%, indicating a slightly higher incidence in males. Patients’ ages ranged from 21 to 98 years, with a median age of 68 years, and they were mainly elderly. Among them, the 60–79 years age group accounted for the highest proportion (41.5%, 358/862), the ≥80 years group 23.8% (205/862), the 40–59 years group 26.7% (230/862), and the <40 years group the lowest (8.0%, 69/862). In the etiological composition of VTE patients, underlying medical diseases accounted for 36.1% (311/862), malignant tumor 34.7% (299/862), and postoperative surgery 29.2% (252/862). Malignant tumor types were mainly digestive system tumors (42.1%, 126/299), respiratory system tumors (28.4%, 85/299), and gynecological/genitourinary system tumors (19.4%, 58/299). Major surgeries were mainly abdominal surgery (38.9%, 98/252), orthopedic surgery (27.8%, 70/252), and thoracic surgery (18.3%, 46/252). Underlying medical diseases were mainly cardiovascular and cerebrovascular diseases (45.0%, 139/311), chronic respiratory diseases (26.7%, 83/311), and diabetes mellitus with vascular lesions (19.6%, 61/311).
Occurrence of central venous catheter‑related VTE
The incidence of CRT across different catheterization sites is presented in Table 2. Among the 862 patients with imaging-confirmed VTE in Cohort A, 317 (36.8%) had CVC exposure and were classified as CRT-positive. Cohort B comprised 3,108 patients who received CVC placement during the study period, of whom 317 developed CRT, corresponding to an overall CRT detection rate of 10.2% (317/3,108). The CRT incidence was highest among patients with PICC placement (13.6%, 152/1,118), followed by internal jugular vein catheterization (8.1%, 98/1,209) and subclavian vein catheterization (6.4%, 67/781).
Univariate analysis of associated indicators for CVC-Related VTE
Univariate analysis was performed on indicators potentially associated with CRT occurrence, the dependent variable. Detailed comparisons between the CRT and non-CRT groups are presented in Table 3. The results showed that catheter indwelling time > 7 days, abnormal catheter position, D-dimer >0.5 mg/L FEU, complicated malignant tumor, previous VTE history, PICC catheterization site, age ≥60 years, and hospital stay >14 days were significantly associated with CRT (all p < 0.05). However, gender, hypertension/diabetes mellitus, catheter operation duration, and catheter maintenance frequency showed no significant differences between groups (all p > 0.05). Supplementary Table 1 lists the comparison results of four routine coagulation indices measured in CRT-positive and CRT-negative subjects. Minor statistical differences of APTT and INR are observed between the two cohorts, yet PT and TT show no evident group-level distinctions. After a comprehensive assessment of confounding effects, none of these coagulation indicators carries an independent correlation with the occurrence of CRT, so all four indicators are not included in the subsequent multivariate logistic regression model.
Multivariate logistic regression analysis of indicators correlated with CRT subtype
Indicators with p < 0.05 in univariate analysis were used as independent variables for multivariate Logistic regression analysis (stepwise regression, inclusion criterion α = 0.05, exclusion criterion α = 0.10). The assignment of independent variables is shown in Table 4. The results showed that catheter indwelling time >7 days, abnormal catheter position, D-dimer >0.5 mg/L FEU, complicated malignant tumor, and previous VTE history were indicators independently correlated with CRT subtype (all p < 0.001). Previous VTE history yielded the highest OR value, meaning it showed the strongest association with CRT subtype in this cohort (Table 5).
Analysis of the discriminative capacity of indicators to distinguish CRT among confirmed VTE patients
ROC curve analysis showed that among single indicators, D-dimer > 0.5 mg/L FEU showed the strongest discriminative capacity for distinguishing CRT from non-CRT VTE (AUC = 0.78, 95%CI: 0.75–0.81, p < 0.001), followed by catheter indwelling time longer than 7 days (AUC = 0.72, 95%CI: 0.69–0.75, p < 0.001). The AUC of the combined D-dimer and catheter indwelling time discriminative index was 0.82 (95%CI: 0.79–0.85, p < 0.001), with markedly stronger discriminative capacity than individual markers. The optimal cut-off value for subtype discrimination was D-dimer > 0.5 mg/L FEU and catheter indwelling time >7 days, with a sensitivity of 89.6%, specificity of 71.2%, and Youden index of 0.608 (Figure 2). Smooth lines for the two binary predictors in Figure 2 are software-generated visual renderings, and their AUCs are calculated from fixed binary cut-offs.
Pairwise AUC comparisons via DeLong testing are summarized in Supplementary Table 2. The discriminative performance of isolated D-dimer was significantly higher than that of single catheter indwelling time (Z = 2.874, p = 0.004). The combined index yielded a statistically larger AUC relative to either separate marker (all p < 0.01). The corresponding positive predictive value reached 62.3% and the negative predictive value 93.1% under this optimal threshold. All comparative statistics were calculated solely from the internal single-center sample set. Calibration evaluation and independent external validation were not carried out within the present study, and further multicenter data are required to verify the generalizability of this combined discriminative tool.
Comparison of VTE recurrence rates between patients with and without CVC indwelling
A total of 862 patients with confirmed VTE were followed up for six months. Nineteen participants were lost to follow-up and marked as censored data, and 76 patients experienced all-cause death, which was treated as a competing risk event. Kaplan-Meier survival curve analysis showed that the VTE recurrence rate in the CVC exposed group was significantly higher than that in the non-indwelling group during the 6-month follow-up (Log-rank χ2 = 49.872, p < 0.001). The cumulative recurrence rate was 28.4% (90/317) in the CVC exposed group, including 35 cases (11.0%) recurrent within 1 month, 42 cases (13.2%) within 3 months, and 13 cases (4.1%) within 6 months. The cumulative recurrence rate was 9.7% (53/545) in the non-CVC exposed group, including 12 cases (2.2%) recurrent within 1 month, 26 cases (4.8%) within 3 months, and 15 cases (2.7%) within 6 months (Figure 3). Cox regression adjusted for malignancy, surgical history, length of hospital stay, anticoagulation regimen, and severity of underlying diseases identified CVC exposure as independently associated with VTE recurrence (HR = 2.714, 95% CI: 2.103–3.496, p < 0.001). After adjusting for death events via the Fine-Gray competing risk model, the gap in cumulative recurrence rates between the two groups narrowed, but the intergroup difference remained statistically significant (p < 0.001). The anatomical sites of recurrent thrombus in all 143 recurrent VTE cases are organized in Supplementary Table 3. The distribution of recurrent lesions differs greatly between subjects with CVC placement history and those without. Lesions located on the catheter-side upper central vein account for the largest proportion of recurrence in the CVC group, while recurrent events mainly appear in lower limb deep veins among patients without CVC exposure. The chi-square test confirms significant variation in the distribution of recurrent thrombus locations between the two groups (χ2 = 68.327, p < 0.001).
DATA AVAILABILITY:
The datasets generated and analyzed during the current study are provided in Supplementary File 1, including the raw data and data dictionary used for the analyses.
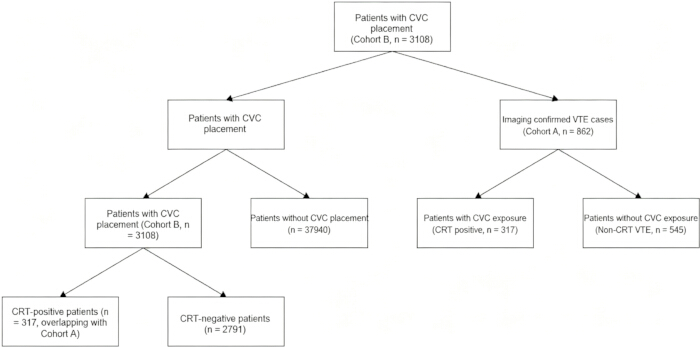
Figure 1: Study population and cohort allocation. During the study period, 41,048 patients were hospitalized, of whom 3,108 received CVC placement and 37,940 did not. Two overlapping analytical cohorts were established. Cohort A comprised 862 patients with imaging-confirmed venous thromboembolism (VTE), including 317 patients with CVC exposure who were classified as catheter-related thrombosis (CRT)-positive and 545 patients without CVC exposure who were classified as having non-CRT VTE. Cohort B comprised 3,108 patients with CVC placement, including 317 CRT-positive and 2,791 CRT-negative patients. The 317 CRT-positive patients were included in both cohorts. Cohort B was used to determine the overall CRT detection rate and evaluate catheter-related characteristics, whereas Cohort A was used to characterize VTE, distinguish CRT from non-CRT VTE, and assess 6-month VTE recurrence according to CVC exposure. CVC, central venous catheter; CRT, catheter-related thrombosis; VTE, venous thromboembolism. Please click here to view a larger version of this figure.
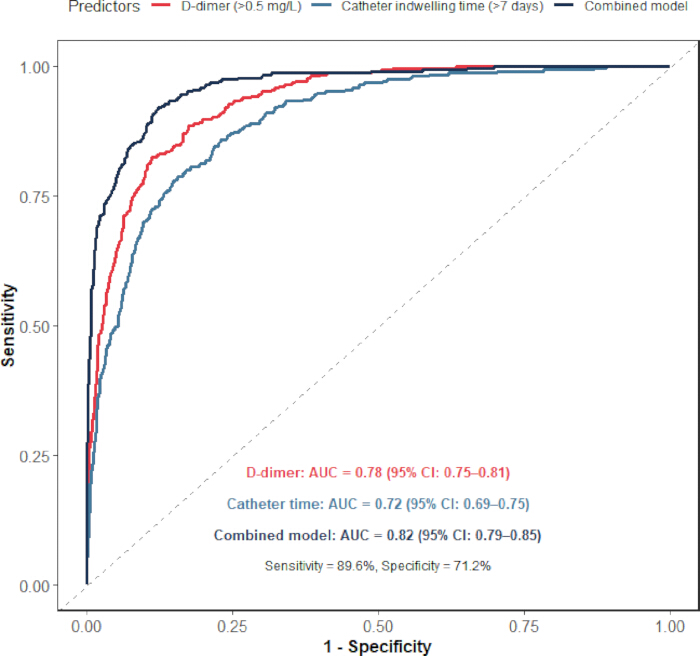
Figure 2: ROC curves for discriminating CRT and non-CRT VTE. Receiver operating characteristic curves compare the discriminative performance of D-dimer, catheter indwelling time, and their combined index for identifying CRT among patients with confirmed VTE. Key performance metrics, including AUC, sensitivity, and specificity, are annotated within the plot. The combined index showed better discriminative performance than either single marker. Smooth curves represent software visual rendering. AUC values are computed from binary thresholds rather than continuous predictor values. Please click here to view a larger version of this figure.
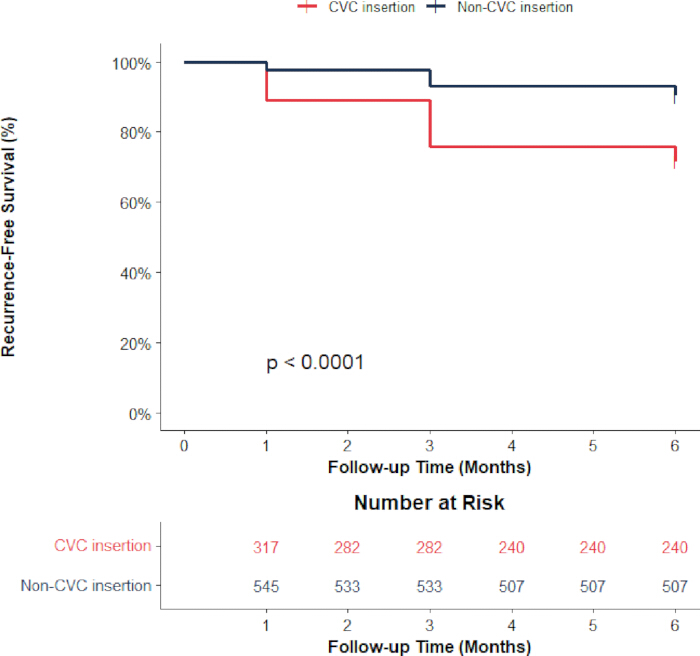
Figure 3: Kaplan-Meier curves for 6-month VTE recurrence-free survival. Kaplan-Meier curves compare 6-month venous thromboembolism recurrence-free survival between patients with and without CVC insertion. The horizontal axis represents follow-up time in months, and the vertical axis represents recurrence-free survival percentage. The red curve indicates patients with CVC exposure, and the black curve indicates patients without CVC exposure. A number-at-risk table for each time point is shown below the plot, and group-comparison statistical results are annotated within the figure. Patients with CVC insertion exhibit poorer recurrence-free survival. Please click here to view a larger version of this figure.
Table 1: Baseline epidemiological characteristics of 862 patients with VTE. The total denominator corresponds to 41,048 total in-hospital admissions during the same period, including 19,870 male admissions and 21,178 female admissions. Age stratification includes <40years, 40–59years, 60–79years, and ≥80years. Etiologies are classified into three groups: underlying medical conditions, malignant tumors, and post-surgical status. Data are presented as the number of cases (proportion/detection rate, %). Please click here to download this Table.
Table 2: Occurrence of CVC‑related VTE at different catheterization sites. The total denominator refers to 3108 hospitalized patients with indwelling central venous catheters (CVCs) during the study period. Catheter-related thrombosis (CRT) was defined as imaging-confirmed venous thromboembolism associated with the catheter. The chi-square test was used to compare CRT detection rates across the three catheterization sites, with χ2 = 26.354 and p < 0.001, indicating a statistically significant intergroup difference. Please click here to download this Table.
Table 3: Univariate analysis of CVC‑related VTE occurrence. The total denominator included 3108 hospitalized patients with indwelling CVCs, among whom 317 patients had CRT and 2791 patients did not. The chi-square test was adopted for intergroup comparison of categorical variables. p < 0.05 indicated a statistically significant univariate association between the variable and CRT. Please click here to download this Table.
Table 4: Independent variable assignment table for multivariate Logistic regression analysis. All variables with p < 0.05 in univariate analysis were included as independent variables. The dependent variable was coded as 1 for CRT-positive cases and 0 for CRT-negative cases. Stepwise regression was applied to screen variables independently associated with CRT. Please click here to download this Table.
Table 5: Multivariate Logistic regression analysis results of CVC‑related VTE occurrence. The goodness-of-fit test of the model yielded χ2 = 326.745, p < 0.001, with a Nagelkerke R2 of 0.418. An odds ratio (OR) greater than 1 indicated a positive statistical correlation between the variable and CRT positivity, and p < 0.001 was regarded as statistically significant. Please click here to download this Table.
Supplementary Table 1: Comparison of coagulation parameters between CRT-positive and CRT-negative groups. A total of 3108 hospitalized patients with indwelling CVCs were enrolled, including 317 CRT-positive patients and 2791 CRT-negative patients. Measurement data are expressed as mean ± standard deviation (SD). An independent sample t-test was used for intergroup comparisons. No statistically significant intergroup differences were observed for PT, TT (all p > 0.05); thus, these coagulation markers were not incorporated into the multivariate Logistic regression model. Please click here to download this file.
Supplementary Table 2: DeLong test comparisons of AUC values for D-dimer, catheter indwelling time, and their combined index. DeLong non-parametric tests were applied to conduct pairwise comparisons of AUC values for receiver operating characteristic curves. The statistical significance threshold was set at α = 0.05, where p < 0.05 represented significant differences between paired AUCs. All analyses relied on the study cohort comprising 862 patients with imaging-confirmed VTE, including 317 CRT-positive and 545 CRT-negative participants. Please click here to download this file.
Supplementary Table 3: Comparison of distribution of recurrent thrombus locations between patients with and without CVC exposure. A total of 143 recurrent VTE events were recorded, including 90 cases in the CVC-exposed group and 53 cases in the non-CVC-exposed group. Enumeration data are presented as the number of cases (proportion, %). The chi-square test was applied for group comparison, with χ2 = 68.327 and p < 0.001, indicating a statistically significant difference in the distribution of recurrent thrombus locations between the two cohorts. Please click here to download this file.
Supplementary File 1: The datasets generated and analyzed during the current study. Please click here to download this file.
المناقشة
Venous thromboembolism (VTE) is a life-threatening vascular complication in hospitalized patients, including deep vein thrombosis (DVT) and pulmonary embolism (PE). Central venous catheter (CVC)-related thrombosis (CRT) represents an important form of iatrogenic thrombosis4,5,15, which may increase long-term complications, prolong hospital stay, and adversely affect patient outcomes11. Current CRT studies are mostly limited to single departments and lack standardized prevention strategies. Risk-stratified assessment and standardized CVC management may provide useful information for CRT evaluation, although their clinical effectiveness requires further prospective validation.
In this study, the in-hospital VTE incidence was 2.1%, with a slightly higher rate in males (2.3%) than in females (1.9%), which is within the range reported by Chinese multicenter studies and slightly lower than data from Europe and America16,17,18. Sex-related biological and hormonal differences may contribute to variations in VTE risk19,20. Elderly patients accounted for the majority of VTE cases due to degenerative vascular function, multiple comorbidities, and prolonged bed rest21,22. The main etiologies were underlying diseases, malignant tumors, and postoperative status; tumor-related hypercoagulability further elevates thrombosis risk23,24,25. Cancer-associated VTE is driven by multiple overlapping thrombotic and hemostatic pathways, including tumor-related hypercoagulability and treatment-associated factors26. These epidemiological features help identify high-risk populations for targeted VTE prevention.
The CRT incidence in this study was 10.2%, and PICC showed a significantly higher rate (13.6%) than the internal jugular vein (8.1%) and subclavian vein (6.4%)9,27. The observed difference may be related to vascular anatomy, catheter insertion path, and differences in patient characteristics among catheterization sites. PICC is inserted through peripheral superficial veins and has a relatively long catheter insertion path, which may be associated with greater local vascular irritation. In addition, catheter movement during limb activity may contribute to local vascular irritation27. Many patients with PICC placement also have malignant tumors and receive chemotherapy, which may be associated with a higher baseline thrombotic risk. Previous experimental evidence has shown that some chemotherapeutic agents can induce vascular and endothelial injury through oxidative stress-related pathways24. These factors may partly explain the higher CRT incidence observed in the PICC group. In contrast, the subclavian vein has a thick lumen, deep location, relatively fixed anatomical structure, good stability after catheter insertion, significantly reduced mechanical stimulation to vascular endothelium, and high blood flow velocity, which may reduce local thrombotic tendency by influencing blood flow conditions and endothelial stimulation, thus having the lowest thrombosis incidence28. Multivariate logistic regression identified five clinical indicators independently associated with CRT subtype in this VTE-confirmed cohort: catheter indwelling time >7 days, abnormal catheter position, D-dimer >0.5 mg/L FEU, malignant tumor, and previous VTE history. These findings are consistent with previous reports describing catheter-related factors, malignancy, and prior VTE as important CRT-associated characteristics8,29,30. D-dimer serves as a reliable biomarker of hypercoagulability31,32. Malignant tumor was identified as an independent associated indicator for CRT subtype, which may partly reflect tumor-related hypercoagulability. Procoagulant factors secreted by tumor cells may interact with CVC-related vascular endothelial injury and contribute to coagulation activation, which may partly explain the increased CRT incidence observed in patients with malignant tumors. Patients with previous VTE history may have an increased susceptibility to thrombosis due to persistent clinical risk factors. Repeated CVC exposure may further contribute to thrombotic susceptibility through multiple pathways; however, the specific mechanisms require further investigation. Previous studies have highlighted the importance of individualized VTE risk assessment and prevention, particularly in patients with cancer and other high-risk characteristics33. In the present study, the identified associations may help inform further risk stratification of patients with confirmed VTE, although prospective studies are needed before specific anticoagulation strategies can be recommended. Existing VTE risk assessment tools, such as the Padua and IMPROVE scores, are mainly designed to estimate the risk of developing new VTE in hospitalized patients14. In contrast, the present combined index is intended for patients with imaging-confirmed VTE and is used to distinguish CRT from non-CRT VTE. Therefore, it should be regarded as a subtype-discrimination approach rather than a general VTE risk-assessment tool. The value of the present approach lies in combining two readily available clinical variables and providing a simple way to support subtype assessment after VTE has been confirmed.
The combined D-dimer and catheter indwelling index exhibited strong discriminative capacity to separate CRT from non-CRT lesions within patients already diagnosed with VTE (AUC = 0.82), overcoming the limitations of single indicators34,35. Kaplan-Meier analysis demonstrated that the 6-month VTE recurrence rate was 28.4% in the CVC group, significantly higher than 9.7% in the non-CVC group11,36. These differences may reflect the combined influence of catheter exposure and underlying clinical characteristics; however, causal mechanisms cannot be established from this observational study. Recurrent lesions in the CVC-exposed group are mainly distributed in the ipsilateral upper limb central vein, internal jugular vein, and subclavian vein, accounting for 65.6% of all recurrent cases. This distribution pattern may be related to local vascular changes associated with catheter exposure, although further studies are needed to clarify the mechanisms involved. Recurrent thrombi among patients without CVC exposure were primarily located in the lower-limb deep veins and pulmonary arteries, accounting for 90.6% of all recurrent events. This distribution may reflect differences in the clinical characteristics of recurrent VTE, but the reasons for these differences remain unclear. The observed distribution patterns may reflect differences between CRT and non-CRT VTE, but further investigation is required to clarify the biological basis of these findings. These observational findings provide only preliminary clinical insights for distinguishing VTE subtypes and cannot serve as evidence to support routine CRT screening or prolonged anticoagulation among patients with indwelling CVCs. There is an inherent structural bias when catheter indwelling time is used as a discriminant variable, creating circular reasoning tied to the definition of CRT itself. The diagnostic standard for CRT requires the simultaneous presence of an indwelling catheter and thrombus. Longer catheter retention time makes it far more likely to classify a thrombus as catheter-related, while patients without any CVC exposure naturally have zero catheter duration and are automatically defined as non-CRT cases. This indicator is only suitable for differentiating subtypes among individuals with confirmed VTE, and it cannot be used to screen for thrombosis risk before catheter placement or to identify thrombotic subtypes in patients without existing VTE lesions. For the reliable application of the combined index, several steps are essential. First, the patient should have imaging-confirmed VTE before the index is applied. Second, the D-dimer value should be obtained before thrombus confirmation and before CVC insertion. Third, catheter indwelling time should be determined from documented records of catheter placement and removal. These steps help ensure consistent application of the index across patients.
Several limitations should be considered in this single-center retrospective case-case comparative study of the epidemiological characteristics of VTE and CRT and their associated indicators. First, an independent external validation cohort was not available in this study. The identified indicators reflect differences between CRT and non-CRT among patients with confirmed VTE and should not be considered predictors of new CRT in all patients with CVCs. The combined index based on D-dimer and catheter indwelling time requires further validation in other populations. In addition, because catheter presence is part of the definition of CRT, the use of catheter indwelling time as a classification variable may introduce inherent bias. Therefore, this index is only applicable for distinguishing VTE subtypes after thrombosis confirmation and cannot be used for risk assessment before catheter placement. Second, the single-center design may limit the generalizability of the findings to other hospitals with different patient populations and clinical practices. Third, the retrospective design may have resulted in incomplete data collection, as some information, including catheter maintenance, anticoagulant dosage, treatment course, and patient compliance, was not fully recorded. Standardized data collection and clear criteria for handling missing or uncertain catheter-related information may improve the reproducibility of this approach in future studies. When essential information, such as baseline D-dimer values or catheter placement records, is unavailable, additional clinical review or exclusion from index assessment may help reduce misclassification. Fourth, the 6-month follow-up period was relatively short, and long-term outcomes such as recurrent VTE, post-thrombotic syndrome, and quality of life could not be evaluated. Fifth, this study did not compare different anticoagulant strategies or mechanical prophylaxis methods; therefore, the optimal preventive strategy could not be determined. Future studies should include multicenter cohorts with larger sample sizes to further validate these findings. A longer follow-up is also needed to evaluate long-term outcomes in patients with CVC-associated thrombosis. In addition, studies comparing different prevention strategies and exploring additional clinical or biological markers may help improve CRT subtype discrimination among patients with confirmed VTE.
The results of this study provide preliminary clinical references for the management of VTE and CRT in general hospitals. The identified subtype-associated indicators may support further assessment of patients with confirmed VTE, particularly those with malignant tumors, severe underlying diseases, and other high-risk characteristics. The combined index based on D-dimer and catheter indwelling time uses routinely available clinical parameters and predefined thresholds (D-dimer >0.5 mg/L FEU and catheter indwelling time >7 days), which may facilitate consistent application. However, this index is intended only to distinguish CRT from non-CRT VTE after confirmed thrombosis and should not be used for routine VTE screening or to guide specific anticoagulation strategies. Reproducibility depends on accurate documentation of D-dimer measurement timing, catheter placement and removal records, and imaging-confirmed VTE classification. Therefore, external validation and standardized implementation procedures are required before wider clinical application.
الإفصاحات
The authors declare no conflicts of interest.
Author Contributions:
Yumeng Yuan conceived and designed the study, collected and analyzed the data, drafted and revised the manuscript. Jiaxin Chen participated in data extraction, literature sorting, statistical result interpretation, and critically revised the manuscript. Yali Li took part in clinical case screening, imaging-based thrombus evaluation, data quality control, and reviewed the final manuscript. All authors read and approved the final submitted manuscript.
شكر وتقدير
The authors would like to express their sincere thanks to the technicians who contributed to this research. This research received no specific grant from any funding agency in the public, commercial, or not-for-profit sectors.
المواد
| الاسم | الشركة | رقم فهرسي | التعليقات |
|---|---|---|---|
| Central Venous Catheter (internal jugular / subclavian vein) | Teleflex Incorporated / Arrow International | CDC-45703-XP1A (Arrowg+ard Blue Plus, 3-lumen 7 Fr × 20 cm, pressure-injectable, antimicrobial) | For venous access via internal jugular or subclavian veins; included in CRT incidence analysis by insertion site |
| Coagulation Reagents (PT, APTT, TT) | Roche Diagnostics (Shanghai) Co., Ltd. | PT: 07153414190 (PT Rec, cassette 3×); APTT: 07153589190 (aPTT, cassette 3×); TT: cobas t 711 TT reagent | For evaluating blood coagulation function (PT, APTT, INR, TT); all reagents are original Roche reagents compatible with cobas t 711 closed system |
| D-Dimer Quantitative Detection Kit | Roche Diagnostics (Shanghai) Co., Ltd. | 07429410190 (Tina-quant D-Dimer Gen.2, cassette format) | For quantitative immunoturbidimetric detection of plasma D-Dimer concentration; cut-off value 0.5 mg/L FEU; compatible with cobas t 711 |
| Digital Subtraction Venography System | Shimadzu Corporation | Trinias F12 Digital Angiography System | For imaging confirmation of venous thrombosis; interventional angiography |
| Electronic Medical Record System | Winning Health Technology Group Co., Ltd. | WiNEX Smart Hospital Platform V5.5 | For collecting patient baseline data, clinical information, and follow-up records |
| Fully Automated Coagulation Analyzer | Roche Diagnostics (Shanghai) Co., Ltd. | cobas t 711 (Instrument catalog: 06355790001 / CN version: 10349280188) | For detection of PT, APTT, INR, and TT coagulation indicators; high-throughput fully automated coagulation system |
| Fully Automated Hematology Analyzer | Sysmex Corporation | XN-1000 (Model ID: XN-1000-100-R-01, with reticulocyte license) | For detection of white blood cell count, platelet count, and differential in routine blood tests; throughput up to 100 samples/hour |
| Graphing and Visualization Software | GraphPad Software, Inc. | GraphPad Prism 9.0 | For visualization of ROC curves and Kaplan-Meier survival curves; publication-quality graph output |
| Hematology Reagents (for XN-1000) | Sysmex Corporation | CELLPACK DCL (diluent); Stromatolyser-WDF (WBC differential lyse); Sulfolyser (HGB lyse); Fluorocell-WDF | Original Sysmex reagents for routine blood test on XN-1000; WBC differential by fluorescence flow cytometry, RBC/PLT by hydrodynamic focusing impedance |
| Laboratory Information System (LIS) | Shanghai Xinghe Software Co., Ltd. | XHLIS Clinical Laboratory Information System V5.0 | For collecting D-dimer, coagulation function (PT/APTT/INR/TT), and routine blood test results |
| Lower Extremity Venous Color Doppler Ultrasound System | Philips Healthcare (China) Co., Ltd. | EPIQ 7 (Product ID: HC795200) | For diagnosing deep vein thrombosis (DVT); real-time B-mode and color Doppler imaging |
| Peripherally Inserted Central Catheter (PICC) | BARD Access Systems / C.R. Bard, Inc. | 7617405 (Groshong NXT ClearVue PICC, 4 Fr single-lumen, basic tray) | For venous access via peripheral veins; included in CRT incidence analysis by insertion site |
| Picture Archiving and Communication System (PACS) | United Imaging Intelligence Co., Ltd. | uAI PACS System (AI-native) | For storage, retrieval and review of VTE imaging data (ultrasound, CTPA, venography) |
| Pulmonary Computed Tomography Angiography (CTPA) | Siemens Healthineers | SOMATOM Force Dual-source CT System | For diagnosing pulmonary embolism (PE); high-pitch dual-source CT angiography |
| Statistical Analysis Software | IBM Corporation | SPSS Statistics 26.0 | For univariate/multivariate Logistic regression, χ² test, independent-samples t-test, Kaplan-Meier survival analysis, and ROC curve analysis |
| Statistical Programming Language | Open-source Software (R Foundation for Statistical Computing) | R version 4.3.1 (N/A) | For DeLong test (ROC AUC comparison), multiple imputation by chained equations (MICE), and competing-risk Fine-Gray model fitting |
المراجع
- Wendelboe A, Weitz JI. Global health burden of venous thromboembolism. Arterioscler Thromb Vasc Biol. 2024;44(5):1007-1011.
- Brækkan SK, Hansen JB. VTE epidemiology and challenges for VTE prevention at the population level. Thromb Update. 2023;10:100132.
- Hu SS. Pulmonary embolism and deep venous thrombosis in China. J Geriatr Cardiol. 2024;21(8):775-778.
- Sridhar DC, et al. Central venous catheter-related thrombosis in children and adults. Thromb Res. 2020;187:103-112.
- King HL, et al. Unveiling the complexities of catheter-related thrombosis: risk factors, preventive strategies, and management. J Thromb Thrombolysis. 2025;58(3):443-457.
- Puri A, et al. The incidence and risk of venous thromboembolism associated with peripherally inserted central venous catheters in hospitalized patients: a systematic review and meta-analysis. Front Cardiovasc Med. 2022;9:917572.
- Kushner A, et al. Virchow Triad. In: StatPearls. Treasure Island (FL): StatPearls Publishing; 2024: https://www.ncbi.nlm.nih.gov/books/NBK539697/.
- López-Rubio M, et al. A comprehensive review of catheter-related thrombosis. J Clin Med. 2024;13(24):7818.
- Zhen K, et al. Evaluation of in-hospital venous thromboembolism prevention and management system using hospital-level metrics: a nationwide cross-sectional survey in China. J Patient Saf. 2022;18(3):e626-e632.
- Zhang J, et al. Appraising the quality standard of clinical practice guidelines related to central venous catheter-related thrombosis prevention: a systematic review of clinical practice guidelines. BMJ Open. 2024;14(3):e074854.
- Girardi L, et al. Catheter-related deep vein thrombosis: where are we at and where are we going Updates and ongoing unmet clinical needs. Eur J Clin Invest. 2025;55(1):e14311.
- Zhang N, et al. Quality appraisal of clinical guidelines for peripherally inserted central catheter-related thrombosis prophylaxis in patients: a systematic review. BMJ Open. 2024;14(11):e084330.
- Trabulsi N, et al. Caprini versus Padua venous thromboembolism risk assessment scores: a comparative study in hospitalized patients at a tertiary center. Saudi Med J. 2024;45(4):362-368.
- Hou Y, et al. Comparison of the PADUA and IMPROVE scores in assessing venous thromboembolism risk in 42,257 medical inpatients in China. J Thromb Thrombolysis. 2024;57:775-783.
- Sochet AA, et al. Thrombolytic instillation for central venous catheter dysfunction and venous thromboembolism risk among critically ill children. Semin Thromb Hemost. 2026;52(2):248-255.
- Lutsey PL, Zakai NA. Epidemiology and prevention of venous thromboembolism. Nat Rev Cardiol. 2023;20(4):248-262.
- Zhen K, et al. Epidemiology of pulmonary embolism in China, 2021: a nationwide hospital-based study. Lancet Reg Health West Pac. 2025;54:101258.
- Pastori D, et al. A comprehensive review of risk factors for venous thromboembolism: from epidemiology to pathophysiology. Int J Mol Sci. 2023;24(4):3169.
- Scheres LJ, van Hylckama Vlieg A, Cannegieter SC. Sex-specific aspects of venous thromboembolism: what is new and what is next Res Pract Thromb Haemost. 2022;6(4):e12722.
- Scheres LJ, et al. Endogenous sex hormones and risk of venous thromboembolism in young women. J Thromb Haemost. 2019;17(8):1297-1304.
- Akrivou D, et al. Pathophysiological aspects of aging in venous thromboembolism: an update. Medicina (Kaunas). 2022;58(8):1078.
- Cao J, et al. Risk factors associated with deep venous thrombosis in patients with different bed-rest durations: a multi-institutional case-control study. Int J Nurs Stud. 2021;114:103825.
- Wan T, Song J, Zhu D. Cancer-associated venous thromboembolism: a comprehensive review. Thromb J. 2025;23(1):35.
- Mizrachi A, et al. Chemotherapy-induced acute vascular injury involves intracellular generation of ROS via activation of the acid sphingomyelinase pathway. Cell Signal. 2021;82:109969.
- Rayamajhi S, et al. Venous thromboembolism risk assessment in hospitalized cancer patients: a single center study. Clin Appl Thromb Hemost. 2023;29:10760296231206808.
- Girardi L, et al. Updates in the incidence, pathogenesis, and management of cancer and venous thromboembolism. Arterioscler Thromb Vasc Biol. 2023;43(6):824-831.
- Wan R, et al. A six-year study of complications related to peripherally inserted central catheters: a multicenter retrospective cohort study in China. Perfusion. 2023;38(4):689-697.
- Boulet N, et al. Site-specific complications of central venous catheterization under systematic ultrasound guidance: a target trial emulation revisiting the 3SITES study. Crit Care. 2025;29:513.
- Li S, et al. Risk factors for central venous catheter-related thrombosis in hospitalized children: a single-center retrospective cohort study. Transl Pediatr. 2022;11(11):1840.
- Zhang X, Zhang R. Real-time ultrasound-guided subclavian vein cannulation: should it be the preferred method for central venous catheterization in critically ill Crit Care. 2025;29:541.
- Riva N, et al. Biomarkers for the diagnosis of venous thromboembolism: D-dimer, thrombin generation, procoagulant phospholipid and soluble P-selectin. J Clin Pathol. 2018;71(11):1015-1022.
- Kang J, et al. Validation of Michigan risk score and D-dimer to predict peripherally inserted central catheter-related thrombosis: a study of 206,132 catheter days. J Vasc Access. 2022;23(5):764-769.
- Vladic N, et al. Risk assessment and prevention of cancer-associated venous thromboembolism in ambulatory patients with solid malignancies. Res Pract Thromb Haemost. 2025;9(1):102664.
- Ma G, et al. Construction and validation of a nomogram prediction model for the catheter-related thrombosis risk of central venous access devices in patients with cancer: a prospective machine learning study. J Thromb Thrombolysis. 2025;58(2):220-231.
- Cohen AT, et al. D-dimer as a predictor of venous thromboembolism in acutely ill, hospitalized patients: a subanalysis of the randomized controlled MAGELLAN trial. J Thromb Haemost. 2014;12(4):479-487.
- Smit JM, et al. Incidence of catheter-related thrombosis and its association with outcome in critically ill patients: a prospective observational study. Thromb Res. 2024;241:109068.