This combined clinical and in vitro study evaluated miR‑136‑5p in children with severe pneumonia. Elevated miR‑136‑5p distinguishes children with severe pneumonia from healthy controls, is associated with composite adverse events, and promotes inflammatory responses in LPS-stimulated macrophages, partly through AGO1 repression.
مقالة بحثية
Clinical Diagnostic and Prognostic Evaluation of miR-136-5p in Children with Severe Pneumonia: A Case-Control and Cohort Study
في هذه المقالة
ملخص
الملخص
Severe pneumonia is a leading cause of childhood morbidity and mortality. MicroRNA‑136‑5p (miR‑136‑5p) plays critical roles in inflammatory diseases, yet its expression, clinical relevance, and regulatory mechanisms in children with severe pneumonia remain unclear. This study recruited 114 children with severe pneumonia and 106 healthy controls; peripheral blood miR‑136‑5p and Argonaute 1 (AGO1) were detected by quantitative real‑time polymerase chain reaction (qRT‑PCR). Receiver operating characteristic (ROC) curves, Kaplan‑Meier analysis, and multivariate Cox regression were used to evaluate diagnostic and prognostic values, whereas lipopolysaccharide (LPS)‑stimulated THP‑1 macrophages and dual‑luciferase reporter assays validated the targeting relationship between miR‑136‑5p and AGO1. Significant miR‑136‑5p upregulation was observed in patients, with favorable diagnostic efficacy (area under the curve [AUC] = 0.845). Its expression was positively correlated with white blood cell (WBC), neutrophil (NEU), procalcitonin (PCT), C‑reactive protein (CRP), brain natriuretic peptide (BNP), and D‑dimer, while negatively correlated with lymphocyte (LYM) levels. Higher miR-136-5p expression was independently associated with an increased risk of composite adverse events (hazard ratio [HR] = 4.198, P = 0.002). In vitro, miR‑136‑5p mimics enhanced LPS‑induced interleukin‑6 (IL‑6), tumor necrosis factor‑α (TNF‑α), and interleukin‑1β (IL‑1β) release and impaired cell viability, and inhibitors reversed these effects. AGO1 was confirmed as a direct target and was downregulated in patients and negatively correlated with miR‑136‑5p (r = -0.864), and AGO1 overexpression partially reversed miR‑136‑5p‑related reduced cell viability and inflammation. Collectively, miR‑136‑5p discriminates children with severe pneumonia from healthy controls. In LPS‑stimulated THP‑1‑derived macrophages, miR‑136‑5p promotes inflammation by targeting AGO1, and the miR‑136‑5p/AGO1 axis warrants further mechanistic and pre‑clinical investigation.
المقدمة
Severe pneumonia remains one of the leading causes of morbidity and mortality in children worldwide, imposing a substantial burden on global healthcare systems and family well-being1. The pathophysiological mechanisms of childhood severe pneumonia, which involve excessive systemic inflammatory responses, impaired immune regulation, and potential extrapulmonary complications, are complex and not yet fully understood2. Despite significant advances in antimicrobial therapy and supportive care, early diagnosis of severe pneumonia and accurate prediction of disease progression remain clinically challenging3. Traditional inflammatory biomarkers such as C-reactive protein (CRP), procalcitonin (PCT), and white blood cell (WBC) count often lack sufficient sensitivity and specificity for early risk stratification, highlighting an urgent need to identify novel, reliable diagnostic and prognostic biomarkers4.
As key regulators of gene expression, microRNAs (miRNAs) are frequently dysregulated and extensively involved in the pathological processes of various inflammatory lung diseases5. Accumulating evidence demonstrates that miRNAs play critical roles in respiratory disorders such as pneumonia, asthma, and chronic obstructive pulmonary disease by regulating inflammatory responses and related signaling pathways6,7. For instance, miR-26a has been shown to participate in inflammatory regulation in these diseases by targeting pathways including Notch, Wnt, and hypoxia-inducible factor 1-alpha (HIF-1α)8. In sepsis-associated acute lung injury, the circAGFG1/miR-195-5p/PD-L1 axis has been confirmed to modulate cytokine secretion and epithelial cell survival, highlighting the important role of non-coding RNAs in pulmonary inflammation9. Among various miRNAs, miR-136-5p has been validated to play a pivotal role in inflammatory regulation. In asthma models, for example, it promotes pyroptosis of airway epithelial cells and exacerbates inflammatory responses by regulating the LIFR/NF-κB axis10. Additionally, its dysregulation is associated with disrupted cellular behaviors such as migration and proliferation in sepsis and other conditions11. Collectively, these studies indicate that miR-136-5p exerts important functions in inflammatory diseases. However, the expression profile, clinical significance, and specific regulatory mechanisms of miR-136-5p in pediatric severe pneumonia remain unclear and require further investigation.
Argonaute 1 (AGO1), a core component of the RNA-induced silencing complex, plays a critical role in miRNA-mediated gene silencing and is involved in regulating immune cell activation and related physiological processes12. Bioinformatics analysis suggests that AGO1 may be a direct target gene of miR-136-5p, but the interaction between the two in severe pneumonia and their potential regulatory relationship in severe pneumonia remains unclear. Accordingly, it was hypothesized that miR-136-5p is associated with severe pneumonia in children and may modulate inflammatory responses through AGO1, while also showing potential as a candidate biomarker for diagnostic and prognostic evaluation. To investigate this hypothesis, the present study compares the peripheral blood expression levels of miR-136-5p between children with severe pneumonia and healthy controls to evaluate its diagnostic and prognostic value. Subsequently, the targeting relationship between miR-136-5p and AGO1 is validated via dual-luciferase reporter assays and cellular experiments, and the regulatory role of the miR-136-5p/AGO1 axis in lipopolysaccharide (LPS)-induced THP-1 macrophage viability is further explored. Overall, this study is designed to conduct an exploratory investigation of the molecular mechanisms underlying severe pneumonia in children and to preliminarily identify candidate molecules for further diagnostic and mechanistic validation.
البروتوكول
This study aimed to explore the diagnostic and prognostic value of circulating miR‑136‑5p in children with severe pneumonia. The study was approved by the Ethics Committee of Nantong First People’s Hospital (Approval No. 2026-KT306-01), and written informed consent was obtained from the guardians of all participants.
Subjects and sample collection
The study involved 114 children with severe pneumonia admitted to the Nantong First People's Hospital from March 2021 to March 2024, forming the severe pneumonia group. A control group of 106 healthy children undergoing routine check-ups during this period was also included. The control group was frequency‑matched to the severe pneumonia group by age and sex distributions. Patients were diagnosed with severe pneumonia based on the Pediatric Infectious Diseases Society (PIDS) and Infectious Diseases Society of America (IDSA) pediatric community-acquired pneumonia (CAP) guidelines, requiring either one major criterion (e.g., septic shock with vasopressor use or respiratory failure requiring invasive mechanical ventilation) or at least three minor criteria (including tachypnea, hypoxemia, multilobar infiltrates, altered mental status, azotemia, or hypotension needing aggressive fluid resuscitation)13. Healthy controls had no lung infections, inflammatory diseases, immune dysfunction, or major organ diseases. The study excluded those with congenital, hereditary, or immunodeficiency diseases; acute cardio-cerebrovascular diseases, cancer, or other infections; recent major surgery, severe trauma, or immunosuppressive therapy; and incomplete data or inability to follow up.
Within 24 h of admission, 5 mL of fasting venous blood was collected from each subject. Fasting blood sampling was performed to minimize pre‑analytical variability caused by postprandial lipemia, glycemic fluctuations, and diet‑related shifts in circulating miRNA profiles, thus ensuring the comparability of test results across all participants. This fasting protocol is consistent with routine clinical laboratory practice, and the small collection volume poses no adverse health effects on children. Blood samples were collected in ethylenediaminetetraacetic acid (EDTA) tubes and centrifuged within 2 h of collection at 3000 × g for 10 min at 4 °C to separate plasma. The plasma was then aliquoted, stored at -80 °C, and kept from freeze-thaw cycles.
Study endpoints
The primary prognostic time‑to‑event endpoint was defined as the time from study enrollment to the occurrence of composite adverse events within the 28‑day follow‑up window. Composite adverse events were defined as clinical deterioration or death. A shorter time to composite adverse events indicates earlier occurrence of poor clinical outcomes. Participants who did not experience composite adverse events during the 28‑day follow‑up, including those with clinical improvement and those with no improvement, were treated as right‑censored observations. Outcome adjudication was performed by a comprehensive review of retrospective medical records. Clinical deterioration was defined as worsening respiratory symptoms and progressive pulmonary infiltrates on imaging. Clinical improvement was determined by sustained normalization of axillary temperature, obvious relief of respiratory symptoms documented in medical charts, and substantial radiological absorption of pulmonary infiltrates. Two radiologists performed radiographic assessment blinded to participants’ miRNA levels. Any discrepancies in adjudication were resolved by consensus with an additional senior‑attending physician.
Quantitative real-time polymerase chain reaction (qRT-PCR) assay
Total RNA was extracted from samples using a total RNA extraction reagent. cDNA was synthesized via reverse transcription using a microRNA reverse‑transcription reagent kit. With cDNA as the template and SYBR‑green‑based quantitative PCR master mix, real‑time fluorescent quantitative PCR amplification was performed on a real‑time fluorescent quantitative PCR instrument. The cycle threshold (Ct) was automatically determined by the instrument software, with the fluorescence threshold set at 10 times the standard deviation of the baseline fluorescence signal. Amplification efficiencies of all primer sets were validated in advance via standard curve assays, with efficiencies ranging from 92% to 105%. U6 small nuclear RNA was selected as the endogenous reference gene for miRNA quantification, as it is a well‑established reference for circulating miRNA analysis, supported by classic published studies14,15. The primer sequences used for qRT-PCR were as follows: miR-136-5p forward: 5’-ACTC CATTTGTTTTGATGATGGA-3’, universal reverse primer: 5’-ATCCAGTGCAGGGTCCGAGG-3’; U6 forward: 5’-CTCGCTTCGGCAGCACA-3’, U6 reverse: 5’-AACGCTTCACGAATTTGCGT-3’; AGO1 forward: 5’-AGATGGAGTGGATGATGCTGA-3’, AGO1 reverse: 5’-TCCTTCACATAGCTGGCTGAG-3’; GAPDH forward: 5’-GGAGCGAGATCCCTCCAAAAT-3’, GAPDH reverse: 5’-GGCTGTTGTCATACTTCTCATGG-3’. The relative expression levels of miR-136-5p (internal reference gene: U6; human-derived, miRBase Accession No.: MIMAT0000448) and AGO1 (internal reference gene: GAPDH) were detected separately, and the results were calculated using the 2^(-ΔΔCt) method. Each sample was tested in three technical replicates, and the assay was independently repeated at least three times. No‑template controls were included in every PCR run to rule out reagent contamination, and the coefficient of variation of Ct values among technical replicates was required to be <2% for data inclusion.
Cell culture and inflammation model establishment
The THP-1 human monocyte-macrophage cell line was procured from a public cell repository. THP-1 cells were selected for constructing the pneumonia inflammation model because they can be efficiently induced into functional human macrophages by phorbol 12-myristate 13-acetate (PMA), with phenotypic and functional characteristics highly consistent with primary human peripheral blood macrophages16. Additionally, LPS‑stimulated THP‑1‑derived macrophages represent a widely adopted in vitro tool to dissect macrophage‑mediated inflammatory signaling relevant to bacterial pneumonia17.
The cells were cultured in RPMI-1640 medium, supplemented with 10% fetal bovine serum, 100 U/mL penicillin, and 100 μg/mL streptomycin. They were consistently maintained in a humidified incubator at 37 °C with 5% CO₂. Before formal modeling, LPS concentration gradient pre-experiments were conducted using the CCK-8 assay to verify cell viability and screen the sublethal concentration; 1 μg/mL LPS was confirmed as a sublethal concentration, which was also consistent with the concentration widely used in relevant published studies for macrophage inflammatory model construction18. Cells in the logarithmic growth phase were seeded into 6-well plates at a density of 5 × 10⁵ cells/well. After 24 h of adherence, PMA was added to the culture medium at a final concentration of 100 ng/mL to induce differentiation of THP-1 monocytes into mature macrophages. Subsequently, LPS was introduced to achieve a final concentration of 1 μg/mL, and the culture was sustained for 24 h to establish an in vitro inflammation model. Finally, the cell culture supernatant was collected, and the concentrations of inflammatory cytokines (IL-6, TNF-α, IL-1β) were quantified using enzyme-linked immunosorbent assay (ELISA) kits to confirm the successful establishment of the model.
Cell transfection
The human monocyte-macrophage cell line THP-1 was seeded in 6-well plates at a density of 5 × 10⁵ cells per well, and transfection was performed according to different experimental groups using the following protocols: hsa‑miR‑136‑5p mimic (5′‑CAUCAUCAAAACAAAUGGAGUTT‑3′), hsa‑miR‑136‑5p inhibitor (5′‑UCCAUCAAAACAAAUGGAGU‑3′) and their matched negative controls were transfected at a final concentration of 15 nM with a lipid‑based transfection reagent following the manufacturer’s instructions; AGO1-overexpressing adenoviruses and empty vector controls were transfected at a multiplicity of infection (MOI) of 50. For AGO1 knockdown experiments, small‑interfering RNA targeting AGO1 (si‑AGO1) and non‑targeting negative‑control siRNA (si‑NC) were transfected into PMA‑differentiated THP‑1 macrophages at a final concentration of 40 nM using the same lipid‑based transfection reagent. After transfection, the cells were further cultured for 24 h and subsequently subjected to cell viability assays, inflammatory cytokine secretion detection, and target gene expression validation.
Cell counting Kit-8 (CCK-8)
Cell viability was measured using a CCK-8 kit following the manufacturer’s standard protocol. Briefly, cells were seeded into 96-well plates at a density of 5 × 10³ cells per well in 100 μL of complete culture medium, and incubated at 37 °C in a humidified 5% CO₂ incubator under designated experimental conditions. At the preset time points, 10 μL of CCK-8 reagent was gently added to each well to avoid cell disturbance, followed by further incubation at 37 °C for 2 h, protected from light. The absorbance at 450 nm was detected using a multifunctional microplate reader. Relative cell viability was calculated by comparing the absorbance signal of each treatment group to the mean absorbance signal of the untreated control group within each independent experiment, and expressed as percentages. Each experimental group contained three technical replicates per assay, and all viability assays were independently repeated at least three times.
Detection of inflammatory cytokines
Cell culture supernatants were harvested at the indicated time points, centrifuged at 1000 × g for 5 min at 4 °C to remove cellular debris, aliquoted, and stored at -80 °C to avoid repeated freeze-thaw cycles. Concentrations of IL-6, TNF-α, and IL-1β were quantified using commercial ELISA kits according to the manufacturer’s protocols; briefly, serially diluted reference proteins were used to generate a standard curve, 100 μL of standards and samples were loaded in triplicate into precoated plates, incubated, washed, incubated with HRP-conjugated detection antibody, developed with substrate in the dark, and stopped with sulfuric acid, after which absorbance was read at 450 nm with a microplate reader and sample concentrations were calculated via four-parameter logistic interpolation. All assays were performed with three technical replicates and independently repeated at least three times as biological replicates.
Bioinformatics analysis
Potential target genes of miR-136-5p were predicted using four online databases: Starbase, miRDB, miRWalk, and TargetScan. The intersection of the prediction results from these four databases was used to identify candidate target genes. Gene Ontology (GO) enrichment analysis of the candidate target genes was conducted via the Metascape database.
To objectively prioritize candidates, a two‑step screening strategy based on public database annotations was applied. First, functional relevance screening was conducted guided by the GO enrichment analysis: priority was assigned to genes annotated to be involved in innate immune response, inflammatory cytokine production, and macrophage activation, whereas genes only associated with basic housekeeping processes, neurodevelopment, or other functions unrelated to pulmonary inflammation were excluded from priority validation. Subsequently, targeting reliability was evaluated based on TargetScan annotations, including the number of conserved binding sites, site type (8mer, 7mer‑m8, and 7mer‑A1), and sequence conservation. Following this two‑step objective screening, AGO1 exhibited the highest targeting reliability among all immune‑related candidates and was therefore selected as the key target for subsequent functional verification.
Dual-Luciferase reporter assay
The wild‑type (WT) AGO1 3′‑UTR fragment containing the 8‑mer seed‑matching site (positions 3411–3418) for hsa‑miR‑136‑5p and its mutant (MUT) reporter were synthesized and subcloned into a dual‑luciferase reporter vector. The 8‑nucleotide seed‑matching site was subjected to full complementary transversion, changing the sequence from AAUGGAGA to UUACCUCU, to disrupt complementarity to the seed region of hsa‑miR‑136‑5p, while flanking sequences remained unmodified. All constructs were verified by Sanger sequencing. WT‑AGO1 or MUT‑AGO1 vectors were co‑transfected into HEK293T cells together with miR‑136‑5p mimics or a negative control. At 48 h post‑transfection, firefly luciferase activity and Renilla luciferase activity were measured using a dual‑luciferase reporter assay kit and a multifunctional microplate reader. Renilla luciferase activity was used as an internal reference to calculate the relative luciferase activity. The reporter assay was repeated in at least three independent experiments.
Statistical analysis
Statistical analyses were performed using commercial statistical analysis software packages. Normally distributed continuous data are presented as mean ± standard deviation (SD), while non‑normally distributed continuous data are presented as median (25th, 75th percentile). Categorical data are presented as counts. For clinical data involving only two groups, the two‑tailed Mann‑Whitney U nonparametric test was applied for continuous variables, while categorical data were compared using the chi‑square (χ2) test. To evaluate the diagnostic value of miR-136-5p for children with severe pneumonia, receiver operating characteristic (ROC) curve analysis was performed, and the area under the curve (AUC), sensitivity, and specificity were calculated. The optimal cut‑off value was determined based on the maximum Youden index criterion. The 95% Wilson‑score confidence intervals for sensitivity and specificity were computed. Pearson correlation was adopted for normally distributed variables (BNP and D‑dimer), whereas Spearman's rank correlation was used for the remaining variables. Kaplan‑Meier time‑to‑event analysis coupled with the log‑rank test was applied to compare the cumulative incidence of composite adverse events. The study endpoint was composite adverse events. Subjects experiencing composite adverse events were coded as event = 1, and those without composite adverse events at day 28 were treated as right‑censored. For screening variables independently associated with composite adverse events, a multivariate Cox proportional‑hazards regression model was constructed according to the following procedures. A total of 11 candidate variables were initially considered based on established clinical relevance to pediatric severe pneumonia prognosis, including 3 demographic factors (gender, age, and BMI) and 8 laboratory biomarkers (miR-136-5p, WBC, NEU, LYM, PCT, CRP, BNP, and D-dimer). First, potential confounding variables were preliminarily screened by univariable Cox regression. Variance inflation factor (VIF) was applied to assess multicollinearity among candidate variables, where VIF > 10 indicated severe multicollinearity. WBC and lymphocyte (LYM) were excluded owing to severe multicollinearity (WBC: VIF = 13.27; LYM: VIF = 11.89), leaving 9 variables for univariable Cox regression screening. Variables with P < 0.05 in univariable analysis were retained for multivariable modeling. miR‑136‑5p expression was Z‑score standardized and entered into the regression models as a continuous variable, with hazard ratios interpreted as the change in risk per 1‑standard‑deviation increase in expression. Finally, 6 variables were retained in the final multivariable Cox model, with an events-per-variable (EPV) ratio of 6.5 (39 events / 6 variables). Covariate selection was guided by clinical rationale: inflammatory biomarkers (NEU, PCT, CRP) reflect systemic inflammatory burden and bacterial infection severity; BNP indicates secondary cardiac dysfunction induced by severe pulmonary infection; D-dimer reflects coagulation activation and thromboembolic risk. The prognostic value of these biomarkers in pediatric severe pneumonia has been comprehensively reviewed19. For in vitro cellular experiments, the independent‑samples t‑test was used for two‑group comparisons. For three or more groups, one‑way ANOVA with Tukey’s post‑hoc test was applied for single‑factor designs, and two‑way ANOVA for two‑factor designs. For clinical data, “n” indicates the number of independent participants enrolled in each group. For in vitro cellular experiments, “n” indicates the number of independent biological replicates for each experimental condition. A two‑tailed P < 0.05 was regarded as statistically significant.
النتائج
Analysis of clinical baseline data
A total of 106 healthy individuals and 114 children with severe pneumonia were enrolled in this study. There were no statistically significant differences in gender distribution, age, or body mass index (BMI) between the two groups (all P > 0.05), indicating balanced baseline characteristics and good comparability (Table 1). This reduces the potential interference of these confounding factors on subsequent indicator differences.
However, compared to healthy individuals, children with severe pneumonia showed significantly higher levels of WBC, neutrophil count (NEU), PCT, and CRP (all P < 0.001), while LYM was notably decreased (P < 0.001). These findings demonstrate that children with severe pneumonia undergo a strong systemic inflammatory response, which may be accompanied by immune dysfunction. Additionally, the significant increases in brain natriuretic peptide (BNP) and D-dimer (D-D) levels in the patient group (both P < 0.001) suggest that severe pneumonia can affect cardiac function, indicating that the disease extends beyond pulmonary inflammation alone.
Clinical value of miR-136-5p in children with severe pneumonia
Results showed that miR‑136‑5p expression was significantly upregulated in children with severe pneumonia compared with healthy individuals, with a Hodges‑Lehmann median difference of 0.290 (95% CI: 0.233–0.332, P < 0.001) (Figure 1A). Subsequently, ROC curve analysis was performed to evaluate its diagnostic value, which revealed that miR-136-5p exhibited favorable discriminatory efficacy for childhood severe pneumonia compared with healthy controls [AUC = 0.845, 95% CI = 0.795–0.895, optimal cut‑off = 1.245, Youden index = 0.536, sensitivity = 64.9%, specificity = 88.7%, positive likelihood ratio (LR+) = 5.73, negative likelihood ratio (LR−) = 0.4] (Figure 1B).
To clarify the association between miR-136-5p and disease-related indicators, further correlation analysis was conducted between miR-136-5p expression and clinical parameters in children with severe pneumonia. As shown in Table 2, miR-136-5p expression in the peripheral blood of patients was significantly correlated with core clinical inflammatory and functional indicators, specifically exhibiting a positive correlation with WBC (r = 0.803), NEU (r = 0.832), PCT (r = 0.718), CRP (r = 0.829), BNP (r = 0.661), and D‑dimer (r = 0.710) levels, as well as a negative correlation with LYM (r = -0.826) (all P < 0.05).
Patients were stratified into low-expression and high-expression groups based on the median miR-136-5p level. Kaplan‑Meier time‑to‑event analysis demonstrated that individuals in the high‑expression group experienced significantly earlier composite adverse events compared with those in the low‑expression group (Log Rank P = 0.0369, Figure 1C). Univariable Cox regression was performed for all candidate variables, and variables with P < 0.05 were included in the multivariable Cox model. As shown in Table 3, univariable analysis revealed that miR‑136‑5p, NEU, PCT, BNP, D‑dimer, and CRP were significantly associated with composite adverse events. After multivariable adjustment, Z‑score‑standardized miR‑136‑5p, interpreted as a 1‑SD increase in expression, remained an independent prognostic predictor of composite adverse events among children with severe pneumonia (HR = 4.198, 95% CI = 1.657–10.640, P = 0.002) (Figure 1D).
Collectively, these findings suggest that miR‑136‑5p may have discriminatory potential for severe pneumonia compared with healthy controls. Elevated miR‑136‑5p expression is independently associated with composite adverse events, and its expression provides information relevant to clinical prognosis.
Effects of miR-136-5p on inflammation and cell viability of THP-1 macrophages
An in vitro inflammatory model was established using THP-1 macrophages, with inflammation induced by LPS. Compared with the control group, LPS stimulation significantly increased the concentrations of IL-6, TNF-α, and IL-1β in the cell supernatant (Figure 2A), confirming the successful establishment of the LPS-induced inflammatory model. To investigate the biological function of miR-136-5p in this inflammatory model, the efficacy of the cell transfection system was first verified. Results showed that miR-136-5p expression was already significantly upregulated in cells after LPS stimulation. Accordingly, transfection with miR-136-5p mimics increased its expression, whereas inhibitors decreased it (Figure 2B), confirming the efficacy and reliability of the transfection system.
Cell viability assay results demonstrated that LPS stimulation significantly reduced the viability of THP-1 cells. Transfection with miR-136-5p mimics further reduced cell viability, while transfection with inhibitors partially reversed the LPS-induced decrease in cell viability (Figure 2C), suggesting that miR-136-5p can enhance the LPS-associated reduction in cell viability on THP-1 cells. Further detection of inflammatory factor secretion levels confirmed that compared with the LPS group, transfection with miR-136-5p mimics significantly promoted the release of TNF-α, IL-6, and IL-1β from LPS-treated cells. In contrast, transfection with miR-136-5p inhibitors effectively suppressed the secretion of these pro-inflammatory factors (Figure 2D–F). These results indicate that miR-136-5p exerts a pro-inflammatory regulatory role in the LPS-induced inflammatory response of THP-1 macrophages.
miR-136-5p regulates cell viability via targeted inhibition of AGO1 in THP-1 cells
To systematically identify the downstream targets of miR-136-5p, potential target genes were predicted using four independent databases. The intersection of these predictions yielded 39 common candidate targets (Figure 3A). GO enrichment analysis was performed on these in silico predicted candidate genes to characterize their putative functional distribution (Figure 3B). Core functional terms closely associated with inflammatory regulation and miRNA action mechanisms served as the functional criteria for subsequent candidate prioritization: kinase binding, ubiquitin‑like protein ligase activity, mRNA metabolic processes, and intracellular receptor signaling pathway.
Based on the functional annotation combined with TargetScan-assessed targeting reliability, AGO1 was selected as the priority target for experimental validation. In silico prediction from TargetScan revealed that the 3’ untranslated region of AGO1 harbors two evolutionarily conserved binding sites for miR‑136‑5p, including one canonical 8mer site and one 7mer‑m8 site, with a total context++ score of −0.10, indicating a specific and evolutionarily conserved targeting interaction between the two. A dual-luciferase reporter assay confirmed that miR-136-5p directly binds to the 3'-UTR of AGO1, as miR-136-5p mimics significantly reduced luciferase activity of the wild-type AGO1 reporter but not the mutant construct (Figure 4A). The regulatory relationship was further validated at the cellular level. Detection of target gene expression revealed that AGO1 expression in THP-1 cells was significantly decreased following LPS stimulation. Transfection with miR-136-5p mimics further downregulated AGO1 expression, whereas transfection with miR-136-5p inhibitors reversed this effect (Figure 4B). These results indicate that miR-136-5p can target and suppress AGO1 expression.
To clarify the clinical relevance of this regulatory axis, analysis of clinical samples demonstrated that AGO1 expression was significantly lower in children with severe pneumonia compared to healthy controls, with a Hodges‑Lehmann median difference of −0.390 (95% CI: −0.418 to −0.361, P < 0.001) (Figure 4C). Moreover, AGO1 expression showed a significant negative correlation with miR-136-5p levels (r = -0.864, P < 0.001; Figure 4D), providing further evidence for the targeted regulation of AGO1 by miR-136-5p in the clinical context. To confirm that miR-136-5p exerts its biological function by targeting AGO1, a rescue experiment was conducted. Results showed that cell viability was significantly reduced in the LPS + miR-136-5p mimic group, while overexpression of AGO1 effectively reversed this cell viability effect (Figure 4E). In line with these findings, the secretion levels of pro-inflammatory factors (TNF-α, IL-6, and IL-1β) were markedly elevated in the LPS + miR-136-5p mimic group, and this pro-inflammatory phenotype was significantly attenuated by AGO1 overexpression (Figures 4F–H). We next examined whether silencing endogenous AGO1 could fully recapitulate the cellular phenotypes induced by miR-136-5p overexpression. Under LPS challenge, AGO1 knockdown significantly decreased THP-1 cell viability and increased the production of TNF-α, IL-6, and IL-1β compared with the si-NC control (Figures 4I–L). Importantly, when comparing the two independent transfection systems, the magnitude of cell viability and inflammatory response triggered by AGO1 silencing was consistently less pronounced than that observed in miR-136-5p-mimic-transfected cells, suggesting that AGO1 downregulation partially, but not entirely, accounts for the pro-inflammatory effects of miR-136-5p.
Collectively, the results of this investigation indicate that miR‑136‑5p exhibits discriminatory capacity to distinguish children with severe pneumonia from healthy controls, and its expression is informative for clinical prognosis. Its upregulated expression serves as an independent prognostic predictor of composite adverse events in children with severe pneumonia. Mechanistically, the findings suggest that miR‑136‑5p promotes inflammatory responses and reduced cell viability in LPS‑challenged THP‑1‑derived macrophages at least partially by targeting AGO1. These findings highlight the miR‑136‑5p/AGO1 regulatory pathway as one candidate for further therapeutic‑oriented investigation.
DATA AVAILABILITY:
All raw data derived from clinical samples and cell experiments supporting the findings of this study are included within Supplementary File 1. The public databases utilized in this work are available at the following URLs: TargetScanHuman v8.0: https://www.targetscan.org/vert_80/; miRDB: https://mirdb.org/index.html; miRWalk: http://mirwalk.umm.uni‑heidelberg.de/; ENCORI: https://rnasysu.com/encori/index.php; Metascape: https://metascape.org/gp/#/main/step1.
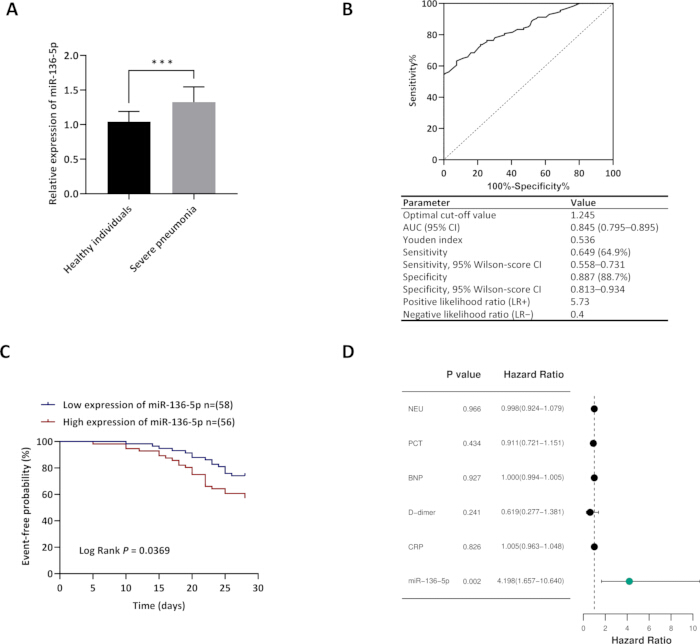
Figure 1: Expression, diagnostic efficacy, and prognostic value of miR-136-5p in childhood severe pneumonia. (A) Relative expression levels of miR-136-5p in peripheral samples from healthy individuals (n = 106) and children with severe pneumonia (n = 114). Two‑tailed Mann‑Whitney U test, ***P < 0.001. (B) ROC curve evaluating the discriminatory performance of miR-136-5p in children with severe pneumonia compared with healthy controls. The embedded table below the curve summarizes key diagnostic indices, including optimal cut‑off value, AUC, Youden index, sensitivity, specificity, their corresponding 95% Wilson‑score confidence intervals, and likelihood ratios. (C) Kaplan‑Meier time‑to‑event analysis for composite adverse events stratified by miR‑136‑5p expression levels (low-expression group, n = 58; high-expression group, n = 56). Event‑free probability denotes the probability of remaining free from composite adverse events (clinical deterioration or death). (D) Forest plot of multivariate Cox proportional‑hazards regression for composite adverse events. Hazard ratios (HRs) and corresponding 95% confidence intervals are displayed. An HR > 1 indicates an increased risk of composite adverse events. A P value < 0.05 was considered statistically significant. Please click here to view a larger version of this figure.
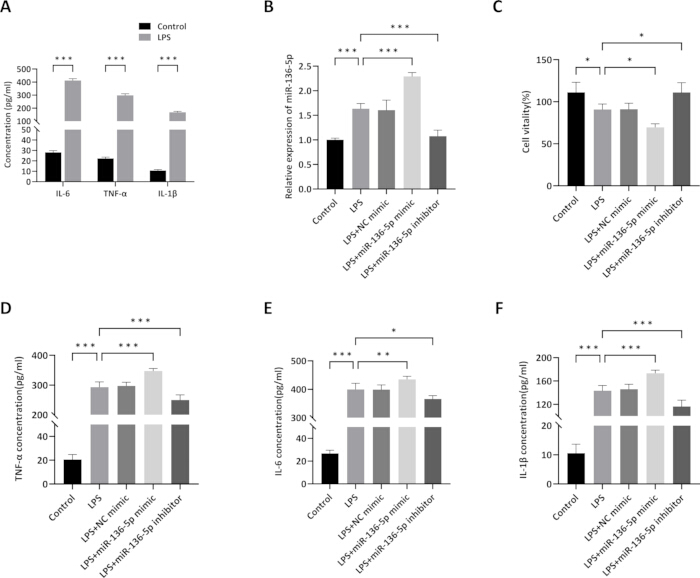
Figure 2: Regulatory effects of miR-136-5p on inflammation and cell viability in LPS-induced THP-1 macrophages. (A) Concentrations of IL-6, TNF-α, and IL-1β in the supernatant of THP-1 macrophages from the control group and LPS-stimulated group. (B) Relative expression levels of miR-136-5p in different treatment groups measured by qRT-PCR. (C) Viability of THP-1 macrophages in different treatment groups assessed by CCK-8 assay. (D–F) Concentrations of TNF-α, IL-6, and IL-1β in the supernatant of THP-1 macrophages across different treatment groups were measured by ELISA. Data are presented as mean ± SD. An independent-samples t-test was used for two-group comparisons, whereas a one‑way ANOVA followed by Tukey’s post‑hoc test was adopted for multi‑group comparisons. n ≥ 3; ***P < 0.001, **P < 0.01, *P < 0.05. Please click here to view a larger version of this figure.
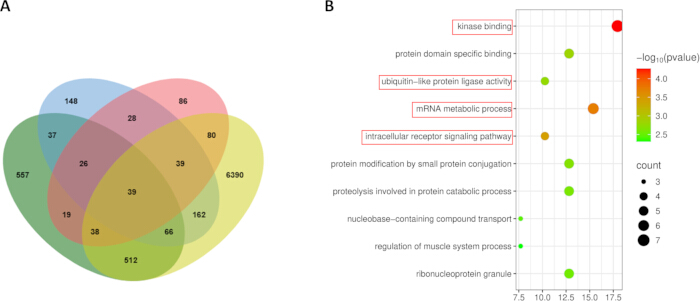
Figure 3: Validation analysis of miR-136-5p targeting AGO1. (A) Venn diagram illustrating the overlap of miR-136-5p target genes predicted by the StarBase, miRDB, miRWalk, and TargetScan databases. (B) Bubble plot depicting GO enrichment analysis of the 39 target genes. Please click here to view a larger version of this figure.
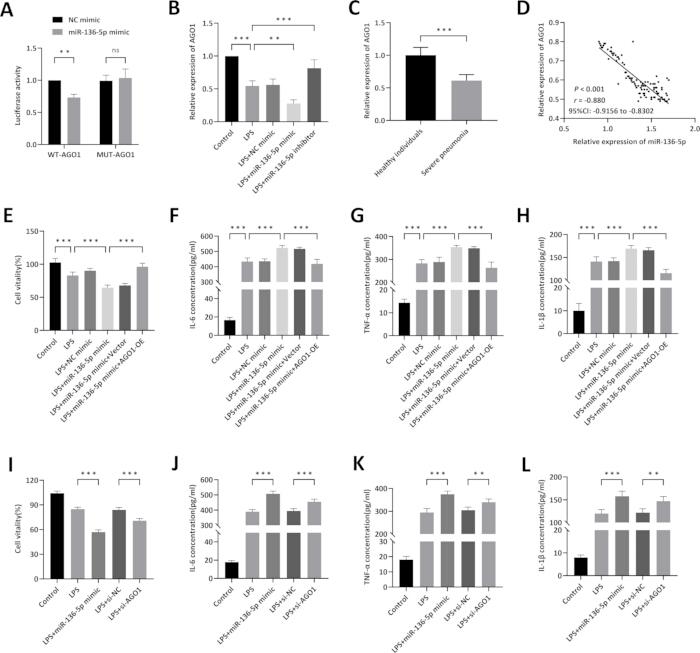
Figure 4: Functional analysis of miR-136-5p targeting AGO1. (A) Validation of the binding interaction between miR-136-5p and AGO1 using a dual-luciferase reporter assay. (B) Relative expression levels of AGO1 in different treatment groups measured by qRT-PCR. (C) Relative expression levels of AGO1 in healthy individuals and children with severe pneumonia, determined by qRT-PCR. (D) Correlation scatter plot of miR-136-5p and AGO1 expression in children with severe pneumonia. (E) Functional rescue experiment assessing the effect of AGO1 overexpression on miR-136-5p-induced changes in THP-1 cell viability. (F–H) Functional rescue experiments assessing the effects of AGO1 overexpression on miR‑136‑5p‑induced alterations in the secretion levels of inflammatory factors (TNF‑α, IL‑6, and IL‑1β) in THP‑1 cell culture supernatants, as determined by ELISA. (I) Experiment assessing the effect of AGO1 knockdown on THP‑1 cell viability under LPS stimulation. (J–L) Experiments assessing the effects of AGO1 knockdown on the secretion levels of inflammatory factors (TNF‑α, IL‑6, and IL‑1β) in LPS‑treated THP‑1 cell culture supernatants, as determined by ELISA. Data are presented as mean ± SD; n ≥ 3; ***P < 0.001, *P < 0.05, ns, no significant difference. Two‑way ANOVA was used for panel A; two‑tailed non‑parametric Mann‑Whitney U test for panel C; one‑way ANOVA followed by Tukey’s post‑hoc test for panels B, E–L. Spearman’s correlation analysis was performed for panel D. Please click here to view a larger version of this figure.
Table 1: Comparison of clinical data between children with severe pneumonia and healthy individuals. BMI, body mass index; WBC, white blood cell; NEU, neutrophil count; LYM, lymphocyte count; PCT, procalcitonin; CRP, C-reactive protein; BNP, brain natriuretic peptide. Categorical variables (gender, age) were compared using the χ2 test. Continuous variables were presented as median (25th, 75th percentile) and compared by the Mann‑Whitney U test. The Hodges‑Lehmann median difference with 95% confidence interval (CI) was reported only for variables with statistically significant between‑group differences (P < 0.05). Please click here to download this file.
Table 2: Correlation between miR-136-5p and clinical characteristics. Normality was tested using the Kolmogorov–Smirnov (K‑S) test. BNP and D‑dimer followed a normal distribution and were analyzed by Pearson correlation. All other variables were analyzed by Spearman's rank correlation. Separate columns present the lower and upper bounds of 95% confidence intervals for correlation coefficients. Abbreviations: BMI = body mass index; WBC = white blood cell; NEU = neutrophil count; LYM = lymphocyte; PCT = procalcitonin; BNP = brain natriuretic peptide; D-D = D-dimer; CRP = C-reactive protein. Please click here to download this file.
Table 3: Univariable and multivariable Cox proportional‑hazards regression analyses for composite adverse events. HR, hazard ratio; CI, confidence interval. Event: composite adverse events defined as clinical deterioration or death within the 28‑day follow‑up window. miR-136-5p expression was Z-score standardized and modeled as a continuous variable; HR corresponds to the risk change per 1-standard-deviation increase in miR-136-5p expression. Variables with P < 0.05 in univariable Cox regression were entered into the multivariable Cox model. The proportional-hazards assumption was verified using the time-dependent covariate test. Total participants n = 114, total events = 39, censored observations = 75. A total of 9 candidate variables were subjected to univariable Cox regression screening, and 6 variables were included in the final multivariable model, yielding an events-per-variable (EPV) ratio of 6.5. Please click here to download this file.
Supplementary File 1: Raw data supporting the clinical and experimental analyses. Please click here to download this file.
المناقشة
One key finding emerging from this study is that miR‑136‑5p is significantly upregulated in the peripheral blood of children with severe pneumonia and exhibits discriminatory capacity to distinguish these patients from healthy controls. Relevant research has confirmed that serum inflammatory biomarkers have limited utility in reflecting disease severity in children with mycoplasma pneumonia, further underscoring the urgency to identify novel alternative biomarkers. Previous investigations have established that miR-193b-3p not only facilitates the clinical diagnosis of severe pneumonia but also correlates closely with disease prognosis20. miR-125b-5p is downregulated in children with severe pneumonia, and it serves as a potential diagnostic indicator and an independent risk factor for poor prognosis in these patients, as reported in the original study21. lncRNA MEG3 is upregulated, and miR-29c is downregulated with a negative correlation in children with severe pneumonia; MEG3 has diagnostic and prognostic value, and its silencing alleviates LPS-induced cell injury and inflammation by binding miR-29c22. Collectively, these findings highlight that the non-coding RNA family constitutes a valuable resource for the discovery of severe pneumonia biomarkers, with its aberrant expression patterns tightly linked to disease onset and progression23. Building on this body of work, the present study finds that miR‑136‑5p is markedly upregulated in children with severe pneumonia and exhibits discriminatory potential for the condition compared with healthy controls. This finding provides preliminary data supporting miR‑136‑5p as a candidate for further diagnostic validation in larger cohorts, and contributes to the ongoing exploration of molecular indicators in pediatric severe pneumonia.
This study found that miR-136-5p expression correlates significantly with multiple core clinical parameters: it is positively correlated with WBC, NEU, PCT, CRP, BNP, and D-D, and negatively correlated with LYM. This correlation profile suggests that the aberrant expression of miR-136-5p is closely linked to several key pathological processes in children with severe pneumonia, including activation of systemic inflammatory responses, immune suppression, and extrapulmonary cardiac involvement. These processes are precisely the core pathological features that distinguish severe pneumonia from non-severe cases24,25,26. When exploring its prognostic value further, children with high miR‑136‑5p expression experienced earlier composite adverse events, indicating poorer clinical outcomes. Consistent with its correlation with key clinical inflammatory and cardiac markers, multivariate Cox regression analysis identified miR‑136‑5p as an independent prognostic predictor of composite adverse events among children with severe pneumonia. This aligns with accumulating evidence documenting its pro-inflammatory and pathogenic roles in other inflammatory disorders, thereby extending this regulatory paradigm to pediatric severe pneumonia and supporting a potential role for miR-136-5p in inflammatory regulation in pediatric severe pneumonia.
To elucidate the mechanism by which miR-136-5p contributes to the development and progression of severe pneumonia, the present study employed an in vitro model of THP-1 macrophages induced by LPS. This model is critical for investigating pulmonary inflammation, as macrophages play a central role in the host immune response against bacterial pathogens during pneumonia27. At the mechanistic level, overexpression of miR-136-5p amplified LPS-elicited pro-inflammatory cytokine release and reduced cell viability in macrophages, whereas inhibition of miR-136-5p mitigated these pathological effects. This functional validation corroborates its pro-inflammatory attribute during macrophage activation. Collectively, these in vitro results support the notion that miRNA-mediated macrophage dysfunction represents one of the key mechanisms driving the pathogenesis of severe pneumonia28. Nevertheless, this in vitro cellular system has inherent constraints in recapitulating the full pathophysiological features of clinical pediatric severe pneumonia. Of note, functional observations obtained from THP‑1‑derived macrophages reflect cellular‑level macrophage responses and cannot directly establish an in vivo pulmonary mechanism. LPS stimulation predominantly mimics the innate immune response elicited by gram-negative bacterial pathogens29, while pediatric severe pneumonia in clinical practice exhibits a heterogeneous etiology involving viral pathogens, Mycoplasma pneumoniae, and mixed infections30, which cannot be fully covered by a single stimulus. In addition, the pulmonary immune microenvironment in vivo relies on coordinated crosstalk among multiple cell types, including alveolar epithelial cells, neutrophils, T lymphocytes, NK cells, and tissue-resident macrophages, and such complex intercellular regulatory networks cannot be fully reproduced by a single immortalized macrophage cell line31,32. Given this, future studies will employ juvenile mouse pneumonia models for in vivo functional validation, complemented by supplementary experiments using primary human alveolar macrophages or multicellular co‑culture systems to more comprehensively recapitulate the complex intercellular regulatory networks of the human pulmonary immune microenvironment.
To our knowledge, this work provides initial evidence that AGO1 may be directly regulated by miR‑136‑5p, serving as one target through which miR‑136‑5p exerts its biological functions. Previous studies have demonstrated that AGO1 plays a key role in regulating intracellular RNA metabolic homeostasis and immune signaling pathway transduction33. Additionally, this protein can modulate the intensity and progression of systemic inflammatory responses by participating in miRNA turnover34. Against this background, the present study demonstrates that AGO1 expression is significantly downregulated in the peripheral blood of children with severe pneumonia and exhibits a marked negative correlation with miR‑136‑5p levels. Further functional assays confirm that miR‑136‑5p directly targets and represses AGO1 expression, thereby significantly reducing macrophage viability. Notably, as a core component of the RISC complex required for canonical miRNA-dependent gene silencing35, AGO1 repression by miR-136-5p theoretically creates an intrinsic negative-feedback loop that may constrain miR-136-5p's own silencing activity36,37. One possible explanation for this biological paradox is that robust upregulation of miR-136-5p under inflammatory stress may override this feedback effect to produce net pathogenic outcomes. This interpretation is supported by the combined results from AGO1 overexpression rescue and AGO1-knockdown assays, which further indicate that repression of AGO1 only partially contributes to miR-136-5p-triggered reduction in macrophage viability and inflammation, implying that other downstream target genes, including LIFR, which has been implicated in miR-136-5p-mediated inflammatory responses38, also participate in the biological effects of miR-136-5p.
This study provides preliminary clinical and mechanistic evidence for miR‑136‑5p, yet several limitations remain to be considered in subsequent investigations. First, the research was conducted at a single center with a relatively small sample size, which may introduce selection bias. Additionally, no prospective sample size calculation was performed prior to this retrospective study, and some exploratory analyses may be underpowered. To enhance the generalizability and robustness of the findings, subsequent studies should incorporate multicenter, large-scale cohorts with greater demographic diversity to validate the diagnostic and prognostic utility of miR-136-5p39. The follow-up duration was restricted to 28 days, thereby focusing exclusively on short-term disease progression. An extended longitudinal follow-up is essential to ascertain whether miR-136-5p is implicated in chronic complications or recurrent infections40. Second, no global multiplicity correction was applied to secondary exploratory analyses. The assessments of diagnostic performance and prognostic value of miR‑136‑5p represented prespecified primary endpoints of this study, for which no multiple‑testing adjustment was performed. In contrast, correlation analyses, cytokine comparisons, and bioinformatic target‑gene screening were hypothesis‑generating exploratory analyses. Stringent corrections, such as the Bonferroni method, were not employed to avoid inflating type II error and discarding potential biologically relevant signals. These exploratory results are thus prone to type I error and should be interpreted cautiously until independently validated. Third, although AGO1 has been confirmed as a direct target gene of miR-136-5p, and both AGO1 overexpression rescue and AGO1 silencing experiments have been performed, the data from this study indicate that AGO1 inhibition only partially mediates miR‑136‑5p‑triggered inflammatory responses and reduced cell viability. Among the 39 candidate target genes predicted by bioinformatics analysis, several genes, including XIAP41, MAP2K442, and SH2B143, have been documented in previous literature to participate in the regulation of inflammatory cytokine secretion and macrophage activation. Consequently, miR-136-5p may engage a more complex regulatory network involving these and other as-yet-unidentified target genes. Fourth, only U6 was used as the endogenous reference gene for plasma miRNA quantification. Although U6 is a widely accepted stable internal control for circulating miRNAs, inclusion of additional reference genes such as miR‑16 would further validate the robustness of the expression results. Finally, this investigation primarily centered on observational and mechanistic analyses; therefore, interventional studies such as miR-136-5p inhibition or AGO1 overexpression in animal models are necessary to evaluate the therapeutic potential of modulating this regulatory pathway.
Despite these limitations, the present findings suggest potential translational relevance for both clinical practice and research, subject to further independent validation. Clinically, miR‑136‑5p may serve as a candidate adjunct biomarker to aid in early recognition of severe pneumonia and risk stratification of composite adverse events in children; its clinical utility would require confirmation in larger, multicenter cohorts prior to implementation. From a research perspective, the miR‑136‑5p/AGO1 regulatory axis characterized herein provides preliminary mechanistic clues for subsequent preclinical exploration of macrophage‑driven pulmonary inflammation, and may offer a reference for investigating miRNA‑mediated inflammatory regulation in other pediatric respiratory disorders.
الإفصاحات
The authors declare that they have no competing financial or non‑financial interests.
Author Contributions:
Conceptualization, C.X., J.W.; Data curation, C.X., J.W.; Formal analysis, C.X.; Investigation, C.X.; Methodology, L.S.; Project administration, J.W.; Resources, L.S.; Software, L.S.; Supervision, X.Z.; Validation, X.Z.; Visualization, X.Z.; Writing - original draft, C.X.; Writing - review and editing, J.W.
شكر وتقدير
The authors received no financial support for this study.
المواد
| الاسم | الشركة | رقم فهرسي | التعليقات |
|---|---|---|---|
| 0.25% trypsin-EDTA | Gibco (Thermo Fisher Scientific) | 25200072 | Cell passaging and detachment |
| 24-well cell culture plate | Corning | 3526 | Seeding 293T cells for dual-luciferase assay |
| 6-well cell culture plate | Corning | 3516 | Seeding THP-1 cells at 5 × 10⁵ cells/well for transfection |
| -80°C Ultra-low temperature freezer | Thermo Fisher Scientific | Forma 900 Series (906) | Long-term storage of plasma samples, avoiding repeated freeze-thaw cycles |
| 96-well cell culture plate | Corning | 3599 | Seed cells for CCK-8 assay |
| AGO1 forward primer | Sangon Biotech | Custom synthesis; https://www.sangon.com/ | AGO1 mRNA detection; sequence: 5’-AGATGGAGTGGATGATGCTGA-3‘ |
| AGO1 reverse primer | Sangon Biotech | Custom synthesis; https://www.sangon.com/ | AGO1 mRNA detection; sequence: 5’-TCCTTCACATAGCTGGCTGAG-3’ |
| AGO1-overexpressing adenovirus | Sangon Biotech | Custom construction; https://www.sangon.com/ | Adenovirus vector for AGO1 overexpression; MOI = 50 |
| Cell Counting Kit-8 (CCK-8) | Beyotime Biotechnology (Nanjing, China) | C0037 | Colorimetric reagent for cell viability assessment |
| CO2 incubator | Thermo Fisher Scientific (Heracell) | Heracell 150i (50116047) | Cell culture in a humidified incubator at 37°C with 5% CO2 |
| Dual-luciferase detector | Molecular Devices (San Jose, CA, USA) | SpectraMax i3x | Multi-mode microplate reader with injector cartridge for flash-based dual luciferase detection |
| Dual-Luciferase Reporter Assay Kit | Beyotime Biotechnology (Nanjing, China) | RG029S | Detection of firefly and Renilla luciferase activities; Renilla as internal normalization control |
| EDTA anticoagulant tube | BD (Becton Dickinson) | 367861 (K2 EDTA) | Fasting venous blood collection tube for plasma separation |
| Empty vector control (adenovirus) | Sangon Biotech | Custom construction; https://www.sangon.com/ | Empty adenovirus vector as negative control; MOI = 50 |
| Fetal bovine serum (FBS) | Gibco (Thermo Fisher Scientific) | 10082147 | Cell culture supplement at 10% final concentration |
| GAPDH forward primer | Sangon Biotech | Custom synthesis; https://www.sangon.com/ | Endogenous reference for mRNA normalization; sequence: 5‘-GGAGCGAGATCCCTCCAAAAT-3’ |
| GAPDH reverse primer | Sangon Biotech | Custom synthesis; https://www.sangon.com/ | Endogenous reference for mRNA normalization; sequence: 5‘-GGCTGTTGTCATACTTCTCATGG-3’ |
| GraphPad Prism | GraphPad Software | version 10.6 | data visualization and statistical analysis |
| HEK293T cell line | ATCC (American Type Culture Collection) | CRL-3216; RRID: CVCL_0063 | Human embryonic kidney cells; high transfection efficiency for luciferase assays |
| Human IL-1β ELISA Kit | Solarbio (Beijing, China) | SEKH-0002 | Quantification of IL-1β protein in cell culture supernatants |
| Human IL-6 ELISA Kit | Solarbio (Beijing, China) | SEKH-0013 | Quantification of IL-6 protein in cell culture supernatants |
| Human TNF-α ELISA Kit | Solarbio (Beijing, China) | SEKH-0047 | Quantification of TNF-α protein in cell culture supernatants |
| Lipofectamine 3000 Transfection Reagent | Invitrogen (Thermo Fisher Scientific) | L3000015 | Lipid-based transfection reagent; cells harvested at 24 h post-transfection; Co-transfection of 293T cells at 60% confluence |
| Lipopolysaccharide (LPS) | Sigma-Aldrich ( USA) | L4391 | Establish in vitro inflammation model at 1 μg/mL |
| Microplate reader | BioTek (Agilent) | Synergy H1 | Multi-mode reader for absorbance measurement at 450 nm |
| Microplate reader (ELISA) | BioTek (Agilent) | Synergy H1 | Multi-mode microplate reader for absorbance detection and standard curve plotting |
| mimic negative control (NC) | GenePharma (Shanghai, China) | Custom; https://www.genepharma.com/ | Control for mimic experiments |
| miR-136-5p forward primer | Sangon Biotech | Custom synthesis; https://www.sangon.com/ | Sequence: 5‘-ACTC CATTTGTTTTGATGATGGA-3’ |
| miR-136-5p inhibitor | GenePharma (Shanghai, China) | Custom; https://www.genepharma.com/ | Synthetic single-stranded RNA to inhibit miR-136-5p function |
| miR-136-5p mimic | GenePharma (Shanghai, China) | Custom; https://www.genepharma.com/ | Synthetic double-stranded RNA for miR-136-5p overexpression; Co-transfected with WT/MUT vectors for binding validation |
| Mutant AGO1 3‘UTR luciferase reporter vector | Sangon Biotech | Custom; https://www.sangon.com/ | Plasmid with mutated miR-136-5p binding sites in AGO1 3‘UTR |
| Negative control (NC) for mimic/inhibitor | GenePharma (China) | Custom; https://www.genepharma.com/ | Non-targeting sequences for control experiments |
| Penicillin-streptomycin solution (100 U/mL, 100 μg/mL) | Gibco (Thermo Fisher Scientific) | 15140122 | Antibiotic solution to prevent bacterial contamination |
| Phorbol 12-myristate 13-acetate (PMA) | Sigma-Aldrich (USA) | P8139 | Induce THP-1 differentiation into mature macrophages at 100 ng/mL |
| Real-time PCR instrument | Langji Scientific Instruments (China) | Q1000+ | Real-time fluorescent quantitative PCR amplification; |
| Refrigerated centrifuge | Eppendorf | 5427 R | Centrifugation at 3000 × g for 10 min at 4 °C to separate plasma |
| RNase-free cryovial | Corning | SCT-200-SS-C | Plasma aliquoting and long-term storage at -80 °C |
| RPMI-1640 medium | Gibco (Thermo Fisher Scientific) | 11875085 | Basal culture medium for THP-1 cells |
| si-AGO1 | GenePharma (Shanghai, China) | Custom; https://www.genepharma.com/ | Small-interfering RNA targeting human AGO1, used for AGO1 knockdown |
| si-NC | GenePharma (Shanghai, China) | Custom; https://www.genepharma.com/ | Non-targeting negative-control siRNA for si-AGO1 transfection assays |
| SPSS Statistics | IBM | version 26.0 | statistical analysis of clinical and experimental data |
| SYBR Green PCR Master Mix | Applied Biosystems (Thermo Fisher Scientific) | A25742 | qPCR amplification using SYBR Green detection |
| TaqMan™ MicroRNA Reverse Transcription Kit | Applied Biosystems (Thermo Fisher Scientific) | 4366596 | cDNA synthesis for miRNA detection; uses stem-loop primers |
| THP-1 cell line (human monocyte-macrophage) | Cell Bank of Chinese Academy of Sciences | TCHu 57 RRID: CVCL_0006 | induced to mature macrophages by PMA |
| TRNzol Universal Total RNA Extraction Reagent | Tiangen Biotech (China) | DP424 | Total RNA isolation from serum and cell samples |
| U6 forward primer | Sangon Biotech | Custom synthesis; https://www.sangon.com/ | Endogenous reference for miRNA normalization; sequence: 5‘-CTCGCTTCGGCAGCACA-3’ |
| U6 reverse primer | Sangon Biotech | Custom synthesis; https://www.sangon.com/ | Endogenous reference for miRNA normalization; sequence: 5‘-AACGCTTCACGAATTTGCGT-3’ |
| Universal reverse primer for miRNA | Sangon Biotech | Custom synthesis; https://www.sangon.com/ | Sequence: 5‘-ATCCAGTGCAGGGTCCGAGG-3’ |
| Wild-type AGO1 3‘UTR luciferase reporter vector | Sangon Biotech | Custom; https://www.sangon.com/ | Plasmid containing WT AGO1 3’UTR with putative miR-136-5p binding sites |
المراجع
- Wang ZL, He Y, Luo ZX. Continuous positive airway pressure in children with severe pneumonia: a meta-analysis. World J Pediatr. 2020;16(6):637–641.
- de Benedictis FM et al. Complicated pneumonia in children. Lancet. 2020;396(10253):786–798.
- Zachariah P. COVID-19 in children. Infect Dis Clin North Am. 2022;36(1):1–14.
- Fan F, Lv J, Yang Q, Jiang F. Clinical characteristics and serum inflammatory markers of community-acquired mycoplasma pneumonia in children. Clin Respir J. 2023;17(7):607–617.
- Boateng E, Krauss-Etschmann S. miRNAs in lung development and diseases. Int J Mol Sci. 2020;21(8):2765.
- Kierbiedź-Guzik N, Sozańska B. miRNAs as modern biomarkers in asthma therapy. Int J Mol Sci. 2023;24(14):11499.
- Li X et al. Blood miRNAs as potential diagnostic biomarkers for chronic obstructive pulmonary disease: a meta-analysis. Int J Chron Obstruct Pulmon Dis. 2024;19:981–993.
- Nan F, Liu B, Yao C. Discovering the role of microRNAs and exosomal microRNAs in chest and pulmonary diseases: a spotlight on chronic obstructive pulmonary disease. Mol Genet Genomics. 2024;299(1):107.
- Bi Y et al. Activation of the circAGFG1/miR-195-5p/PD-L1 axis induces lung injury in sepsis. Hum Cell. 2025;38(5):129.
- Zhao S et al. GATA1-activated lncRNA OIP5-AS1 and GAS5 promote pyroptosis to exacerbate asthma through regulating miR-136-5p/LIFR axis. FASEB J. 2024;38(22):e70159.
- Chen X et al. Molecular mechanisms and roles of miR-136-5p in human cancer and other disorders. Curr Med Chem. 2025;32(26):5474–5492.
- Nakanishi K. When Argonaute takes out the ribonuclease sword. J Biol Chem. 2024;300(1):105499.
- Devitt M. PIDS and IDSA issue management guidelines for community-acquired pneumonia in infants and young children. Am Fam Physician. 2012;86(2):196–202.
- de Santana Silva ÍTS et al. Identification of snRNA U6 as an endogenous reference gene for normalization of miRNA expression data in COVID-19 patients. Sci Rep. 2025;15(1):26636.
- Hao M et al. Correlation between platelet miRNA expression and coagulation function in children with severe pneumonia. Evid Based Complement Alternat Med. 2022;2022:2826115.
- Lund ME, To J, O’Brien BA, Donnelly S. The choice of phorbol 12-myristate 13-acetate differentiation protocol influences the response of THP-1 macrophages to a pro-inflammatory stimulus. J Immunol Methods. 2016;430:64–70.
- de Araújo AP, da Costa Rodrigues T, de Oliveira MLS, Miyaji EN. Cytokine secretion by in vitro cultures of lung epithelial cells, differentiated macrophages and differentiated dendritic cells incubated with pneumococci and pneumococcal extracellular vesicles. Braz J Microbiol. 2024;55(4):3797–3810.
- Zheng Q et al. Exploration of ω-9MUFAs: mitigating effect on lipopolysaccharide-induced acute lung injury. Eur J Pharmacol. 2025;998:177396.
- Gong W, Gao K, Shan Z, Yang L, Fang P, Li C, Yang J, Ni J. Research progress of biomarkers in evaluating the severity and prognostic value of severe pneumonia in children. Front Pediatr. 2024;12:1417644.
- Liu K et al. The diagnostic and prognostic value of circulating miR-193b-3p on severe pneumonia. BMC Immunol. 2025;26(1):103.
- Zhu M et al. Clinical value of dysregulated miR-125b-5p in severe pneumonia children. BMC Immunol. 2025;26(1):31.
- Guo J et al. Upregulated expression of long non-coding RNA MEG3 serves as a prognostic biomarker in severe pneumonia children and its regulatory mechanism. Bioengineered. 2021;12(1):7120–7131.
- Chen L et al. Study on the up-regulated lncRNA UCA1 as prognostic biomarker of severe pneumonia and its possible regulatory mechanism. Biomark Med. 2025;19(20):987–998.
- Sharma PK et al. Severe necrotizing pneumonia in children: a challenge to intensive care specialist. J Trop Pediatr. 2020;66(6):637–644.
- Orabi R, AbdelMassih A. Vascular dysfunction in patients with pneumonia [conference abstract]. Arch Dis Child. 2023;108(Suppl 2):A381.2. Available from: https://adc.bmj.com/content/108/Suppl_2/A381.2.
- Rózsai B et al. Immunological dysfunction of children with severe parapneumonic effusion. Front Pediatr. 2025;13:1547146.
- Ou L et al. LPS mediates cuproptosis and inflammation in THP-1 macrophages through HKDC1. Acta Biochim Biophys Sin (Shanghai). 2025;57(12):1953–1968.
- Zhang F, Zhou Y, Ding J. The current landscape of microRNAs (miRNAs) in bacterial pneumonia: opportunities and challenges. Cell Mol Biol Lett. 2022;27(1):70.
- Odum JD et al. The clinical view of sepsis-associated AKI: how basic science can help solve this problem. Semin Nephrol. 2025;45(6):151665.
- Chen Q et al. Clinical characteristics of severe community-acquired pneumonia in children with virus mono-detection versus co-detection with bacteria. BMC Pulm Med. 2025;25(1):130.
- Traber KE, Mizgerd JP. The integrated pulmonary immune response to pneumonia. Annu Rev Immunol. 2025;43(1):545–569.
- Huang HK et al. Crosstalk between macrophages and diverse immune cells accelerates the development of acute lung injury. Life Sci. 2025;380:123925.
- Salem ES et al. RNAs and RNA-binding proteins in immuno-metabolic homeostasis and diseases. Front Cardiovasc Med. 2019;6:106.
- Giudicatti AJ, Tomassi AH, Manavella PA, Arce AL. Extensive analysis of miRNA trimming and tailing indicates that AGO1 has a complex role in miRNA turnover. Plants (Basel). 2021;10(2):267.
- Narasimhan S, Erkeland SJ. Partners in silencing: decoding the mammalian Argonaute interactome. Noncoding RNA. 2025;11(4):62.
- Tian S, Zhao Z, Kassie MG, Zhang F, Ren B, Wang D. Enhanced MiRISC expression noise reduction by self-feedback regulation of mRNA degradation. Comput Struct Biotechnol J. 2026;31:179.
- Dalmadi Á et al. Controlled RISC loading efficiency of miR168 defined by miRNA duplex structure adjusts ARGONAUTE1 homeostasis. Nucleic Acids Res. 2021;49(22):12912–12928.
- Deng G et al. miR-136-5p regulates the inflammatory response by targeting the IKKβ/NF-κB/A20 pathway after spinal cord injury. Cell Physiol Biochem. 2018;50(2):512–524.
- Chen D, Cao L, Li W. Etiological and clinical characteristics of severe pneumonia in pediatric intensive care unit (PICU). BMC Pediatr. 2023;23(1):362.
- Tsikis ST et al. Lipopolysaccharide-induced murine lung injury results in long-term pulmonary changes and downregulation of angiogenic pathways. Sci Rep. 2022;12(1):10245.
- Hughes SA et al. Caspase-8-driven apoptotic and pyroptotic crosstalk causes cell death and IL-1β release in X-linked inhibitor of apoptosis (XIAP) deficiency. EMBO J. 2023;42(5):e110468.
- Liu J et al. YTHDF2 in inflammation: mechanisms and therapeutic strategies. Genes Dis. 2026;13(3):101909.
- Maures TJ, Kurzer JH, Carter-Su C. SH2B1 (SH2-B) and JAK2: a multifunctional adaptor protein and kinase made for each other. Trends Endocrinol Metab. 2007;18(1):38–45.