This propensity score-matched retrospective study found that circulating oxidative-damage, antioxidant-defense, and ECM-related biomarker profiles differed across recorded POP severity categories in patients with vulvar leukoplakia-related lesions; the findings indicate systemic associations rather than local tissue remodeling or causation.
مقالة بحثية
Circulating Redox and Extracellular Matrix Biomarkers by Pelvic Organ Prolapse Severity in Vulvar Leukoplakia: a Propensity Score-Matched Study
في هذه المقالة
ملخص
الملخص
This study aimed to investigate the biochemical expression characteristics of circulating oxidative stress markers, antioxidant defense indicators, and extracellular matrix (ECM) degradation products in patients with vulvar leukoplakia complicated by different degrees of pelvic organ prolapse (POP). Patients with vulvar leukoplakia admitted between May 2024 and January 2026 were retrospectively included. After propensity score matching (PSM), they were divided according to pelvic organ prolapse quantification (POP-Q) stage into four groups: no POP, mild POP, moderate POP, and severe POP, with 57 patients in each group. Oxidative damage products, antioxidant defense-related indicators, ECM degradation and remodeling indicators were compared among the groups, and differences in the clinical phenotype of vulvar leukoplakia and POP-Q anatomical indicators were also analyzed. The results showed that, as POP severity increased, oxidative damage indicators, including MDA, 8-OHdG, 8-iso-PGF2α, AOPP, protein carbonyl, lipid hydroperoxide, and AGEs, tended to increase overall. By contrast, SOD, GSH-Px, CAT, T-AOC, GSH, and the GSH/GSSG ratio showed downward trends, suggesting that the redox balance of these patients may shift toward an oxidative state. Meanwhile, MMP-2, MMP-9, the MMP-9/TIMP-1 ratio, CTX-I/ICTP, PIIINP, and desmosine/isodesmosine were higher in the higher recorded severity categories, whereas TIMP-1 and TIMP-2 were lower. These findings indicate associations between the recorded POP severity categories and circulating redox and ECM-related biomarker profiles; they do not establish the tissue source of the markers, local pelvic floor remodeling, or a causal relationship between vulvar disease and POP.
المقدمة
Vulvar leukoplakia refers to a group of chronic lesions mainly characterized by depigmentation, abnormal keratinization, atrophy, sclerosis, and persistent pruritus of the vulvar skin or mucosa. Clinically, it is often associated with disease spectra such as vulvar lichen sclerosus and squamous epithelial hyperplasia1. The disease usually follows a long course, and its symptoms tend to recur. Over time, it may cause structural changes of the vulva, dyspareunia, sleep disturbance, and reduced quality of life, and some patients also face a risk of malignant transformation2. Previous studies have shown that the incidence and disease burden of vulvar lichen sclerosus vary substantially according to the study population, diagnostic approach, and registry system, and the true prevalence may be underestimated; at the same time, this disease is associated with an increased risk of vulvar high-grade squamous precancerous lesions and vulvar squamous cell carcinoma3,4. Therefore, beyond clinical symptoms and pathological diagnosis, it is important to identify objective biochemical indicators that reflect disease activity and the extent of tissue injury, as this may aid patient stratification, treatment evaluation, and long-term follow-up. Uterine prolapse, as a common form of pelvic organ prolapse (POP), is not caused simply by anatomical descent. Rather, it is closely related to pathological processes such as degeneration of pelvic floor supporting tissues, relaxation of fascia and ligaments, abnormal collagen metabolism, and elastic fiber disruption5. Aging, pregnancy- and delivery-related injury, postmenopausal changes in hormone levels, chronically increased abdominal pressure, and imbalanced connective tissue remodeling may all contribute to its occurrence and progression6. Epidemiological data show that the prevalence of POP is clearly affected by diagnostic criteria and study populations, and the results differ markedly when symptoms, gynecological examination, or both are used for assessment. With increasing female life expectancy and the growing disease burden related to pelvic floor dysfunction, the impact of POP on physical function, psychological status, and social activity has become increasingly prominent, and the underlying degenerative changes in tissues have also gradually become a focus of research7,8.
Although vulvar leukoplakia-related lesions and POP are clinically distinct conditions, oxidative imbalance and altered ECM turnover are relevant to both chronic vulvar tissue injury and pelvic support; the present study, therefore, examined whether non-tissue-specific circulating biomarkers differed across the recorded POP severity categories without presuming that either condition caused the other. For example, oxidative stress can induce lipid peroxidation, deoxyribonucleic acid (DNA) oxidative damage, and oxidative protein modification, while weakening the body's antioxidant defense capacity; in this way, it may participate in chronic inflammation, epithelial barrier injury, tissue fibrosis, and degenerative changes9. At the same time, the dynamic balance of the extracellular matrix (ECM) is important for maintaining both the structural stability of vulvar skin and pelvic floor support function. An imbalance between matrix metalloproteinases (MMPs) and tissue inhibitors of metalloproteinases (TIMPs) can promote the degradation of collagen and elastic fibers, thereby reducing tissue elasticity and mechanical support capacity10. However, existing studies have mostly focused on the local pathological features and clinical treatment response of vulvar leukoplakia, or on the anatomical grading, surgical repair, and recurrence factors of POP. The changes in circulating oxidative stress levels and ECM degradation products in patients with both conditions have not yet been systematically observed11,12. In particular, whether patients with varying degrees of POP exhibit identifiable differences in biochemical expression remains an issue that warrants further study.
Based on this, the present study selected patients with vulvar leukoplakia complicated by varying degrees of POP as the study population and sought to describe the circulating biochemical expression pattern across three dimensions: oxidative damage, antioxidant defense, and ECM degradation. These circulating profiles were analyzed together with the clinical phenotype of vulvar disease and the recorded POP severity categories to identify systemic biochemical associations rather than a tissue-specific mechanism or causal pathway. The results may supplement the systemic biochemical characterization of this patient population and provide a basis for subsequent longitudinal and tissue-based studies.
البروتوكول
Ethical statement
This study was approved by the Ethics Committee of Jiangxi Provincial Maternity and Child Health Care Hospital (No.00254Y), and the requirement for informed consent was waived.
Study design and data source
The retrospective analytical workflow comprised patient screening, diagnostic classification, POP-Q assessment, assignment to recorded clinical severity categories, retrieval and verification of retained biospecimen records, four-group generalized propensity score matching, laboratory quality control review, and statistical comparison of circulating biomarker profiles. This study was a single-center retrospective PSM analysis. The study population consisted of patients with vulvar leukoplakia treated at the hospital from May 2024 to January 2026, and the study data were mainly obtained from the electronic medical record system and laboratory testing database. The screening and grouping process of the study population is shown in Figure 1.
Patient eligibility and diagnostic classification
The inclusion criteria were as follows: (1) age ≥18 years; (2) diagnosis by a gynecologist of a vulvar leukoplakia-related lesion, including vulvar lichen sclerosus, squamous epithelial hyperplasia, or a mixed lesion, on the basis of characteristic symptoms and vulvar examination findings, with histopathological assessment when clinically indicated; (3) completion of POP-Q assessment during the same period; (4) available and traceable serum or plasma samples and related testing records within the study period; and (5) complete main clinical data, grouping data, and core testing data. The exclusion criteria were as follows: (1) malignancies of the vulva, cervix, endometrium, ovary, or other sites; (2) acute vulvovaginal infection, pelvic inflammatory disease, or systemic acute infection; (3) definite autoimmune diseases such as systemic lupus erythematosus, rheumatoid arthritis, or scleroderma; (4) systemic glucocorticoids, immunosuppressants, antioxidants, or hormone replacement therapy within the previous 3 months; (5) pelvic floor reconstruction surgery, vulvar surgery, or other treatments that might affect pelvic floor structure, inflammatory status, or oxidative stress levels within the previous 3 months; (6) severe hepatic or renal dysfunction, hematological disease, or decompensated endocrine or metabolic disorder; (7) blood samples with obvious hemolysis, lipemia, repeated freeze-thaw cycles, insufficient sample volume, or failed testing; and (8) missing key variables that could not be further verified through original records. The term “vulvar leukoplakia” was used as an umbrella clinical term rather than as a single histopathological diagnosis. The post-matching analytical dataset did not contain patient-level biopsy status, pathological confirmation, or lesion-subtype variables; consequently, the number of pathologically confirmed cases and the group-specific subtype distributions could not be reconstructed from the available data.
POP-Q assessment and recorded severity categories
All patients were evaluated for POP severity according to the pelvic organ prolapse quantification (POP-Q) system13. Based on the diagnosis of vulvar leukoplakia and POP-Q stage, the patients were divided into four groups: vulvar leukoplakia without POP group (group A), vulvar leukoplakia with mild POP group (group B), vulvar leukoplakia with moderate POP group (group C), and vulvar leukoplakia with severe POP group (group D). For descriptive compartment analysis, the anterior, posterior, and apical compartments were represented by Ba, Bp, and C, respectively. The largest of these three values was classified as the most distal compartment; exact ties were classified as co-dominant.
Four-group generalized propensity score matching (PSM)
A multinomial logistic regression model was used to estimate generalized propensity scores for membership in groups A–D. The model included age, BMI, menopausal status, parity, number of vaginal deliveries, duration of vulvar leukoplakia, hypertension, type 2 diabetes mellitus, hyperlipidemia, previous pelvic surgery, and recent local treatment history. Nearest-neighbor matching was performed without replacement to form 1:1:1:1 matched groups, using a caliper of 0.2 standard deviations of the logit-transformed generalized propensity score. For each covariate, post-matching balance was summarized using the maximum absolute SMD across the six pairwise group comparisons. An SMD below 0.20 was prespecified as the balance criterion. The number of vaginal deliveries and duration of vulvar leukoplakia retained maximum SMDs of 0.285 and 0.204, respectively, and were therefore included as covariates in the adjusted sensitivity analyses Table 1.
Retained biospecimens and biomarker measurements
The study used retained serum or plasma specimens originally collected during routine clinical care. The sample matrix used for each analyte is reported in Table 2, and the separated specimens were stored at −80 °C; samples with visible hemolysis or lipemia, repeated freeze–thaw exposure, insufficient volume, or failed analytical quality control were excluded. Detection of circulating oxidative damage products: MDA, 8-OHdG, 8-iso-PGF2α, AOPP, protein carbonyl, lipid hydroperoxide, and AGEs. Detection of circulating antioxidant defense indicators: SOD, GSH-Px, CAT, T-AOC, GSH, GSSG, the GSH/GSSG ratio, and nicotinamide adenine dinucleotide phosphate (NADPH) oxidase-related activity indicators. Detection of ECM degradation and remodeling indicators: MMP-2, MMP-9, TIMP-1, TIMP-2, the MMP-9/TIMP-1 ratio, CTX-I/ICTP, PIIINP, and the elastic fiber degradation products desmosine/isodesmosine.
Laboratory quality control
All measurements were performed in accordance with the applicable assay instructions and laboratory quality-control requirements. Blank wells, calibration standards, and quality-control samples were included in each analytical batch, and patient samples were measured in duplicate. Values below the lower limit of detection were handled according to the prespecified laboratory rule, whereas values above the upper limit of the calibration curve were diluted and retested when sufficient specimen remained. The sample matrix, analytical method, measurement range, lower limit of detection, calibration-curve coefficient, and intra- and inter-batch coefficients of variation for each analyte are summarized in Table 2. The participant-level analytical dataset did not contain collection-tube specifications, processing intervals, centrifugation settings, aliquot volumes, individual storage durations, assay dates, batch allocation, freeze–thaw counts, or laboratory blinding status. These items could not be reconstructed from the available data and are recognized as limitations of the retrospective biospecimen workflow. Critical workflow checks included confirming that the clinical assessment and biospecimen record referred to the same study period, verifying participant identity and sample matrix before analysis, applying the prespecified sample-rejection criteria, reviewing duplicate measurements and assay quality-control results, and examining covariate balance before accepting the matched dataset. Records or specimens that failed traceability or quality-control requirements were excluded rather than retrospectively reclassified. The workflow could be paused after eligibility verification, laboratory quality-control review, and completion of propensity score matching.
Statistical analysis
Normality was assessed using the Shapiro–Wilk test and Q–Q plots, and homogeneity of variance was evaluated using Levene's test. Approximately normally distributed variables with homogeneous variances were summarized as mean ± standard deviation and compared using one-way analysis of variance, followed by Tukey's test. Variables with approximate normality but unequal variances were analyzed using Welch's analysis of variance, followed by Games–Howell pairwise comparisons. Clearly skewed continuous variables were summarized as median and interquartile range and compared using the Kruskal–Wallis test, followed by Dunn's test with Holm adjustment. Categorical variables were compared using the χ2 test or Fisher's exact test, as appropriate, and ordinal clinical scores were analyzed using rank-based methods. The Benjamini–Hochberg procedure controlled the false discovery rate separately within the oxidative-damage, antioxidant/redox, and ECM-related biomarker families. Partial eta squared was reported for analysis-of-variance models, and epsilon squared was reported for Kruskal–Wallis analyses. Ordered trends were examined using robust linear regression with the recorded severity category coded from 1 to 4. Sensitivity models additionally adjusted for the number of vaginal deliveries and the duration of vulvar leukoplakia and used HC3 heteroscedasticity-consistent standard errors. All tests were two-sided, and an adjusted p value below 0.05 was considered statistically significant.
النتائج
Comparison of circulating oxidative damage products
In sensitivity analyses using heteroscedasticity-consistent standard errors and adjusting for the number of vaginal deliveries and duration of vulvar leukoplakia, the overall group term remained significant for all 23 circulating biomarker outcomes (all robust Wald p < 0.001). The adjusted group D versus group A contrasts were directionally consistent with the primary analyses for all outcomes. All seven oxidative-damage biomarkers differed across the recorded severity categories after false-discovery-rate correction. MDA increased from 3.38 ± 0.76 µmol/L in group A to 4.55 ± 1.08 µmol/L in group D, with Welch F(3,123.49) = 16.984, FDR-adjusted p < 0.001, and partial η2 = 0.292. The skewed distributions of 8-iso-PGF2α and lipid hydroperoxide were analyzed using the Kruskal–Wallis test, yielding H = 15.326, FDR-adjusted p = 0.002, ε2 = 0.055, and H = 14.500, FDR-adjusted p = 0.002, ε2 = 0.051, respectively. The remaining oxidative-damage biomarkers also differed significantly after correction, and all adjusted ordered-trend tests were significant (p < 0.001) (Figure 2A–G and Supplementary Table 1).
Comparison of circulating antioxidant defense indicators
Antioxidant defense indicators were generally lower in the higher-severity categories. SOD decreased from 90.60 ± 17.80 U/mL in group A to 75.30 ± 17.10 U/mL in group D (F = 8.769, FDR-adjusted p < 0.001, partial η2 = 0.105). The GSH/GSSG ratio differed across groups (H = 27.663, FDR-adjusted p < 0.001, ε2 = 0.110), as did NADPH oxidase activity (H = 13.838, FDR-adjusted p = 0.003, ε2 = 0.048). All eight antioxidant/redox outcomes remained significant after correction, and all adjusted ordered-trend tests were significant (p < 0.001) (Figure 3A–H and Supplementary Table 1).
Comparison of extracellular matrix degradation and remodeling indicators
All eight circulating ECM-related biomarkers differed across the recorded severity categories after false discovery rate correction. The MMP-9/TIMP-1 ratio increased from 1.88 ± 0.54 in group A to 3.12 ± 0.95 in group D, with Welch F(3,122.21) = 29.225, FDR-adjusted p < 0.001, and partial η2 = 0.418. MMP-9 also showed a substantial group difference (Welch F(3,123.70) = 20.396, FDR-adjusted p < 0.001, partial η2 = 0.331). TIMP-1 and TIMP-2 were lower in the higher recorded categories (FDR-adjusted p = 0.003 for both), whereas desmosine/isodesmosine differed by the Kruskal–Wallis test (H = 21.976, FDR-adjusted p < 0.001, ε2 = 0.085). All adjusted ordered-trend tests were significant (p < 0.001) (Figure 4A–H and Supplementary Table 1).
Comparison of clinical phenotypes of vulvar leukoplakia
Differences were observed among the four groups in vulvar pruritus visual analog scale (VAS) score, pain/burning score, leukoplakic lesion area score, skin atrophy score, and fissuring/sclerosis score (p < 0.05). Among them, the difference in leukoplakic lesion area score was the most significant (H = 14.295, p = 0.003) (Table 3).
Comparison of POP-Q-related anatomical indicators
Finally, the authors also observed differences among the four groups in Aa, Ba, C, Ap, Bp, gh, and pb (p < 0.001). The change in point C best reflected the difference in POP severity, changing from -6.38 ± 0.95 cm in the no-prolapse group to 2.88 ± 1.36 cm in the severe prolapse group (F = 822.788, p < 0.001). In addition, gh increased with increasing prolapse severity, whereas pb showed a decreasing trend. It is worth noting that total vaginal length (TVL) did not differ significantly among the four groups (p = 0.244) (Table 4). Based on the most distal values of Ba, Bp, and C, group A included 19 anterior, 9 posterior, and 29 co-dominant cases; group B included 26 anterior, 3 posterior, and 28 co-dominant cases; group C included 28 anterior, 4 posterior, 11 apical, and 14 co-dominant cases; and all 57 patients in group D had an apical most-distal compartment (Supplementary Table 2).
DATA AVAILABILITY:
The complete recalculated statistical results, including balance diagnostics, assumption checks, effect sizes, pairwise comparisons, and adjusted sensitivity analyses, are provided in Supplementary Table 3.
FIGURES AND TABLES LEGENDS:
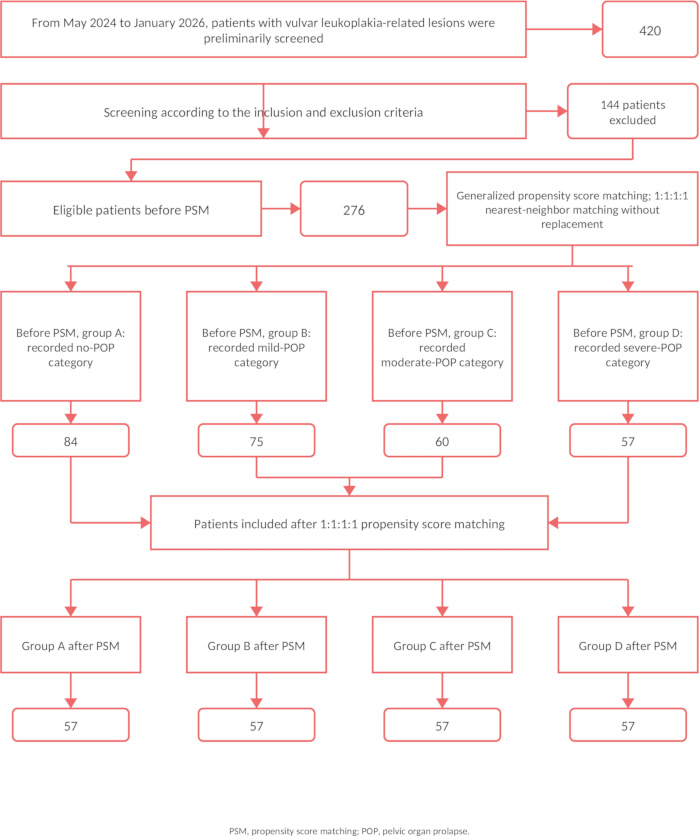
Figure 1: Retrospective patient screening and propensity score-matched grouping workflow. The flowchart shows the initial screening of patients with vulvar leukoplakia, exclusion according to the eligibility criteria, group allocation before propensity score matching (PSM), and final balanced allocation into group A, group B, group C, and group D after PSM. Please click here to view a larger version of this figure.
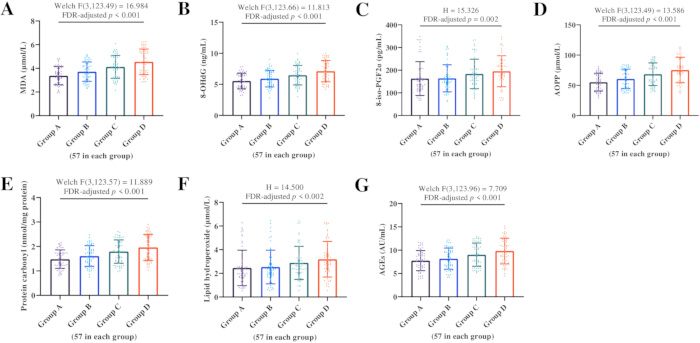
Figure 2: Circulating oxidative damage products across different degrees of pelvic organ prolapse. (A) Malondialdehyde (MDA); (B) 8-hydroxy-2'-deoxyguanosine (8-OHdG); (C) 8-iso-prostaglandin F2α (8-iso-PGF2α); (D) advanced oxidation protein products (AOPP); (E) protein carbonyl; (F) lipid hydroperoxide; (G) advanced glycation end products (AGEs). Please click here to view a larger version of this figure.
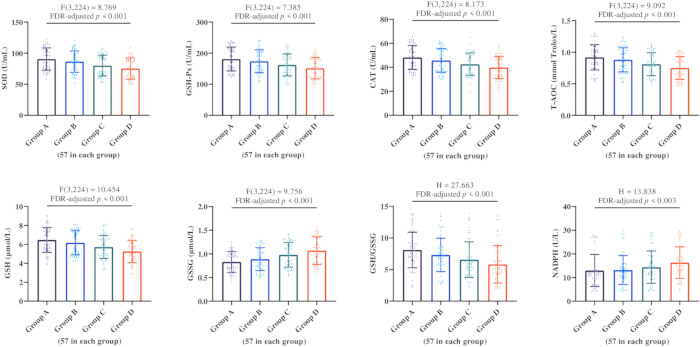
Figure 3: Circulating antioxidant defense and redox balance indicators across different degrees of pelvic organ prolapse. (A) Superoxide dismutase (SOD); (B) glutathione peroxidase (GSH-Px); (C) catalase (CAT); (D) total antioxidant capacity (T-AOC); (E) glutathione (GSH); (F) oxidized glutathione (GSSG); (G) GSH/GSSG ratio; (H) nicotinamide adenine dinucleotide phosphate (NADPH) oxidase activity. Please click here to view a larger version of this figure.
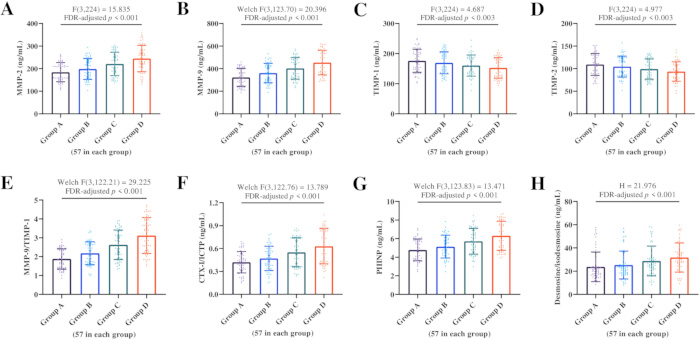
Figure 4: Extracellular matrix degradation and remodeling indicators across different degrees of pelvic organ prolapse. (A) Matrix metalloproteinase-2 (MMP-2); (B) matrix metalloproteinase-9 (MMP-9); (C) tissue inhibitor of metalloproteinase-1 (TIMP-1); (D) tissue inhibitor of metalloproteinase-2 (TIMP-2); (E) MMP-9/TIMP-1 ratio; (F) type I collagen C-terminal telopeptide/cross-linked C-terminal telopeptide of type I collagen (CTX-I/ICTP); (G) procollagen type III N-terminal peptide (PIIINP); (H) desmosine/isodesmosine. Please click here to view a larger version of this figure.
Table 1: Baseline characteristics of patients with vulvar leukoplakia and different degrees of pelvic organ prolapse after propensity score matching. This table summarizes demographic, reproductive, metabolic, and treatment-related baseline characteristics across the four propensity score-matched groups, together with between-group statistics and standardized mean differences. Please click here to download this Table.
Table 2: Assay characteristics and quality control parameters for circulating oxidative stress, antioxidant defense, and extracellular matrix remodeling indicators. This table summarizes the sample type, detection method, analytical range, detection limit, calibration linearity, and intra- and inter-batch variability for the measured circulating biomarkers. Please click here to download this Table.
Table 3: Clinical phenotype scores of vulvar leukoplakia across different degrees of pelvic organ prolapse. This table compares vulvar pruritus, pain or burning, lesion area, skin atrophy, and fissuring or sclerosis scores across the four groups. Please click here to download this Table.
Table 4: Pelvic organ prolapses quantification-related anatomical indicators across different degrees of pelvic organ prolapse. This table compares pelvic organ prolapse quantification anatomical measurements across the four groups, covering anterior, posterior, and apical support as well as genital hiatus, perineal body, and total vaginal length. Please click here to download this Table.
Supplementary Table 1: Detailed statistical analysis of circulating biomarkers across recorded pelvic organ prolapse severity categories. Group-wise biomarker values, overall statistical tests, FDR-adjusted p values, effect sizes, variance assessments, and adjusted ordered-trend analyses are presented. Please click here to download this file.
Supplementary Table 2: Distribution of POP-Q severity ranges and most distal pelvic compartments across recorded prolapse categories. The table summarizes leading-edge ranges and the distribution of anterior, posterior, apical, and co-dominant most-distal compartments for Groups A–D. Please click here to download this file.
Supplementary Table 3: Participant-level analytical dataset for the propensity score-matched cohort. Individual demographic and clinical characteristics, circulating oxidative stress, antioxidant/redox and ECM biomarkers, vulvar phenotype scores, and POP-Q anatomical measurements are provided for the 228 matched participants. Please click here to download this file.
المناقشة
Based on retrospective data after PSM, this study compared circulating oxidative stress markers, antioxidant defense indicators, and ECM degradation products in patients with vulvar leukoplakia complicated by different degrees of POP. The results showed that patients with more severe POP had generally higher levels of oxidative damage-related indicators, relatively lower antioxidant defense indicators, and corresponding changes in the MMP/TIMP balance as well as collagen- and elastic fiber-degradation-related indicators. Clinical phenotype scores of vulvar leukoplakia differed among groups with different degrees of prolapse, but the magnitude of change was not large. Overall, these results suggest that the circulating biochemical status of patients with vulvar leukoplakia complicated by POP may be associated with prolapse severity, although the underlying mechanisms and causal direction still require further confirmation.
Specifically, oxidative damage products such as MDA, 8-OHdG, 8-iso-PGF2α, AOPP, and protein carbonyl were higher in the more severe prolapse groups. These indicators are related to lipid peroxidation, DNA oxidative damage, and oxidative protein modification, respectively. Their changes, therefore, were not isolated findings, but suggested that patients may have a relatively higher oxidative damage burden14,15. This may be because the pelvic floor supporting structures of patients with POP are chronically exposed to abnormal traction and mechanical loading, while changes in local tissue microcirculation, chronic low-grade inflammation, and repeated repair processes promote the generation of reactive oxygen species. This view has also been preliminarily supported by previous studies on POP: oxidative stress may be related to degenerative changes in pelvic floor tissues16,17. However, the authors only measured peripheral blood circulating markers, which cannot directly represent oxidative damage levels in local vulvar tissue or pelvic floor supporting tissues. Therefore, a more appropriate interpretation of this result is that, as prolapse severity increases, the systemic oxidative stress status of patients may change accordingly, rather than directly proving that local tissues have undergone the same degree of oxidative damage. Changes in antioxidant defense indicators also supported this result. The authors observed that SOD, GSH-Px, CAT, T-AOC, and GSH were decreased in the more severe prolapse groups, whereas GSSG and NADPH oxidase activity were increased. This suggests that enhanced oxidative stress may be related not only to increased oxidative products, but also to reduced antioxidant scavenging capacity. As is well recognized, SOD, CAT, and GSH-Px are important enzyme systems for scavenging superoxide anions and peroxides; when reactive oxygen species continue to increase, GSH consumption increases, GSSG rises relatively, and the GSH/GSSG ratio decreases, so the redox balance may gradually shift toward an oxidative state18,19. Similar impairment of the antioxidant system has also been observed in some studies of pelvic floor dysfunction or prolapse tissues20. Nevertheless, findings across studies are not entirely consistent, which may be related to differences in sample sources, study populations, tissue sites, testing indicators, and testing methods. Existing evidence is more suitable for supporting an association among oxidative stress, connective tissue homeostasis, and ECM-collagen metabolic changes, rather than suggesting that all antioxidant enzymes or all redox indicators change in a consistent manner21,22. Such differences may be related to sample source: local tissue samples are closer to the lesion microenvironment, whereas circulating samples more often reflect systemic metabolic and inflammatory status. In addition, patient age, menopausal status, metabolic disease, previous treatment, and testing methods may also affect the consistency of results.
On the other hand, changes in ECM degradation and remodeling indicators provided another layer of evidence for understanding differences in prolapse severity. Clinical studies have confirmed that the stability of pelvic floor supporting tissues depends on the joint maintenance of structures such as collagen fibers, elastic fibers, fascia, and ligaments, among which the MMP/TIMP system participates in ECM degradation and turnover23. When MMP activity is relatively enhanced, and TIMP inhibition is insufficient, collagen and elastic fiber degradation may increase, tissue tensile strength and elastic recoil capacity may decline, and these changes may be associated with relaxation of supporting structures24. Previous studies have generally suggested that ECM metabolic imbalance is one of the important molecular features of POP, and that MMP/TIMP, transforming growth factor-β (TGF-β), lysyl oxidase/lysyl oxidase-like (LOX/LOXL), and elastic fiber-related pathways may all participate in pelvic floor tissue remodeling25,26. In this study, the authors observed that MMP-2, MMP-9, the MMP-9/TIMP-1 ratio, and collagen and elastic fiber degradation products were increased in the more severe prolapse groups, whereas TIMP-1 and TIMP-2 were relatively decreased. These findings are consistent with differences in circulating markers related to matrix turnover; however, because the markers are not tissue-specific, they may reflect contributions from vulvar lesions, pelvic floor tissues, systemic inflammation, metabolic status, aging, or other sources. They should therefore be interpreted as systemic associations with the recorded POP severity categories rather than as direct evidence of local pelvic floor ECM remodeling.
In terms of clinical manifestations, although the authors observed slightly higher clinical phenotype scores of vulvar leukoplakia in the more severe prolapse groups, this result should not be overinterpreted, because symptoms related to vulvar lichen sclerosus/vulvar leukoplakia are influenced by many factors, including inflammatory activity, skin structural changes, disease fluctuation, treatment adherence, disease perception, and subjective patient experience27,28. POP may affect vulvar symptoms through local friction, changes in the humid environment, stimulation by secretions, or changes in microcirculatory status. The findings of this study do not support the conclusion that prolapse severity directly aggravates vulvar leukoplakia; therefore, it is more appropriate to understand these findings as indicating that the two types of clinical manifestations may be influenced by some shared factors. Meanwhile, the POP-Q indicators were consistent with the study grouping, which also provided the necessary clinical basis for subsequent comparison of biochemical indicators. However, TVL is affected by individual anatomical differences, menopausal status, previous surgery, and tissue elasticity, and does not necessarily change in parallel with prolapse severity.
This study has several limitations. Its single-center retrospective and cross-sectional design precludes determination of temporal sequence or causality, while residual imbalance in the number of vaginal deliveries and duration of vulvar leukoplakia indicates that propensity score matching did not eliminate confounding. The analytical dataset retained the four recorded severity categories and individual POP-Q measurements, but not the original overall POP-Q stage, and post hoc assessment demonstrated overlap between the recorded categories. Biopsy status, pathological confirmation, lesion subtype, detailed topical treatment exposure, hygiene practices, and chronic causes of increased intra-abdominal pressure were not consistently available. In addition, the circulating biomarkers were not tissue-specific, and several preanalytical and assay-level details could not be recovered from the archived participant-level data. Prospective multicenter studies incorporating standardized diagnostic classification, complete POP-Q staging, standardized biospecimen collection, local tissue analysis, and longitudinal follow-up are required to validate these associations.
Circulating oxidative-damage, antioxidant-defense, and ECM-related biomarkers differed across the recorded POP severity categories in patients with vulvar leukoplakia-related lesions. These cross-sectional findings indicate systemic biochemical associations, but they do not establish the tissue origin of the measured markers, local pelvic floor remodeling, or a causal relationship between vulvar disease and POP.
الإفصاحات
The authors declare no conflicts of interest.
AUTHORS’ CONTRIBUTION:
Fei Wu and Lisha Peng conceived and designed the study, wrote and revised the manuscript, collected and analyzed data. All authors read and approved the final submitted manuscript.
المواد
| الاسم | الشركة | رقم فهرسي | التعليقات |
|---|---|---|---|
| Centrifuge | Eppendorf | 5811 000 015 | Eppendorf 5810 R refrigerated centrifuge (without rotor). Used for serum preparation. |
| Electronic medical records system | Chongqing Medical University (in-house system) | N/A | Patient screening and retrospective clinical data retrieval |
| Flow cytometer | BD Biosciences | 338960 | BD FACSCanto II Flow Cytometer (3-laser, 8-color configuration). Used for cytokine quantification by flow cytometry. |
| Multiplex cytokine detection kit | Qingdao Raisecare Biotechnology Co., Ltd. | RaiseCyte 2L6C (Cat. No. R2L6C22A190) | Detection of IFN-α, IFN-γ, IL-1β, IL-2, IL-4, IL-5, IL-6, IL-8, IL-10, IL-12p70, IL-17, and TNF-α. 12-plex cytokine assay kit |
| Serum blood collection tubes | BD (Becton, Dickinson and Company) | 367812 | BD Vacutainer Plus Plastic Serum Tube (4 mL, with clot activator). Used for preoperative and postoperative serum collection. |
| SPSS Statistics, version 22.0 | IBM Corp. | Version 22.0 | Statistical analysis |
المراجع
- De Luca DA et al. Lichen sclerosus: The 2023 update. Front Med (Lausanne). 2023;10:1106318.
- Pope R et al. Lichen Sclerosus and Sexual Dysfunction: A Systematic Review and Meta-Analysis. The journal of sexual medicine. 2022;19(11):1616-24.
- Baandrup L, Hannibal CG, Hertzum-Larsen R, Kjær SK. Biopsy-verified vulvar lichen sclerosus: Incidence trends 1997-2022 and increased risk of vulvar squamous precancer and squamous cell carcinoma. Int J Cancer. 2024;155(3):501-7.
- Vieira-Baptista P et al. Risk of Development of Vulvar Cancer in Women With Lichen Sclerosus or Lichen Planus: A Systematic Review. Journal of lower genital tract disease. 2022;26(3):250-7.
- Deprest JA, et al. International Urogynecological Consultation (IUC): pathophysiology of pelvic organ prolapse (POP). Int Urogynecol J. 2022;33(7):1699-710.
- Schulten SFM, et al. Risk factors for primary pelvic organ prolapse and prolapse recurrence: an updated systematic review and meta-analysis. Am J Obstet Gynecol. 2022;227(2):192-208.
- Brown HW, et al. International Urogynecology Consultation, Chapter 1, Committee 2: Epidemiology of Pelvic Organ Prolapse: Prevalence, Incidence, Natural History, and Service Needs. Int Urogynecol J. 2022;33(2):173-87.
- Peinado Molina RA, Hernández Martínez A, Martínez Vázquez S, Martínez Galiano JM. Influence of pelvic floor disorders on quality of life in women. Front Public Health. 2023;11:1180907.
- Krishnamurthy HK, et al. Oxidative stress: fundamentals and advances in quantification techniques. Frontiers in chemistry. 2024;12:1470458.
- Wu X, Liu X, Li T. Potential molecular targets for intervention in pelvic organ prolapse. Front Med (Lausanne). 2023;10:1158907.
- Xie X, Wu K. Advances in the pathogenesis of vulvar lichen sclerosus. Mol Biol Rep. 2024;51(1):396.
- Shi W, Guo L. Risk factors for the recurrence of pelvic organ prolapse: a meta-analysis. J Obstet Gynaecol. 2023;43(1):2160929.
- Barber MD. Measuring Pelvic Organ Prolapse: An Evolution. Int Urogynecol J. 2024;35(5):967-76.
- Tejchman K, Kotfis K, Sieńko J. Biomarkers and Mechanisms of Oxidative Stress-Last 20 Years of Research with an Emphasis on Kidney Damage and Renal Transplantation. Int J Mol Sci. 2021;22(15).
- Li J, Pan L, Pan W, Li N, Tang B. Recent progress of oxidative stress associated biomarker detection. Chemical communications (Cambridge, England). 2023;59(48):7361-74.
- Habes D, Kestranek J, Stranik J, Kacerovsky M, Spacek J. Is there an association between pelvic organ prolapse and oxidative stress? A systematic review. PloS one. 2022;17(8):e0271467.
- Habes D, et al. Noninvasive assessment of oxidative stress in pelvic organ prolapse: a feasibility study. Scientific reports. 2025;16(1):1521.
- Jomova K, et al. Several lines of antioxidant defense against oxidative stress: antioxidant enzymes, nanomaterials with multiple enzyme-mimicking activities, and low-molecular-weight antioxidants. Archives of toxicology. 2024;98(5):1323-67.
- Chai YC, Mieyal JJ. Glutathione and Glutaredoxin-Key Players in Cellular Redox Homeostasis and Signaling. Antioxidants (Basel, Switzerland). 2023;12(8).
- Yan Y, et al. SGK1 inhibits oxidative injury and extracellular matrix degradation by activating the GSK-3β (Ser9)/Fyn/NRF2 pathway in pelvic organ prolapse. Life Sci. 2025;380:123939.
- Jiang W, Cheung RYK, Chung CY, Chan SSC, Choy KW. Genetic Etiology in Pelvic Organ Prolapse: Role of Connective Tissue Homeostasis, Hormone Metabolism, and Oxidative Stress. Genes. 2024;16(1).
- Tian Z, Li Q, Wang X, Sun Z. The difference in extracellular matrix metabolism in women with and without pelvic organ prolapse: A systematic review and meta-analysis. Bjog. 2024;131(8):1029-41.
- Li Y, et al. Structural, functional, and molecular pathogenesis of pelvic organ prolapse in patients and Loxl1-deficient mice. Aging. 2021;13(24):25886-902.
- Guler Z, Roovers JP. Role of Fibroblasts and Myofibroblasts on the Pathogenesis and Treatment of Pelvic Organ Prolapse. Biomolecules. 2022;12(1).
- Deng ZM, et al. Advances in molecular mechanisms of pelvic organ prolapse (Review). Exp Ther Med. 2021;22(3):1009.
- Wu H, et al. Roles and mechanisms of biomechanical-biochemical coupling in pelvic organ prolapse. Front Med (Lausanne). 2024;11:1303044.
- Geisler AN, Koptyev J, Strunk A, Shah PR, Garg A. Quality of Life and Treatment Adherence in Patients with Vulvar Lichen Sclerosus. Dermatology. 2023;239(3):494-8.
- Arnold S, Fernando S, Rees S. Living with vulval lichen sclerosus: a qualitative interview study. Br J Dermatol. 2022;187(6):909-18.