This randomized controlled study evaluated whether NOL-guided multimodal analgesia, including an external oblique intercostal plane (EOIP) block, improves nociceptive control and early postoperative pain during laparoscopic cholecystectomy. EOIP block-based multimodal analgesia reduced nociception responses during pneumoperitoneum and lowered emergence pain without increasing opioid use, indicating improved perioperative analgesic efficiency.
مقالة بحثية
Nociception Level-Guided Multimodal Analgesia with External Oblique Intercostal Plane Block in Laparoscopic Cholecystectomy
في هذه المقالة
ملخص
الملخص
Effective perioperative analgesia remains essential in laparoscopic cholecystectomy (LC), where pneumoperitoneum produces the most intense nociceptive stimulus despite the minimally invasive nature of the procedure. Objective monitoring of nociception using the nociception level (NOL) index may optimize intraoperative opioid titration; however, its integration into multimodal analgesia (MMA) strategies incorporating regional techniques has not been adequately studied. The study was conducted using a double-blind design in which patients and the postoperative outcome assessor were blinded to group allocation, whereas the investigator performing the EOIP block was necessarily unblinded. This randomized controlled trial investigated whether NOL-guided MMA, including an external oblique intercostal plane (EOIP) block, improves intraoperative nociceptive control and early postoperative pain compared with conventional intravenous analgesia. Sixty-two ASA I-II adults undergoing elective LC were randomized to receive either an EOIP block with dexketoprofen and magnesium infusion or intravenous dexketoprofen alone. In both groups, remifentanil infusion was titrated according to predefined NOL thresholds, and anesthetic depth was maintained using BIS monitoring. NOL values during pneumoperitoneum were significantly lower in the MMA group (mean difference: 13.51; 95% CI: 4.68-22.34; p < 0.004), indicating superior attenuation of peak nociceptive responses. Emergence pain scores were also reduced in the MMA group (p < 0.001), whereas total remifentanil consumption did not differ between groups. Sevoflurane requirements and extubation times were significantly lower in the MMA group, suggesting a potential anesthetic-sparing effect. No differences were observed in postoperative opioid rescue, nausea/vomiting, or other adverse events. These findings demonstrate that NOL-guided MMA incorporating EOIP block enhances intraoperative nociceptive stability and improves early postoperative analgesia without increasing opioid use. Larger multicenter studies are warranted to confirm these results and further refine NOL-integrated multimodal analgesic strategies.
المقدمة
Laparoscopic cholecystectomy is one of the most commonly performed abdominal procedures worldwide. Although minimally invasive, LC produces a complex pain profile involving parietal, visceral, and referred components, with pneumoperitoneum representing the most intense nociceptive stimulus during the operation. Consequently, effective perioperative analgesia is essential to enhance recovery, reduce opioid-related adverse effects, and improve overall patient comfort.
MMA strategies combining systemic non-opioid agents with regional anesthesia techniques are widely recommended to reduce opioid exposure and improve postoperative pain outcomes1,2,3. Magnesium sulfate, through NMDA receptor antagonism, may attenuate central sensitization and prolong the duration of regional blocks when used as an adjuvant3. Several regional techniques, including the transversus abdominis plane block, erector spinae plane block, and modified thoracoabdominal nerve blocks, have demonstrated efficacy for abdominal wall analgesia4,5,6. However, their coverage of the anterior and lateral upper abdominal dermatomes may be incomplete. The EOIP block, a recently described interfascial technique, provides targeted analgesia to the upper abdominal wall by distributing local anesthetic to the lateral and anterior cutaneous branches of the intercostal nerves6,7. Traditional intraoperative nociception assessment relies on indirect physiological indicators such as hemodynamic changes, lacrimation, sweating, or pupillary responses, all of which are susceptible to confounding factors8,9. Digital nociception monitors, including the NOL index, pupillometry, surgical pleth index, and analgesia nociception index, have been developed to provide more objective evaluation of nociceptive responses under general anesthesia10,11,12,13. Among these, the NOL index integrates multiple physiological signals into a single numeric value, enabling real-time opioid titration.
Despite increasing interest in nociception-guided analgesia, the integration of NOL monitoring into MMA strategies incorporating novel regional techniques, such as the EOIP block, has not been adequately investigated. This randomized controlled study, therefore, aimed to determine whether NOL-guided MMA, including an EOIP block, provides superior intraoperative nociceptive control and improved early postoperative pain compared with conventional intravenous analgesia in patients undergoing LC. The authors hypothesized that EOIP-based MMA would attenuate nociceptive responses during pneumoperitoneum and reduce emergence pain without increasing opioid consumption under NOL-guided titration.
البروتوكول
This prospective, single-center randomized controlled trial was conducted at Ankara Bilkent City Hospital between February and June 2024. Ethical approval was obtained from the institutional review board (E2-23-4785), and the study was registered at ClinicalTrials.gov (NCT06238830). All participants provided written informed consent prior to enrollment. The trial followed a double-blind design: patients and the investigator responsible for postoperative outcome assessment were blinded to group allocation, whereas the anesthesiologist performing the EOIP block could not be blinded because of the nature of the intervention (Table of Materials).
Study population
A total of sixty-two ASA I-II adults aged 18-65 years scheduled for elective laparoscopic cholecystectomy were included in the trial. Patients with a BMI ≥35 kg/m2, contraindications to regional anesthesia, chronic opioid therapy, significant cardiopulmonary disease, coagulopathy, infection at the injection site, or refusal of regional techniques were excluded. Enrollment was performed by a research nurse who was not involved in perioperative care, and group allocation followed a computer-generated randomization sequence placed in sequentially numbered, sealed opaque envelopes to maintain allocation concealment. A CONSORT flow diagram summarizes screening, randomization, follow-up, and analysis. The sample-size calculation, based on anticipated differences in NOL values during pneumoperitoneum (α = 0.05, 80% power, effect size 0.75), indicated a requirement of 28 participants per group; ultimately, 31 patients were included in each arm. No missing data occurred, and all analyses were conducted according to the intention-to-treat principle. All adverse events were documented, with no complications attributable to the EOIP block, and comparable postoperative nausea and vomiting rates between groups.
Randomization and allocation
Participants were allocated to the study groups in a 1:1 ratio using a computer-generated randomization list created by a research nurse who had no involvement in perioperative care. To maintain concealment, each assignment was placed into consecutively numbered, opaque, sealed envelopes, which were opened only immediately before the intervention. The EOIP block was administered by a single experienced anesthesiologist, whereas intraoperative management and postoperative evaluations were performed by clinicians who remained blinded to group allocation throughout the study.
Interventions
Patients were assigned to either the MMA group or the intravenous analgesia group (control). The MMA group received an EOIP block group, intravenous dexketoprofen, and magnesium sulfate. The control group received intravenous dexketoprofen alone. Dexketoprofen is routinely used in the institution for LC and is supplied through centralized hospital procurement, making it the standard non-opioid analgesic in the perioperative protocol.
EOIP block technique
The EOIP block was performed after induction of anesthesia and before surgical incision. With the patient in the supine position, a linear ultrasound probe was placed in a sagittal orientation between the mid-clavicular and anterior axillary lines at the level of the sixth rib. After identifying the seventh rib near the xiphoid process, the probe was moved cranially to visualize the interfascial plane between the external oblique and intercostal muscles. A peripheral block needle was advanced in-plane from superomedial to inferolateral, and 20 mL of 0.25% bupivacaine was injected after negative aspiration. Ropivacaine, the preferred agent for upper abdominal blocks, is not available in the country; therefore, bupivacaine was used. At this diluted concentration and given the interfascial nature of the block, motor blockade was not observed.
Systemic analgesics
All patients received 50 mg intravenous dexketoprofen. Magnesium sulfate was administered in the MMA group as a 30 mg/kg bolus followed by a 10 mg/kg/h infusion. Magnesium acts as an NMDA receptor antagonist and may prolong block duration and reduce central sensitization3.
Anesthesia management
Standard ASA monitoring, nociception level (NOL) index monitoring, and bispectral index (BIS) monitoring were applied. Anesthesia induction consisted of fentanyl 1 μg/kg, propofol 2-3 mg/kg, and rocuronium 0.6 mg/kg. Maintenance was achieved with 50% oxygen-air mixture, and sevoflurane was titrated to maintain BIS between 40 and 50.
NOL-guided remifentanil titration
Remifentanil infusion was initiated at 0.01-0.2 μg/kg/min. When NOL exceeded 25 for ≥2 min, the infusion was increased by 0.02 μg/kg/min. When NOL fell below 10, the infusion was reduced by 0.02 μg/kg/min. This algorithm was applied identically in both groups. NOL values were recorded at predefined nociceptive time points: intubation, incision, trocar insertion, pneumoperitoneum insufflation, pneumoperitoneum release, and skin closure.
Postoperative management
Upon extubation, patients were transferred to the post-anesthesia care unit (PACU). Pain was assessed using the visual analog scale (VAS) at 0, 15, 30, and 60 min. The 0 min VAS corresponded to PACU arrival immediately after emergence. Rescue analgesia consisted of 50 mg intravenous tramadol for VAS > 4. All patients received 8 mg intravenous ondansetron prophylactically before emergence, consistent with institutional practice. Apfel scores were not calculated because all patients underwent the same laparoscopic procedure and received standardized prophylaxis. Nausea and vomiting were recorded during PACU follow-up. Modified Aldrete scores were assessed for PACU discharge readiness but were not included as study outcomes; therefore, they were removed from the Results section for consistency.
Outcomes
The primary outcomes were intraoperative NOL values during predefined nociceptive stimuli and total remifentanil consumption. The secondary outcomes were postoperative VAS scores, sevoflurane consumption, and extubation time. Pneumoperitoneum NOL response was a prespecified comparison because pneumoperitoneum represents the peak nociceptive stimulus in LC.
Statistical analysis
Data were analyzed using IBM SPSS Statistics 25. Normality was assessed using Shapiro-Wilk and homogeneity using Levene's test. Continuous variables were compared using Student's t-test or Mann-Whitney U test as appropriate. Categorical variables were analyzed using continuity-corrected χ2 or Fisher-Freeman-Halton tests. Repeated-measures ANOVA was used for longitudinal hemodynamic and NOL data, with Huynh-Feldt correction applied when sphericity was violated. Significant interactions were explored using Bonferroni-adjusted post-hoc tests. Effect sizes (mean differences with 95% confidence intervals and partial eta squared) were reported for primary and relevant secondary outcomes. All analyses followed an intention-to-treat approach.
النتائج
There were no statistically significant differences between the groups in mean age, sex distribution, or ASA classification (p > 0.05) (Table 1).
Intraoperative variables
Extubation time was significantly shorter in the MMA group compared with the control group (p = 0.016). Sevoflurane consumption was also lower in the MMA group (p = 0.024). Total remifentanil consumption and the pattern of remifentanil dose adjustments did not differ significantly between the groups (p > 0.05), consistent with the standardized NOL-guided titration protocol applied to both groups (Table 2). Repeated-measures analysis demonstrated no significant Group × Time interaction for mean arterial pressure (F = 0.621, p = 0.643), pulse rate (F = 0.606, p = 0.650), or oxygen saturation (F = 0.961, p = 0.378), indicating similar hemodynamic stability across groups (Table 3).
Nociception level (NOL) responses
A significant Group × Time interaction was observed for NOL values (p < 0.001). In the MMA group, NOL values decreased significantly from incision onward compared with intubation (p < 0.001). Pneumoperitoneum was the prespecified peak nociceptive stimulus, and NOL values during insufflation were significantly lower in the MMA group than in the control group (19.39 ±; 12.69 vs. 32.90 ±; 21.06; mean difference 13.51; 95% CI 4.68-22.34; Cohen's d = 0.78; p = 0.004). Within-group comparisons showed that insufflation produced significantly higher NOL values than incision, deflation, and closure (Bonferroni-adjusted p < 0.025) (Table 4) (Figure 1).
Postoperative pain
VAS scores differed significantly between groups only at the 0-minute assessment (PACU arrival), with lower pain scores in the MMA group (p < 0.001). No significant differences were observed at 15, 30, or 60 min (p > 0.0125 after Bonferroni correction). Rescue tramadol requirements were similar between groups (p > 0.05) (Table 5) (Figure 2).
Postoperative nausea and vomiting (PONV)
The incidence of nausea/vomiting did not differ significantly between the MMA and control groups (19.35% vs. 25.81%; p = 0.762). All patients received standardized ondansetron prophylaxis, and no additional antiemetic interventions were required. Shoulder pain and pruritus were not observed in either group.
EOIP block success and adverse events
No block-related complications, motor weakness, or local anesthetic systemic toxicity were observed. Although block success was not formally quantified, no patient exhibited clinical signs suggestive of block failure. No adverse events occurred in either group.
DATA AVAILABILITY:
The datasets generated and analyzed in this study are stored in the secure institutional research archive of Ankara Bilkent City Hospital. De-identified raw data supporting the findings are available from this repository: https://figshare.com/s/f058000111d5a2cf53cc. The full study protocol is available on ClinicalTrials.gov under registration number NCT06238830. The CONSORT flow diagram is given in Figure 3.
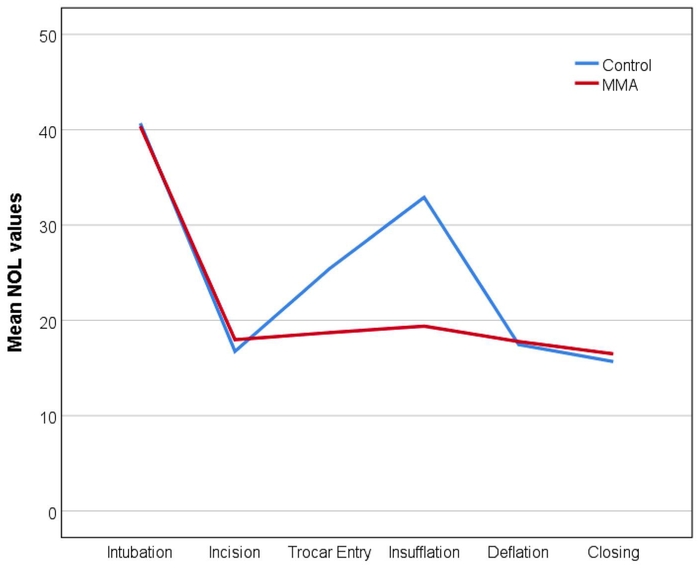
Figure 1: Intraoperative NOL trends. Mean NOL values recorded at predefined intraoperative nociceptive stages, including intubation, skin incision, trocar insertion, pneumoperitoneum insufflation, pneumoperitoneum release, and skin closure, show that the MMA group exhibited significantly lower NOL values during pneumoperitoneum, indicating enhanced attenuation of peak nociceptive responses under NOL-guided opioid titration. Please click here to view a larger version of this figure.
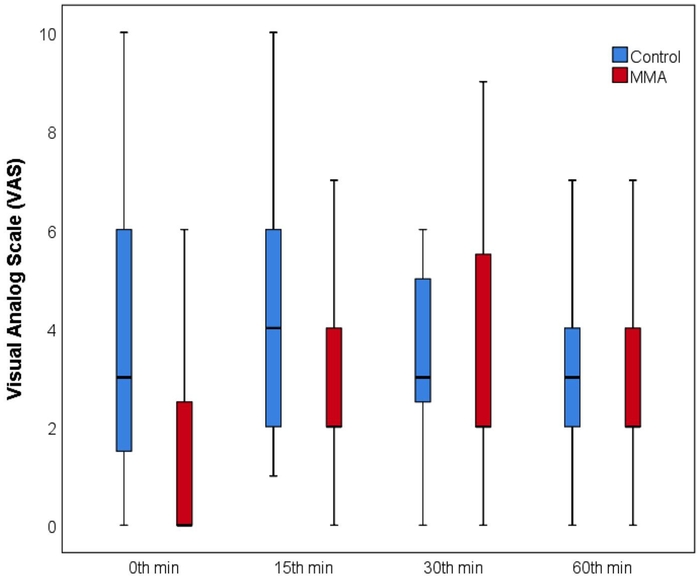
Figure 2: Postoperative VAS scores. Postoperative visual analog scale (VAS) pain scores assessed at PACU arrival (0 min), 15 min, 30 min, and 60 min demonstrate significantly reduced emergence pain in the MMA group at 0 min, with no significant differences at later time points. Please click here to view a larger version of this figure.
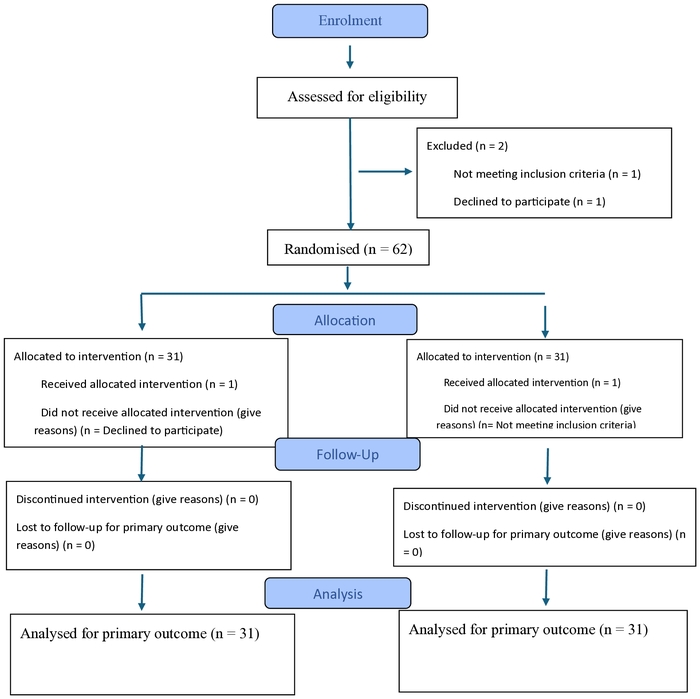
Figure 3: CONSORT flow diagram. Flow chart summarizing screening, randomization, follow-up, and analysis for all enrolled participants. Please click here to view a larger version of this figure.
Table 1: Baseline characteristics. Baseline demographic and clinical characteristics, including age, sex distribution, and ASA physical status, show no significant differences between groups, confirming successful randomization and CONSORT-compliant baseline comparability. Please click here to download this Table.
Table 2: Intraoperative variables. Intraoperative anesthetic and analgesic variables, including extubation time, sevoflurane consumption, total remifentanil dose, and number of remifentanil dose adjustments, indicate shorter extubation time and lower sevoflurane use in the MMA group, while remifentanil-related parameters remained comparable due to standardized NOL-guided titration. Please click here to download this Table.
Table 3: Hemodynamic parameters. Hemodynamic parameters (mean arterial pressure, pulse rate, and oxygen saturation) recorded at intubation, incision, trocar entry, insufflation, deflation, and closure show similar stability across groups, with no significant Group × Time interaction. Please click here to download this Table.
Table 4: NOL values by stage. NOL values measured at each surgical stage indicate that pneumoperitoneum insufflation is the peak nociceptive stimulus, with significantly lower NOL values in the MMA group at this prespecified point and time-dependent nociceptive fluctuations within groups. Data are displayed as mean ±; SD. The comparisons between groups, Student's t-test, according to the Bonferroni correction p < 0.0083 were considered statistically significant; Intra-group comparisons, Repeated Measures of ANOVA via Wilks' Lambda test, according to the Bonferroni correction p < 0.025 were considered statistically significant. The difference between intubation was found to be statistically significant (p < 0.001); The difference between incisions was found to be statistically significant (p = 0.002); The difference between insufflation was found to be statistically significant (p < 0.025). Please click here to download this Table.
Table 5: Postoperative VAS scores. Postoperative VAS scores at 0, 15, 30, and 60 min after PACU arrival reveal significantly lower pain at 0 min in the MMA group, with comparable scores thereafter and similar rescue tramadol requirements between groups. Data are displayed as median (25th-75th percentile). a The comparisons between groups, Mann-Whitney U test, according to the Bonferroni correction, p < 0.0125, were considered statistically significant; b intra-group comparisons, Friedman test, according to the Bonferroni correction, p < 0.025, were considered statistically significant. A 0th min vs 15th min (p < 0.001), B 0th min vs 30th min (p < 0.001), C 0th min vs 60th min (p < 0.001). Please click here to download this Table.
المناقشة
This randomized controlled study demonstrates that MMA incorporating the EOIP block provides superior attenuation of intraoperative nociceptive responses during LC, as reflected by significantly lower NOL values during pneumoperitoneum. Because pneumoperitoneum represents the most intense nociceptive stimulus in LC, the reduction in NOL values at this prespecified time point suggests that the MMA strategy effectively modulates the parietal pain component of the procedure. The consistent decrease in NOL values from incision onward in the MMA group further supports improved nociceptive stability under NOL-guided opioid titration.
Although the EOIP block contributed to improved nociceptive control, the MMA protocol also included dexketoprofen and magnesium sulfate, both of which may have enhanced the analgesic background. Magnesium, an NMDA receptor antagonist, has been shown to reduce central sensitization and prolong the duration of regional blocks3,4. Therefore, the observed effects should be interpreted as the combined impact of the MMA regimen rather than the isolated effect of the EOIP block. This distinction is important because visceral pain cannot be fully addressed by EOIP block alone, and the multimodal combination likely contributed to the overall analgesic benefit5-9.
In line with previous studies evaluating nociception-guided analgesia3,10,13, remifentanil consumption did not differ between groups. This finding may be explained by the minimally invasive nature of LC and the use of NOL-guided titration in both groups, which likely minimized intergroup variability in opioid dosing. The reduction in emergence pain (VAS at 0 min) in the MMA group is consistent with the expected duration of bupivacaine and the analgesic contribution of magnesium. However, the absence of differences in later postoperative VAS scores and rescue tramadol requirements suggests that both analgesic strategies provided adequate postoperative pain control for LC. The lower sevoflurane consumption and shorter extubation time observed in the MMA group may indicate an anesthetic-sparing effect. Nevertheless, this interpretation should be made cautiously. Although BIS values were maintained between 40 and 50 in both groups, hypnotic depth does not directly reflect analgesic adequacy, and sevoflurane itself has antinociceptive properties that may influence NOL values. Differences in sevoflurane requirements may therefore reflect improved analgesic background rather than a true reduction in hypnotic need. Future studies should consider standardizing inhalational anesthetic dosing more strictly to minimize this potential confounding factor.
The findings of this study align with previous reports demonstrating that nociception monitors can detect changes in nociceptive balance and guide individualized opioid administration10,11,13. However, the literature also includes studies reporting increased opioid use with nociception monitoring, highlighting the variability in responses depending on surgical type, anesthetic regimen, and monitoring algorithms. In this study, NOL monitoring provided consistent guidance for remifentanil titration, and the MMA strategy appeared to enhance nociceptive stability without increasing opioid exposure14,15,16,17. Previous studies have shown that the PMD10 NOL monitor can reliably track phase-dependent nociceptive changes during spinal surgery. In this study, NOL values followed a similar pattern, increasing during periods of heightened surgical stimulation and remaining stable during phases with minimal nociceptive input17,18. These phase-specific fluctuations appeared to reflect autonomic responses more directly than hemodynamic parameters alone. The dynamic NOL trends observed in the cohort provided consistent guidance for opioid titration across surgical stages with differing nociceptive loads. Overall, the findings suggest that the NOL system may serve as an additional objective tool for intraoperative nociception monitoring and contribute to a more structured approach to analgesic management during abdominal procedures.
This study has several limitations. First, it was conducted at a single center with a relatively small sample size, which may limit generalizability. Second, although randomization was performed using concealed allocation, the design was single-blind; the investigator performing the block was not blinded, which may introduce performance bias. Third, EOIP block success was not formally assessed using sensory testing because patients were under general anesthesia; therefore, block efficacy could not be objectively confirmed. Fourth, sevoflurane consumption may have been influenced by factors unrelated to nociception, including individual anesthetic requirements and the intrinsic antinociceptive effects of volatile agents. Finally, the MMA protocol included multiple analgesic components, preventing isolation of the EOIP block's independent effect.
Despite these limitations, the study provides evidence that NOL-guided MMA incorporating EOIP block enhances intraoperative nociceptive control and reduces early postoperative pain without increasing opioid consumption in LC. Larger multicenter trials with standardized anesthetic protocols and formal block assessment are warranted to further clarify the role of EOIP block within multimodal analgesic strategies and to refine the integration of nociception monitoring in perioperative care. In this randomized controlled study, NOL-guided MMA incorporating the EOIP provided enhanced intraoperative nociceptive stability and reduced early postoperative pain during laparoscopic cholecystectomy. The attenuation of NOL responses during pneumoperitoneum, the most intense nociceptive phase of the procedure, highlights the targeted benefit of the MMA strategy. Despite these improvements, total remifentanil consumption and later postoperative pain scores remained comparable between groups, likely reflecting the standardized NOL-guided opioid titration applied to all patients. The observed reduction in sevoflurane consumption and shorter extubation time suggest a potential anesthetic-sparing effect, although this finding should be interpreted with caution due to the intrinsic antinociceptive properties of volatile agents. Overall, NOL-guided MMA appears to offer meaningful perioperative advantages without increasing opioid exposure. Larger multicenter trials with standardized anesthetic protocols and formal block assessment are needed to further define the role of EOIP block within multimodal analgesic strategies and to refine the integration of nociception monitoring in perioperative care.
Other nociception monitors have also been used to assess intraoperative analgesic balance. Pupillometry reflects sympathetic activation through changes in pupil diameter, SPI combines plethysmographic waveform and heart rate to estimate nociceptive load, and ANI evaluates parasympathetic tone via heart rate variability. Each device captures a different autonomic component, whereas the NOL index integrates multiple physiological signals, offering a more comprehensive assessment. This multimodal structure may explain the consistent stage-dependent NOL trends observed in this study. Comparative research is needed to determine which monitoring system provides the most reliable guidance across various surgical settings9.
الإفصاحات
Artificial intelligence tools were used solely for language editing, formatting assistance, and figure caption refinement during manuscript preparation. No AI tools were used for data collection, data analysis, statistical interpretation, or scientific decision-making. All authors reviewed and verified the accuracy and integrity of the final manuscript.
Author Contributions:
Bilge Aslan contributed to study conception and design, performed intraoperative assessments, collected data, conducted statistical analysis, and drafted the manuscript. Sena Sarıcaoglu Oktem performed the EOIP blocks. Aysun Ersen Yungul performed postoperative VAS evaluations. Mustafa Turan contributed to methodological development and assisted with data acquisition. Erdal Ozcan performed intraoperative NOL monitoring and remifentanil titration. Feray Aydın contributed to data interpretation. Ayca Tuba Dumanlı Ozcan supervised perioperative management, contributed to patient recruitment, and critically revised the manuscript for important intellectual content. Levent Ozturk contributed to surgical coordination and manuscript revision. All authors reviewed and approved the final manuscript and agree to be accountable for all aspects of the work.
شكر وتقدير
We thank the operating room and PACU staff of Ankara Bilkent City Hospital for their support during the conduct of this study. We thank Seyma Ozsonmez, a research nurse not involved in patient care. This study received no external or commercial funding. All interventions, materials, and medications used were part of the standard clinical practice in our department and were provided through routine institutional resources.
المواد
| الاسم | الشركة | رقم فهرسي | التعليقات |
|---|---|---|---|
| BIS Brain Monitoring System | Medtronic | https://www.medtronic.com | |
| Bupivacaine 0.25% | Various manufacturers (hospital supply) | N/A | |
| ClinicalTrials.gov Registry | U.S. NIH | https://clinicaltrials.gov | |
| Dexketoprofen (IV) | Menarini Group | N/A | |
| Echoplex+ Peripheral Block Needle | Vygon™, France | https://www.vygon.com | |
| EOIP Block (Technique) | -- | Elsharkawy et al., Pain Med 2021 | |
| IBM SPSS Statistics 25 | IBM | https://www.ibm.com/spss | |
| Linear Ultrasound Probe | GE Healthcare / Philips / Mindray | Model varies (hospital supply) | |
| Magnesium Sulfate (IV) | Various manufacturers | N/A | |
| NOL Index Monitor (PMD-100™) | Medasense Biometrics Ltd. | https://www.medasense.com | |
| Ondansetron (IV) | Various manufacturers | N/A | |
| Propofol | Various manufacturers | N/A | |
| Python | Python Software Foundation | https://www.python.org | |
| Remifentanil | Various manufacturers | N/A | |
| Rocuronium | Merck / Organon | N/A | |
| SPSS Statistics Software | IBM | N/A | |
| Tramadol (IV) | Various manufacturers | ||
| Ultrasound Device (for EOIP block) | GE Healthcare / Philips / Mindray | Model varies (hospital supply) |
المراجع
- Kehlet H, et al. A procedure-specific systematic review and consensus recommendations for postoperative analgesia following laparoscopic cholecystectomy. Surg Endosc. 2005;19(10):1396-1415.
- Toleska M, et al. Pain and multimodal analgesia in laparoscopic cholecystectomy. Pril (Makedon Akad Nauk Umet Odd Med Nauki). 2022;43(2):41-49.
- Tulgar S, Selvi O, Kapakli MS. Erector spinae plane block for different laparoscopic abdominal surgeries: case series. Case Rep Anesthesiol. 2018;2018:3947281.
- Hebbard PD, Barrington MJ, Vasey C. Ultrasound-guided continuous oblique subcostal transversus abdominis plane blockade: description of anatomy and clinical technique. Reg Anesth Pain Med. 2010;35(5):436-441.
- Elsharkawy H, et al. The external oblique intercostal block: anatomic evaluation and case series. Pain Med. 2021;22(11):2436-2442.
- White L, Ji A. External oblique intercostal plane block for upper abdominal surgery: use in obese patients. Br J Anaesth. 2022;128(5):e295-e297.
- Bourgeois C, et al. Pain management after laparoscopic cholecystectomy: a systematic review and procedure-specific postoperative pain management (PROSPECT) recommendations. Eur J Anaesthesiol. 2024;41(11):841-855.
- Buhre W, Rossaint R. Perioperative management and monitoring in anaesthesia. Lancet. 2003;362(9398):1839-1846.
- Hirose M, et al. Intraoperative assessment of surgical stress response using nociception monitor under general anesthesia and postoperative complications: a narrative review. J Clin Med. 2022;11(20):6080.
- Balan C, Tomescu DR, Bubenek-Turconi SI. Nociception control of bilateral single-shot erector spinae plane block compared to no block in open heart surgery: a post hoc analysis of the NESP randomized controlled clinical trial. Medicina (Kaunas). 2023;59(2):265.
- Funcke S, et al. Nociception level-guided opioid administration in radical retropubic prostatectomy: a randomised controlled trial. Br J Anaesth. 2021;126(2):516-524.
- Meijer FS, et al. Nociception-guided versus standard care during remifentanil-propofol anesthesia: a randomized controlled trial. Anesthesiology. 2019;130(5):745-755.
- Funcke S, et al. Guiding opioid administration by 3 different analgesia nociception monitoring indices during general anesthesia alters intraoperative sufentanil consumption and stress hormone release: a randomized controlled pilot study. Anesth Analg. 2020;130(5):1264-1273.
- Dundar N, Kus A, Gurkan Y, Toker K, Solak M. Analgesia nociception index (ANI) monitoring in patients with thoracic paravertebral block: a randomized controlled study. J Clin Monit Comput. 2018;32(3):481-486.
- Jain N, Gera A, Sharma B, Sood J, Chugh P. Comparison of Surgical Pleth Index-guided analgesia using fentanyl versus conventional analgesia technique in laparoscopic cholecystectomy. Minerva Anestesiol. 2019;85(4):358-365.
- Fuica R, et al. Reduced postoperative pain in patients receiving nociception monitor-guided analgesia during elective major abdominal surgery: a randomized, controlled trial. J Clin Monit Comput. 2023;37(2):481-491.
- Meijer FS, et al. Does nociception monitor-guided anesthesia affect opioid consumption? A systematic review of randomized controlled trials. J Clin Monit Comput. 2020;34(4):629-641.
- Khalaila A, et al. Intraoperative nociception monitoring using the NoL index: phase-specific assessment of nociceptive responses during spinal surgery. J Clin Med. 2025;14(24):8960.
إعادة الطباعة والأذونات
تم نشر هذه المقالة
الفيديو قريباً