توضح هذه الدراسة أن حبيبات Qiming (QMG) تعمل على تحسين اعتلال الشبكية السكري (DR) من خلال تعديل محور الأمعاء والشبكية. لقد أعادت QMG تشكيل ميكروبيوتا الأمعاء، وكبحت الالتهاب الجهازي، واستعادت الشبكة التنظيمية التي تتمحور حول CMKLR1، مما أدى إلى عكس التلف النسيجي المرضي للشبكية. وتجعل هذه النتائج من QMG استراتيجية علاجية واعدة تستهدف محور الأمعاء والشبكية لعلاج اعتلال الشبكية السكري.
مقالة بحثية
التحليل الارتباطي لحبيبات Qiming مع الشبكة المتمحورة حول CMKLR1 والالتهاب الجهازى عبر محور الأمعاء-الشبكية في اعتلال الشبكية السكري
في هذه المقالة
ملخص
الملخص
تعد اعتلال الشبكية السكري (DR) مضاعفة عصبية وعائية ناتجة عن ارتفاع نسبة السكر في الدم المزمن والالتهابات الجهازية، مع وجود أدلة ناشئة تسلط الضوء على محور الأمعاء-الشبكية كهدف علاجي حيوي ولكنه غير مستغل بشكل كافٍ. تبحث هذه الدراسة فيما إذا كانت حبيبات Qiming (QMG) تمارس فعاليتها الوقائية ضد اعتلال الشبكية السكري عن طريق تعديل محور الأمعاء-الشبكية. تم توزيع فئران C57BL/6 عشوائياً على مجموعات تجريبية وأخضعت لتدخلات مختلفة. تم تقييم التغيرات النسيجية المرضية للشبكية عن طريق صبغ Hematoxylin-Eosin (HE). وقِيست مستويات السيتوكينات الالتهابية في المصل (IL-1β, IL-6, TNF-α) باستخدام مقايسة الممتز المناعي المرتبط بالإنزيم (ELISA). كما تم الكشف عن تعبير البروتينات التنظيمية الرئيسية (CMKLR1, Wnt5a, PPAR-γ, AP-1, TP53) في كل من أنسجة الشبكية والقولون عن طريق لطخة ويسترن (WB). وتم توصيف تكوين وتنوع ميكروبيوم الأمعاء عن طريق تسلسل 16S rDNA كامل الطول. أُجريت تحليلات ارتباطية لتقييم العلاقات بين ميكروبيوم الأمعاء والعوامل الالتهابية أو البروتينات الرئيسية. أدى العلاج بـ QMG إلى تحسين التشوهات النسيجية المرضية في الشبكية، كما يتضح من استعادة البنية الصفائحية للشبكية، والتعافي الجزئي لأعداد خلايا العقد الشبكية (P < 0.001)، وعكس ترقق الشبكية (P < 0.01). كما خفض بشكل ملحوظ مستويات IL-1β وIL-6 وTNF-α في المصل (P < 0.0001). وعلى طول محور الأمعاء-الشبكية، عكس QMG التعبير غير الطبيعي للبروتينات التنظيمية الرئيسية، لاسيما الشبكة المتمحورة حول CMKLR1 (Wnt5a, PPAR-γ, AP-1, TP53). علاوة على ذلك، استعاد QMG تكوين وتنوع ووظيفة ميكروبيوم الأمعاء، وكشفت تحليلات الارتباط أن QMG يربط بين الالتهاب الجهازي وهذه البروتينات التنظيمية لتعديل محور الأمعاء-الشبكية. تقدم هذه الدراسة دليلاً فارماكولوجياً أولياً على أن QMG يحسن حالة اعتلال الشبكية السكري من خلال ربط الشبكة التنظيمية المتمحورة حول CMKLR1 (بما في ذلك Wnt5a وPPAR-γ وAP-1 وTP53) والالتهاب الجهازي عبر محور الأمعاء-الشبكية، مما يضع QMG كاستراتيجية علاجية واعدة لمحور الأمعاء-الشبكية في علاج اعتلال الشبكية السكري.
المقدمة
تعد اعتلال الشبكية السكري (DR)، وهي واحدة من أكثر المضاعفات الوعائية الدقيقة شيوعاً لمرض السكري (DM)، سبباً رئيسياً للعمى بين البالغين في سن العمل في جميع أنحاء العالم1. وعالمياً، يصيب اعتلال الشبكية السكري ما يقرب من 20-30% من مرضى السكري2. ويؤدي فرط سكر الدم المزمن إلى دفع إمراضية اعتلال الشبكية السكري من خلال تحفيز سلسلة من الأحداث المرضية، بما في ذلك ضعف الاقتران العصبي الوعائي، وزيادة الاستجابات الالتهابية، والإجهاد التأكسدي3. مؤخراً، لُحظت تغيرات في تنوع وتركيب ميكروبيوم الأمعاء لدى مرضى السكري المصابين باعتلال الشبكية مقارنة بأولئك غير المصابين به4,5. وبناءً على ذلك، برز محور الأمعاء والشبكية — وهو شبكة تواصل ثنائية الاتجاه تربط التوازن المعوي بصحة الشبكية — كمساهم جديد في تطور اعتلال الشبكية السكري. ومع ذلك، لا تزال الوسائط الجزيئية المحددة التي تترجم إشارات محور الأمعاء والشبكية إلى اعتلال مرضي في الشبكية غير معروفة إلى حد كبير، مما يحد من تحديد المؤشرات الحيوية والمستهدفات العلاجية الموثوقة.
يوضح المحور المعوي الشبكي شبكة اتصالات ثنائية الاتجاه ومعقدة بين ميكروبيوتا الأمعاء ونواتج أيضها مع أنسجة الشبكية عبر مسارات مناعية، وأيضية، وعصبية صماوية، ووعائية، مما يعمل على تنظيم توازنها الاستتبابي6. ومن الناحية الجزيئية، يتميز المحور المعوي الشبكي بخلل في تنظيم بروتينات رئيسية مسؤولة عن الاستجابة للإجهاد وتحديد مصير الخلايا، وتحديداً AP-1 و TP537,8,9. علاوة على ذلك، يبرز CMKLR1، وهو مستقبل كيموكين رئيسي، كوسيط أساسي في الخلل الوظيفي للبطانة واختلال التنظيم الأيضي، مما يشكل رابطاً حرجاً بين تغيرات ميكروبيوتا الأمعاء وإمراضية اعتلال الشبكية السكري10. ومن الأهمية بمكان أن إشارات Wnt تنسق أدواراً تنظيمية مزدوجة في الحفاظ على التوازن الوعائي للشبكية ووظيفة الحاجز الظهاري المعوي11، بينما تعمل إشارات PPAR كمنظم رئيسي للاستجابات الالتهابية والعمليات الأيضية في كل من الأنسجة العينية والمعوية12,13. وتشكل هذه العناصر الجزيئية مجتمعة شبكة إشارات مترابطة ضمن المحور المعوي الشبكي، مما يقدم رؤى ميكانيكية جديدة وفرصاً علاجية للمضاعفات المرتبطة بمرض السكري. وبناءً على ذلك، فإن استهداف التغيرات التركيبية والوظيفية على طول هذا المحور يمثل استراتيجية واعدة لإدارة اعتلال الشبكية السكري (DR).
لعب الطب الصيني التقليدي (TCM) تاريخياً دوراً هاماً في علاج داء السكري واعتلال الشبكية المرتبط به، حيث استندت القرارات العلاجية إلى تمييز المتلازمات14. وتُستخدم حبيبات تشيمينغ (QMG)، المكونة من Astragalus membranaceus, Pueraria lobata, Rehmannia glutinosa, Lycium barbarum, Senna obtusifolia, Leonurus japonicus, Typha angustifolia, و Whitmania pigra، على نطاق واسع في علاج اعتلال الشبكية السكري (DR). وقد اجتازت حبيبات QMG، المعتمدة من قبل الإدارة الوطنية للمنتجات الطبية في الصين (رقم الموافقة Z20090036)، التجارب السريرية بنجاح وحصلت على ترخيص التسويق. وتظهر حبيبات QMG تأثيرات وقائية من خلال منع تسمك الغشاء القاعدي في الشعيرات الدموية الشبكية، وتقليل الضرر الذي يلحق بالخلايا الحولية والأوعية الدموية الدقيقة في الشبكية، والحفاظ على المورفولوجيا المرضية المحلية للعين15، مما يجعلها علاجاً واعداً للتصدي لاعتلال الشبكية السكري. ومن خلال استهداف البروتينات الرئيسية والعوامل الالتهابية، تفرض المكونات النشطة في QMG تأثيرات مضادة للالتهابات، ومضادة للأكسدة، ومضادة لموت الخلايا المبرمج، مما يوفر أساساً ميكانيكياً لتعديلها لـ محور الأمعاء والشبكية16. توفر هذه الخصائص أساساً ميكانيكياً للتعديل المحتمل الذي تجريه QMG على محور الأمعاء والشبكية، ومع ذلك، استكشفت دراسات قليلة هذه الصلة. لذلك، تهدف هذه الدراسة إلى التحقق من فعالية حبيبات QMG في تعديل محور الأمعاء والشبكية، مما يوفر دليلاً تجريبياً على إمكاناتها العلاجية في حالات اعتلال الشبكية السكري.
تربط هذه الدراسة التنبؤات النظرية بالبيانات التجريبية داخل الجسم الحي للتحقق من فعالية QMG في تعديل المحور المعوي الشبكي. وتظهر هذه النتائج أن QMG يحسن من اعتلال الشبكية السكري (DR) من خلال ربط الشبكة التنظيمية المتمحورة حول CMKLR1 (بما في ذلك Wnt5a وPPAR-γ وAP-1 وTP53) بالالتهاب الجهازي عبر المحور المعوي الشبكي، مما يجعل QMG استراتيجية علاجية واعدة لاستهداف المحور المعوي الشبكي في علاج اعتلال الشبكية السكري. ويظهر الملخص الرسومي في الشكل 1.
البروتوكول
أُجريت جميع التجارب على الحيوانات وفقاً لإرشادات ARRIVE. وقد تمت الموافقة على الدراسة من قبل لجنة مراجعة أخلاقيات البحث في شركة Sichuan Scientist Biotechnology Co., Ltd. (IACUC ISSUE SYST-2024-011). ويتوفر جدول زمني تجريبي مفصل يلخص تصميم الدراسة في الشكل التكميلي 1.
تحضير الحيوانات ومعالجتها
خُدرت الفئران تخديرًا عميقًا باستنشاق isoflurane بنسبة 2%. وتحت تأثير التخدير العميق، جُمعت عينات الدم عن طريق استئصال العين من خلف المحجر. وفور جمع الدم، استؤصلت مقلتا العين لحصد أنسجة الشبكية. وعقب ذلك، تم إجراء خلع رقبي تحت التخدير العميق لضمان القتل الرحيم. ثم شُرِّحت أنسجة القولون على الفور. أما الحيوانات التي ظهرت عليها آثار جانبية فقد استُبعدت فورًا من الدراسة وتلقت الرعاية البيطرية المناسبة.
العشوائية والتعمية
تم إيواء فئران ذكور من سلالة C57BL/6، تبلغ من العمر 5 أسابيع وتتراوح أوزانها بين 20 و30 جراماً، في ظروف خاضعة لرقابة صارمة، بما في ذلك درجة الحرارة والرطوبة. وبعد أسبوع من فترة التأقلم، تم توزيع فئران C57BL/6 عشوائياً على ثلاث مجموعات (المجموعة الضابطة، ومجموعة النموذج، ومجموعة التدخل) باستخدام تسلسل أرقام عشوائية تم إنشاؤه بواسطة الحاسوب. وقد تولى إنشاء تسلسل التوزيع العشوائي باحث لم يشارك في التعامل مع الحيوانات أو تقييم النتائج.
لضمان التعمية، قام باحثون غير مدركين لتوزيع المجموعات بجميع إجراءات رعاية الحيوان، وإعطاء الأدوية، وجمع البيانات. ولم يتم الكشف عن رموز توزيع المجموعات إلا بعد الانتهاء من جميع التجارب والتحليلات الإحصائية. وقد شملت التعمية كلاً من: الفني الذي قام بعملية التزقيم الفموي؛ وأخصائي الأمراض الذي قام بتقييم النسيج الشبكي؛ والمحلل الذي قام بقياس نطاقات تحليل لطخة ويسترن (WB).
حساب حجم العينة
تم تحديد حجم العينة بناءً على تجربة أولية لتقييم تعداد خلايا العقد الشبكية (RGC) تحت نفس الظروف التجريبية. وبافتراض مستوى دلالة ثنائي الجانب (α) قدره 0.05 وقوة إحصائية (1-β) تبلغ 0.80، تطلب الأمر وجود 5 فئران كحد أدنى في كل مجموعة للكشف عن فرق ذو صلة سريرياً في تعداد خلايا RGC بين مجموعتي النموذج والتدخل. ونظراً لمعدل تسرب محتمل يقدر بنحو 20%، تم تحديد كل مجموعة لتشمل 6 فئران.
تجهيز الحيوانات المصابة بمرض السكري
تلقّت المجموعة الضابطة نظاماً غذائياً قياسياً، بينما أُعطيت مجموعتا التدخل والنموذج نظاماً غذائياً عالي الدهون والسكريات (HFHSD) لمدة أربعة أسابيع. وعقب هذه الفترة الغذائية، خضعت مجموعتا التدخل والنموذج لحقن داخل الصفاق بمحلول Streptozotocin (STZ) بتركيز 1% وبجرعة 35 mg/kg17,18,19,20. وبعد مرور اثنتين وسبعين ساعة على الحقن، اعتبرت الفئران التي أظهرت مستويات غلوكوز في الدم (في حالة عدم الصيام) تتجاوز 16.7 mmol/L قد نجحت في تحريض نموذج مرض السكري (DM) وتم اختيارها لإجراء المزيد من التجارب. واستمرت حيوانات نموذج DM في تناول النظام الغذائي عالي الدهون والسكريات لمدة أربعة أشهر إضافية، بينما حافظت المجموعة الضابطة على نظامها الغذائي القياسي.
التحقق التصنيفي وتقييم الجودة
تم التحقق تصنيفيًا من المكونات الثمانية في QMG باستخدام أداة البحث المحدثة عن أسماء النباتات (MPNS, http://mpns.kew.org/mpns-portal/). كما تم تقييم جودة الإبلاغ عن التركيبة لـ QMG باستخدام أداة ConPhYMP.
طرق الإعطاء
في مجموعة التدخل، أُعطيت الحيوانات عقار QMG عن طريق الفم. تم شراء QMG من شركة Zhejiang Sansheng Mandi Pharmaceutical Co., Ltd. (رقم اعتماد الدواء الوطني الصيني Z20090036). وحُضِّر معلق QMG عن طريق خلط QMG بشكل متجانس مع الماء المقطر. تم إعطاء الفئران في مجموعة التدخل المعلق عن طريق التغذية القسرية الفموية بحجم مكافئ للمجموعات النموذجية والضابطة. وقد حُسبت الجرعة بناءً على الجرعة العلاجية الفردية السريرية البالغة 4.5 جم لكل 60 كجم من البالغين (الجرعة القياسية لوحدة التركيبة المسوقة) باستخدام طريقة تسوية مساحة سطح الجسم (BSA) الموصى بها من قبل إدارة الغذاء والدواء (FDA) وريغان-شو (Reagan-Shaw).21كان معامل التحويل بين البشر البالغين (Km = 37) والفئران (Km = 3) هو 12.33، مما أدى إلى تحديد جرعة للفئران قدرها 0.9 جم/كجم من وزن الجسم. وتلقت مجموعة النموذج والمجموعة الفارغة حجماً مكافئاً من المحلول الملحـي عن طريق التغذية القسرية الفموية. وقد أجري الإعطاء يومياً بين الساعة 9 صباحاً و11 صباحاً لمدة 3 أشهر متواصلة.
مؤشرات الملاحظة والاختبار
المراقبة العامة للعلامات الحيوية
تَمَّت مراقبة وتسجيل العلامات الحيوية العامة والمؤشرات الفسيولوجية بشكل منهجي، بما في ذلك وزن الجسم، ومستويات جلوكوز الدم، واستهلاك الماء والغذاء، وإخراج البول، ومستويات النشاط والسلوك، ودرجة حرارة الجسم، بالإضافة إلى حالة الفراء والجلد، وذلك لتقييم التدخلات العلاجية بشكل شامل والكشف عن المضاعفات المحتملة.
مراقبة التغيرات المورفولوجية في الشبكية عن طريق تحليل صبغة HE
تمت معالجة جميع العينات عبر جهاز تجفيف آلي باستخدام سلسلة من محاليل الإيثانول والزايلين بعد التثبيت، تلا ذلك الطمر في البارافين. لاحقاً، تم قطع مقاطع بارافينية بسمك 4 µm وصبغها بـ HE ثم تثبيتها باستخدام الصمغ المتعادل. تم مسح صور الشبكية باستخدام ماسح 3DHISTECH Pannoramic SCAN. وأجري تحليل الصور وقياس البيانات بواسطة برنامج Image-Pro Plus.
كشف مستويات IL-6 وTNF-α وIL-1β في المصل عن طريق تحليل ELISA
تم جمع عينات الدم عن طريق استئصال العين من خلف المحجر. وفُصل المصل عن طريق الطرد المركزي عند 1,000 × g لمدة 15 دقيقة عند 4 °C، ثم خُزن في درجة حرارة -80 °C حتى وقت التحليل. وقِيست مستويات مصل IL‑1β وIL‑6 وTNF‑α وفقاً للإجراءات القياسية، بما في ذلك موازنة الكواشف، وإضافة العينات، والحضن، والغسيل، وإضافة المتقارن والركيزة، وإيقاف التفاعل، وقياس الكثافة الضوئية، وحساب التركيز بناءً على منحنى قياسي. وقُرئت الكثافة الضوئية عند 450 nm باستخدام قارئ الأطباق الدقيقة، وحُسبت تركيزات السيتوكينات مقابل المنحنيات القياسية.
الكشف عن البروتينات التنظيمية الرئيسية في الشبكية والقولون عن طريق تحليل WB
أُجريت ثلاث مكررات بيولوجية مستقلة على غشاء واحد، وفُحصت بالتتابع للكشف عن البروتينات المستهدفة. وقد اشتُققت جميع المكررات من مجموعة واحدة من الحيوانات التي تم التضحية بها في وقت واحد. وعندما كان الوزن الجزيئي للبروتين المستهدف قريبًا جدًا من الوزن الجزيئي لبروتين GAPDH (<(فرق قدره 5 كيلو دالتون)، فقد تم تحليلها على أغشية منفصلة لمنع تداخل الإشارات. وقد فُحص كل غشاء حصرياً إما للبروتين المستهدف أو لبروتين GAPDH لضمان دقة التحديد الكمي. استُخدمت الأجسام المضادة الأولية التالية: GAPDH متعدد النسائل جسم مضاد (1:5000)، وجسم مضاد متعدد النسائل لـ CMKLR1 (1:1000)، وجسم مضاد متعدد النسائل لـ Wnt5a (1:1000)، وجسم مضاد متعدد النسائل لـ TP53 (1:1000)، وجسم مضاد أحادي النسيلة لـ AP-1 (1:5000)، وPPAR gamma (PPAR-γجسم مضاد متعدد النسائل (1:1000). تم الحصول على البروتينات الكلية عن طريق تحلل الخلايا متبوعاً بالطرد المركزي. وتم تحديد تركيزات البروتين باستخدام مقايسة حمض البيكولينيك (BCA). تم فصل البروتينات المستخلصة بواسطة الفصل الكهربائي للهلام بتركيز مادة SDS (SDS-PAGE) باستخدام هلام فصل بنسبة 12%، ثم نُقلت لاحقاً إلى أغشية. حُجبت الأغشية في محلول TBST يحتوي على 5% من الحليب الخالي من الدسم، وحُضنت مع الأجسام المضادة الأولية المناسبة طوال الليل في درجة حرارة 4 °Cبعد الغسل، حُضنت الأغشية مع أجسام مضادة ثانوية مضادة للأرانب أو مضادة للفئران مقترنة بإنزيم بيروكسيداز الفجل (HRP) بتخفيف 1:10,000. وفي الختام، تم تصوير حزم البروتين وتحليلها عن طريق التصوير بالتلألؤ الكيميائي. وأثناء التصوير ومعالجة البيانات، تم قص لطخات البروتين أفقيًا لإزالة مناطق الوزن الجزيئي غير ذات الصلة، مع الاحتفاظ بجميع مسارات العينات دون إزالة المناطق الفاصلة بين المسارات. وقد يحدث تشويه طفيف في الحواف أثناء عملية القص لإزالة مناطق الهلام غير ذات الصلة.
كشف ميكروبيوم الأمعاء عن طريق تحليل تسلسل 16S rDNA
جُمعت عينات براز حديثة من كل فأر قبل الإجراءات النهائية. وُضع كل فأر على حدة في أقفاص معقمة لمدة 10–15 min للسماح بالتبرز التلقائي. جُمعت كرات البراز فوراً باستخدام ملقط معقم، ونُقلت إلى أنابيب معقمة سعة 1.5 mL، ثم جُمدت سريعاً في نيتروجين سائل، وحُفظت في درجة حرارة -80 °C حتى استخلاص DNA. نُفذت جميع الإجراءات تحت ظروف معقمة لتقليل التلوث الخلطي. كما تم الحفاظ على الفاصل الزمني بين التبرز والتجميد في غضون 10 min لضمان سلامة الميكروبات. نُقيت عينات DNA الجينومي (gDNA) البرازية باستخدام طقم استخلاص Fecal gDNA، وتلى ذلك تضخيم جين 16S rDNA كامل الطول عبر تفاعل البوليميراز المتسلسل (PCR) باستخدام البادئات العامة 8F (5’-AGAGTTTGATCATGGCTCAG-3’) و 1492R (5’-CGGTTACCTTGTTACGACTT-3’). حُللت نواتج PCR لاحقاً عن طريق الفصل الكهربائي لهلام الأغاروز، ثم نُقيت وقُدرت كميتها للتطبيقات اللاحقة. أُجري التسلسل عالي الإنتاجية باستخدام جهاز التسلسل Nanopore GridION. وشملت عملية تحليل البيانات استدعاء القواعد (basecalling)، ومراقبة جودة البيانات، وتصنيف الأنواع، وبناء الشجرة التطورية، وتحليل المجتمع الميكروبي، وتحليل تنوع ألفا وبيتا، وتحليل الأنواع ذات الوفرة المتباينة والتنبؤ بوظيفة المجتمع. واستُخدمت أدوات وقواعد بيانات متنوعة خلال التحليل، مثل NanoFilt، وUsearch، ولغة البرمجة R، وPython، وقاعدة بيانات SILVA.
تحليل الارتباط بين محور الأمعاء والشبكية والالتهاب الجهازي وميكروبيوتا الأمعاء متعددة المستويات
لاستكشاف الارتباطات المحتملة بين الميكروبات المعوية متعددة المستويات والسايتوكينات الالتهابية في المصل والبروتينات التنظيمية الرئيسية، تم إجراء تحليل الارتباط باستخدام منصة Luoning Bio-Cloud. في البداية، تم استخراج بيانات وفرة الأنواع على مستويات المملكة، والشعبة، والطائفة، والرتبة، والفصيلة، والجنس، والنوع من نتائج التسلسل. كما جُمعت العوامل الفيزيوكيميائية، بما في ذلك السايتوكينات الالتهابية في المصل ومستويات تعبير البروتين، في ملف العوامل البيئية. ولضمان موثوقية الارتباطات وتصورها، خضعت البيانات لعملية تطبيع (normalization) لإزالة الاختلافات في المقاييس بين الوفرة الميكروبية ووحدات القياس السريرية. وتم حساب معاملات الارتباط (R-values) ومستويات الدلالة المقابلة لها (P-values). عُرضت النتائج باستخدام خريطة حرارية للارتباط، حيث تشير تدرجات الألوان إلى قوة واتجاه الارتباط (يمثل اللون الأحمر ارتباطاً إيجابياً، واللون الأزرق ارتباطاً سلبياً)، وتشير النجمات (**) إلى الدلالة الإحصائية (P < 0.01).
الطرق الإحصائية
أُجريت جميع التحليلات الإحصائية والتصوير البياني باستخدام برنامج GraphPad Prism. واستُخدم اختبار t لمقارنة المتوسطات للبيانات التي اتبعت التوزيع الطبيعي. وفي الحالات التي انحرفت فيها البيانات عن التوزيع الطبيعي، استُخدم اختبار Kruskal-Wallis. كما أُجري تحليل ارتباط Spearman أو Pearson لدراسة العلاقات بين المتغيرات. وقد أُجريت جميع الاختبارات الإحصائية كاختبارات ثنائية الذيل، مع تحديد مستوى الدلالة الإحصائية عند 0.05.
النتائج
General situation of experimental animals
Blood glucose levels were significantly elevated in the model group (27.21 ± 6.03 mmol/L) compared with the blank group (P < 0.001), indicating the successful induction of the DM model. During the study period, the experimental animals showed stable body weight, continuous water and food intake, normal urine output, body temperature, healthy fur and skin condition, and normal behavior during the experiment.
Composition and validation of QMG
QMG, a proprietary Chinese medicine that passed Phase III clinical trials, encompasses Astragalus membranaceus (Fisch.) Bunge [Fabaceae, Astragali radix], Pueraria lobata (Willd.) Ohwi [Fabaceae, Puerariae lobatae radix], Rehmannia glutinosa (Gaertn.) Libosch. Ex Fisch. & C.A. Mey. [Orobanchaceae; Rehmanniae radix], Lycium barbarum L. [Solanaceae; Lycii fructus], Senna obtusifolia (L.) H.S. Irwin & Barneby [Fabaceae; Cassiae semen], Leonurus japonicus Houtt. [Lamiaceae, Leonuri herba], Typha angustifolia L. [Typhaceae; Typhae pollen], Whitmania pigra Whitman [Hirudinidae; Hirudo]15. The detailed information, including the Chinese name, scientific name by MPNS validation, species, family, part used, representative bioactive compounds, was summarized in Table 1, which defined the QMG and provided a transparent, scientifically grounded basis for the formulas under investigation.
| No. | Chinese name | Scientific name by MPNS validation | Species | Family | Part Used | Representative bioactive compounds | |||||||
| 1 | HuangQi | Astragalus membranaceus (Fisch.) Bunge [Fabaceae, Astragali radix] | Astragalus mongholicus (Fisch.) Bunge | Fabaceae | Radix | Astragaloside IV, Calycosin | |||||||
| 2 | GeGen | Pueraria lobata (Willd.) Ohwi [Fabaceae, Puerariae lobatae radix] | Pueraria lobata (Willd.) | Fabaceae | Radix | Puerarin, Daidzin | |||||||
| 3 | DiHuang | Rehmannia glutinosa (Gaertn.) Libosch. Ex Fisch. & C.A. Mey. [Orobanchaceae; Rehmanniae radix] | Rehmannia glutinosa (Gaertn.) Libosch. Ex Fisch. & C.A. Mey. | Orobanchaceae | Radix | Catalpol, Rehmannioside D | |||||||
| 4 | GouQiZi | Lycium barbarum L. [Solanaceae; Lycii fructus] | Lycium barbarum L. | Solanaceae | Fructus | Lycium barbarum polysaccharides, Betaine | |||||||
| 5 | JueMingZi | Senna obtusifolia (L.) H.S. Irwin & Barneby [Fabaceae; Cassiae semen] | Senna obtusifolia (L.) H.S. Irwin & Barneby | Fabaceae | Semen | Aurantio-obtusin, Emodin | |||||||
| 6 | Chong WeiZi | Leonurus japonicus Houtt. [Lamiaceae, Leonuri fructus] | Leonurus japonicus Houtt. | Lamiaceae | Fructus | Stachydrine, Leonurine | |||||||
| 7 | PuHuang | Typha angustifolia L. [Typhaceae; Typhae pollen] | Typha angustifolia L. | Typhaceae | Pollen | Isorhamnetin, Kaempferol | |||||||
| 8 | ShuiZhi | Whitmania pigra Whitman [Hirudinidae; Hirudo] | Whitmania pigra Whitman | Hirudinidae | Body | Hirudin, Calin | |||||||
Table 1: The composition and quality information of QMG ingredients. Detailed information on the composition and quality information of QMG ingredients, including the Chinese name, scientific name by MPNS validation, species, family, part used, and representative bioactive compounds.
QMG ameliorates the retinal morphology
As depicted in Figure 2A, the retina of the blank group exhibited a well-organized structure. The cellular arrangement was dense and orderly across all layers, with no evidence of structural disruption, exudation, or inflammatory infiltration. Compared with the blank group, retinal sections from the model group (Figure 2B) exhibited marked structural disorganization, characterized by disordered cellular arrangement, a significant reduction in RGC counts (P < 0.0001, Table 2, Figure 3A), and pronounced thinning of the total retinal thickness (P < 0.0001, Figure 3B). Notably, neovascular tufts penetrating the inner limiting membrane were observed (indicated by a red arrow), confirming successful establishment of the DR model. In contrast, the intervention group (Figure 2C) demonstrated significant attenuation of histopathological abnormalities relative to the model group, as evidenced by restoration of retinal laminar architecture, partial recovery of RGC numbers (P < 0.001, Table 2, Figure 3A), and reversal of retinal thinning (P < 0.01, Table 2, Figure 3B). These data provide strong evidence for QMG as an effective intervention for DR.
QMG attenuates systemic inflammatory response in DR
Compared with the blank group, the expression levels of IL-1β, IL-6, and TNF-α were significantly upregulated in the model group (P < 0.0001), confirming that the modeling procedure successfully induced a marked inflammatory response. Conversely, compared with the model group, the expression levels of IL-1β, IL-6, and TNF-α were significantly downregulated in the intervention group (p < 0.0001), indicating a potent inhibitory effect of QMG on systemic inflammation. The serum concentrations of IL-1β, IL-6, and TNF-α across the three groups are summarized in Table 3 and illustrated in Figure 4A–C.
QMG modulates the CMKLR1-centered regulatory network along the gut–retina axis
As shown in Figure 5, Figure 6, Figure 7, and Supplementary Figure 2, the results of this study showed that in DR model mice, the expression levels of five key regulatory proteins—AP-1, Wnt5a, CMKLR1, TP53, and PPAR-γ—exhibited a consistent downward trend in both colonic and retinal tissues. Following QMG intervention, the expression of these proteins showed varying degrees of recovery, with some proteins reaching statistical significance. Specifically, after QMG intervention, the expression of AP-1, Wnt5a, and CMKLR1 in colonic tissue was significantly higher than that in the model group (P < 0.05), while in retinal tissue, the expression of CMKLR1 and TP53 was significantly higher than that in the model group (P < 0.01). These findings may suggest that AP-1 and Wnt5a are more sensitive responders in the colon, whereas TP53, as an apoptosis regulator, plays a more critical role in retinal neuroprotection. Notably, CMKLR1 was the only protein that achieved significant recovery in both tissues, indicating that QMG may facilitate bidirectional communication along the gut–retina axis through systemic regulation of CMKLR1 expression.
The consistent directionality of expression changes for these five proteins in both colonic and retinal tissues holds important biological significance. As the primary habitat of the gut microbiota, changes in colonic protein expression reflect the state of the intestinal microenvironment, while the retina is the effector organ of DR. The consistency of expression patterns between these two tissues strongly supports the gut–retina axis as an important participant in the pathophysiological processes of DR.
QMG restores and improves the composition, diversity, and function of gut microbiota
The results of the community composition
Hierarchical clustering analysis revealed distinct shifts in gut microbial composition and clustering at multiple taxonomic levels following QMG intervention. At the phylum level (Figure 8A), the model group exhibited a marked reduction in Firmicutes abundance and a significant enrichment of Bacteroidetes compared with the blank group, indicating a diabetes-driven shift in the Firmicutes/Bacteroidetes ratio; notably, the intervention restored the proportions of both Firmicutes and Bacteroidetes to levels approaching those of the blank group, accompanied by an elevated relative abundance of Proteobacteria. At the class level (Figure 8B), the model group manifested an elevation in Bacteroidia and Clostridia and a lessening in Bacilli and Erysipelotrichia compared with the blank group; in contrast, the intervention group showed restoration in Bacteroidia and Erysipelotrichia to levels approaching those of the blank group, accompanied by elevated relative abundance of Clostridia and Alphaproteobacteria. At the order level (Figure 8C), the model group demonstrated an elevated proportion of Bacteroidales, and a decreased proportion of Erysipelotrichales and Lactobacillales compared with the blank group; conversely, the intervention group restored the proportions of Bacteroidales and Erysipelotrichales to levels approaching those of the blank group, accompanied by an elevated relative abundance of Clostridiales. At the family level (Figure 8D), the model group presented a growth in Odoribacteraceae, Peptostreptococcaceae, Rikenellaceae, and Tannerellaceae, and a decrease in Erysipelotrichaceae, Lactobacillaceae, Muribaculaceae, and Ruminococcaceae compared with the blank group; in contrast, the intervention group downregulated the proportions of Odoribacteraceae and Peptostreptococcaceae compared with the model group; restored the proportions of Erysipelotrichaceae and Ruminococcaceae to levels approaching those of the blank group, accompanied by an elevated relative abundance of Lachnospiraceae. At the genus level (Figure 8E), the model group exhibited an upward trend in Odoribacter, Paeniclostridium, Alistipes, Parabacteroides, and Clostridioides, and a decrease trend in Lactobacillus, Faecalibaculum, Ruminococcus, Bacteroides, and Muribaculum compared with the blank group; notably, the intervention group downregulated the proportions of Odoribacter, Clostridioides, and Paeniclostridium compared with the model group; restored the proportions of Faecalibaculum and Ruminococcus to levels approaching those of the blank group; and increased the relative abundance of Lachnoclostridium, Sphingomonas, Flavonifractor, and Blautia. At the species level (Figure 8F), the model group showed an increase in Odoribacter splanchnicus, Clostridioides difficile, and Paeniclostridium sordellii, and a decrease in Faecalibaculum rodentium, Bacteroides salanitronis, Muribaculum intestinale compared with the blank group; in contrast, the intervention group downregulated the proportion of Odoribacter splanchnicus and Clostridioides difficile compared with the model group; restored the proportions of Faecalibaculum rodentium, and Muribaculum intestinale, accompanied by elevated relative abundance of Lachnoclostridium phocaeense, and Flavonifractor plautii. Collectively, these findings indicate that QMG restored gut microbial composition across multiple taxonomic levels, shifting the community structure toward a homeostatic state.
The results of the Alpha diversity and Beta diversity
As indicated by the Alpha diversity results (Figure 9A), the intervention group exhibited the highest Chao1, PD, Simpson, and Shannon indices, while the model group displayed the lowest, with the blank group showing intermediate levels. These findings underscore the detrimental impact of DR on gut microbiota diversity and demonstrate that QMG intervention effectively restores and enhances microbial richness and evenness in DR mice.
As indicated by the Beta diversity representative results (Figure 9B,C), the principal coordinates analysis (PCoA) plots revealed a distinct separation of microbial communities across the three groups, which was statistically supported by the Permutational Multivariate Analysis of Variance (PERMANOVA). Specifically, the Bray-Curtis-based analysis indicated a significant structural divergence (PERMANOVA: R2 = 0.67, P < 0.001), suggesting that the DR model and QMG intervention accounted for a substantial proportion of the variation in microbial community composition. Consistent with this, the analysis based on Weighted unique fraction (UniFrac) distance, which incorporates phylogenetic relationships between taxa, further confirmed the significant community shift (PERMANOVA: R2 = 0.58, P < 0.01).
As displayed by the Beta diversity results (Figure 9D), the non-metric multidimensional scaling (NMDS) ordination plot demonstrated a clear spatial clustering of samples according to the respective groups, with a stress value of 0.04. Given that a stress value below 0.05 is generally considered to represent an excellent representation of the community structure in a reduced-dimensional space, these results collectively suggest that the QMG intervention significantly altered the global composition of the gut microbiota.
The results of the differential abundance analysis
According to the linear discriminant analysis effect size (LEfSe) analysis (Figure 9E), the results revealed that Clostridia, Clostridiales, Lachnospiraceae, and Lachnoclostridium were remarkably enriched in the intervention group, whereas Odoribacteraceae, Odoribacter, Peptostreptococcaceae, and Paeniclostridium were notably enriched in the model group. Therefore, the above gut microbiota might be the primary differential microbiota responsible for the intergroup differences between the model and intervention groups.
The results of community function prediction
The predicted functional profiles at Level 2 and Level 3 showed distinct clustering patterns across the three groups (Figure 9F,G). Specifically, compared with the blank group, the model group exhibited a significant deviation in the relative abundance of metabolic pathways. Notably, this functional perturbation in the model group was largely ameliorated in the intervention group. The functional composition of the intervention group showed a substantial shift back towards the profile observed in the blank group, indicating that the QMG intervention effectively modulated the gut microbial functional structure. These results suggest that the intervention not only reshaped the taxonomic composition and structure of the gut microbiota but also restored its functional metabolic capacity toward a homeostatic state.
QMG modulates the gut–retina axis by coupling systemic inflammation and key regulatory proteins
Associations at global levels
At the kingdom level (Figure 10A–C), QMG improved the CMKLR1-centered network mainly by modulating Bacteria along the gut-retina axis. Specifically, Bacteria positively correlated with retinal PPAR-γ in the blank group (P < 0.01), but this association was not observed in the model group. Following QMG intervention, bacterial abundance positively correlated with retinal CMKLR1 and Wnt5a yet negatively correlated with colonic TP53 and PPAR-γ (P < 0.01).
At the phylum level (Figure 10D–F), QMG improved the CMKLR1-centered network mainly by modulating Candidatus and Bacteroidetes along the gut-retina axis. Specifically, the positive correlation between Candidatus and colonic CMKLR1 observed in the blank group was lost following DR induction, but was restored by QMG intervention, which was accompanied by a negative correlation with serum IL-1β and TNF-α, while positively correlated with retinal PPAR-γ, AP-1, TP53, colonic AP-1, and serum IL-6 (P < 0.01). Proteobacteria in the model group negatively correlated with colonic CMKLR1 (P < 0.01), a trend that persisted following QMG intervention. Meanwhile, Firmicutes were positively correlated with retinal CMKLR1 in the model group, whereas Bacteroidetes and Tenericutes were negatively correlated with retinal CMKLR1 (P < 0.01). Following QMG intervention, Bacteroidetes shifted to positive correlations with retinal PPAR-γ, AP-1, TP53, and colonic CMKLR1 (P < 0.01). Additionally, Actinobacteria positively correlated with retinal CMKLR1 and Wnt5a (P < 0.01).
At the class level (Figure 10G–I), QMG improved the CMKLR1-centered network mainly by regulating Cytophagia and Bacteroidia along the gut-retina axis. Specifically, Cytophagia and Chitinophagia negatively correlated with retinal CMKLR1 in the blank group (P < 0.01). In the model group, Cytophagia, Bacteroidia, and Mollicutes negatively correlated with retinal CMKLR1, while colonic CMKLR1 positively correlated with Flavobacteriia and Epsilonproteobacteria, yet negatively with Tissierellia, Alphaproteobacteria, Clostridia, and Bacilli (P < 0.01). Following QMG intervention, Bacteroidia and Cytophagia positively correlated with colonic CMKLR1, retinal PPAR-γ, AP-1, TP53, colonic AP-1 and serum IL-6, whereas Mollicutes, Deltaproteobacteria, Alphaproteobacteria, and Gammaproteobacteria showed the opposite pattern (P < 0.01). Moreover, Chlamydiia, Actinobacteria, Tissierellia, Bacilli, and Negativicute negatively correlated with retinal CMKLR1 and Wnt5a, while Coriobacteriia exhibited the reverse correlation (P < 0.01).
At the order level (Figure 10J–L), QMG improved the CMKLR1-centered network mainly by modulating Bacteroidales, Bacillales, and Clostridiales along the gut–retina axis. Specifically, Cytophagales and Chitinophagales negatively correlated with retinal CMKLR1, whereas Marinilabiliales positively correlated with colonic CMKLR1 in the blank group (P < 0.01). In the model group, Mycoplasmatales, Cytophagales, Bacteroidales, and Marinilabiliales negatively correlated with retinal CMKLR1, while colonic CMKLR1 positively correlated with Flavobacteriales and Campylobacterales, yet negatively with Tissierellales, Bacillales, Sphingomonadales, Clostridiales, and Lactobacillales (P < 0.01). Following QMG intervention, Bacteroidales and Clostridiales positively correlated with colonic CMKLR1, AP-1, retinal PPAR-γ, AP-1, TP53, and serum IL-6, whereas Desulfovibrionales, Rhizobiales, Sphingomonadales, and Enterobacterales showed the opposite pattern (P < 0.01). Moreover, Eggerthellales and Coriobacteriales positively correlated with retinal CMKLR1 and Wnt5a, yet negatively with colonic TP53 and PPAR-γ, whereas Chlamydiales, Thermoanaerobacterales, Corynebacteriales, Tissierellales, and Bacillales exhibited the reverse correlation (P < 0.01).
Associations at Fine levels
At the family level (Figure 11A–C), QMG improved the CMKLR1-centered network primarily by modulating Lachnospiraceae, Bacteroidaceae, and Lactobacillaceae along the gut–retina axis. Specifically, Ruminococcaceae negatively correlated with retinal CMKLR1, whereas Lachnospiraceae positively correlated with retinal CMKLR1 in the blank group (P < 0.01). In the model group, Peptostreptococcaceae positively correlated with retinal CMKLR1, while Tannerellaceae, Bacteroidaceae, Odoribacteraceae, and Lachnospiraceae showed the opposite pattern (P < 0.01). Meanwhile, colonic CMKLR1 positively correlated with Marinilabiliaceae, Rikenellaceae, and Flavobacteriaceae, yet negatively with Lachnospiraceae and Lactobacillaceae (P < 0.01). Following QMG intervention, Enterobacteriaceae, Sphingomonadaceae, and Oscillospiraceae negatively correlated with colonic CMKLR1, AP-1, and serum IL-6, as well as retinal PPAR-γ, AP-1, and TP53, while positively correlating with serum IL-1β and TNF-α, whereas Peptococcaceae, Bacteroidaceae, Muribaculaceae, and Rikenellaceae showed the opposite pattern (P < 0.01). Moreover, Veillonellaceae, Peptostreptococcaceae, Lactobacillaceae, and Ruminococcaceae negatively correlated with retinal CMKLR1 and Wnt5a, yet positively with colonic TP53 and PPAR-γ, whereas Eggerthellaceae, Lachnospiraceae, and Hungateiclostridiaceae exhibited the reverse correlation (P < 0.01).
At the genus level (Figure 11D–F), QMG improved the CMKLR1-centered network primarily by modulating Lachnoclostridium, Clostridioides, and Bacteroides along the gut–retina axis. Specifically, Ruminococcus negatively correlated with retinal CMKLR1, whereas Lachnoclostridium showed the opposite pattern in the blank group (P < 0.01). In the model group, Lactobacillus and Sphingomonas negatively correlated with colonic CMKLR1, while Alistipes and Croceibacter positively correlated with colonic CMKLR1 (P < 0.01). Meanwhile, retinal CMKLR1 positively correlated with Paeniclostridium and Clostridioides, yet negatively with Mucinivorans, Intestinimonas, Flavonifractor, Parabacteroides, Bacteroides, Odoribacter, and Lachnoclostridium (P < 0.01). Following QMG intervention, Sphingomonas and Oscillibacter negatively correlated with colonic CMKLR1, AP-1, and serum IL-6, as well as retinal PPAR-γ, AP-1, and TP53, while positively correlating with serum IL-1β and TNF-α, whereas Bacteroides, Muribaculum, and Alistipes showed the opposite pattern (P < 0.01). Moreover, Dialister, Flavonifractor, Clostridioides, Ruminococcus, and Paeniclostridium negatively correlated with retinal CMKLR1 and Wnt5a, yet positively with colonic TP53 and PPAR-γ, whereas Pseudoclostridium, Lachnoclostridium, and Blautia exhibited the reverse correlation (P < 0.01).
At the species level (Figure 11G–I), QMG improved the CMKLR1-centered network primarily by modulating Clostridioides difficile, Alistipes shahii, and Paeniclostridium sordellii along the gut–retina axis. Specifically, Ruminococcus bicirculans and endosymbiont 'TC1' of Trimyema compressum negatively correlated with retinal CMKLR1, whereas Lactobacillus fermentum and Lactobacillus helveticus displayed the opposite pattern in the blank group (P < 0.01). In the model group, Croceibacter atlanticus, Alkalitalea saponilacus, Alistipes finegoldii, and Alistipes shahii positively correlated with colonic CMKLR1, while Sphingomonas panacis, Paeniclostridium sordellii, Clostridioides difficile, and Lactobacillus murinus positively correlated with retinal CMKLR1, yet Odoribacter splanchnicus, Mucinivorans hirudinis, Lachnoclostridium phocaense, Flavonifractor plautii, and Intestinimonas butyriciproducens showed the opposite pattern (P < 0.01). Following QMG intervention, Alistipes shahii and Muribaculum intestinale positively correlated with colonic CMKLR1, AP-1, and serum IL-6, as well as retinal PPAR-γ, AP-1, and TP53, while negatively correlating with serum IL-1β and TNF-α, whereas Sphingomonas panacis, Oscillibacter sp. PEA192, and Oscillibacter valericigenes exhibited the reverse pattern (P < 0.01). Moreover, Pseudoclostridium thermosuccinogenes, Lachnoclostridium phocaense, Bacteroides salanitronis, and Blautia sp. N6H1-15 positively correlated with retinal CMKLR1 and Wnt5a, yet negatively with colonic TP53 and PPAR-γ, whereas Paeniclostridium sordellii, Flavonifractor plautii, endosymbiont 'TC1' of Trimyema compressum, Clostridioides difficile, and Dialister pneumosintes showed the reverse correlation (P < 0.01). The detailed correlation results at kingdom, phylum, class, order, family, genus, and species levels are presented in Supplementary File 1.
DATA AVAILABILITY:
The 16S rDNA sequencing datasets generated and analyzed during the current study are available in the National Center for Biotechnology Information (NCBI) Sequence Read Archive (SRA) repository under the BioProject accession number: PRJNA1281561. All other data generated or analyzed during this study are included in this article.
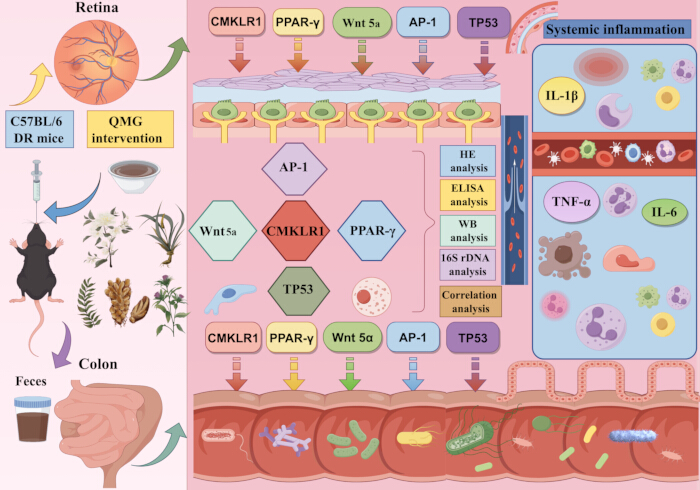
Figure 1: Graphical abstract. The graphical abstract shows the process of this study. Please click here to view a larger version of this figure.
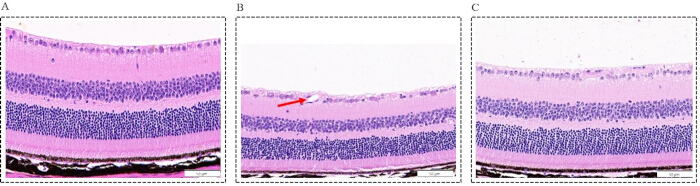
Figure 2: Morphological changes in the retina across the three groups (Scale bar = 50 µm, Magnification: ×400). (A) Blank group: representative photomicrographs of hematoxylin-eosin (HE)-stained retinal sections, showing an intact, well-organized retinal architecture with neatly arranged cellular layers; (B) Model group: representative photomicrographs of HE-stained retinal sections, showing marked structural disorganization, characterized by disordered cellular arrangement, a significant reduction in retinal ganglion cell (RGC) counts (P < 0.0001), pronounced thinning of the retinal thickness (P < 0.0001), and neovascular tufts penetrating the inner limiting membrane (indicated by a red arrow); (C) Intervention group: representative photomicrographs of HE-stained retinal sections, showing significant attenuation of histopathological abnormalities relative to the model group, as evidenced by restoration of retinal laminar architecture, partial recovery of RGC numbers (P < 0.001), and restoration of retinal thinning (P < 0.01). Please click here to view a larger version of this figure.
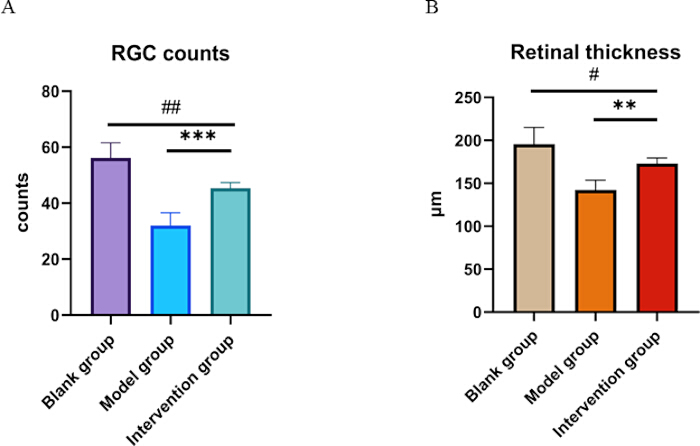
Figure 3: Histological quantification of RGC counts and retinal thickness. (A) Quantification of RGC counts in the ganglion cell layer. (B) Measurement of total retinal thickness (µm). Data are shown as mean ± SD (n = 6 per group). Compared with the blank group: #P <0.05, ##P <0.01; compared with the model group: **P <0.01, ***P <0.001. Please click here to view a larger version of this figure.
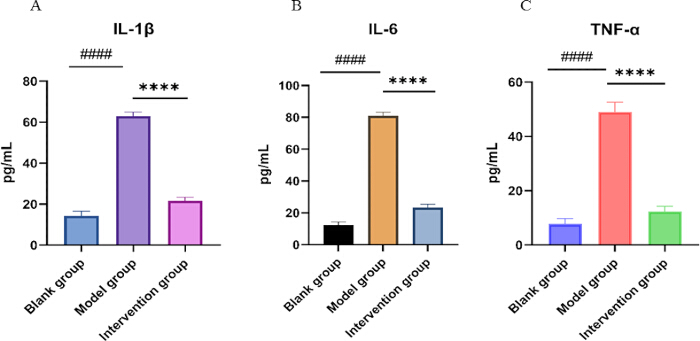
Figure 4: Serum concentrations of inflammatory cytokines in the three groups. Bar charts showing ELISA‑based quantification of serum IL‑1β (A), IL‑6 (B), and TNF‑α (C) levels in the blank control, model group, and intervention groups. Data are expressed as mean ± SD (n = 6 per group). Compared with the blank group: ####P < 0.0001; compared with the model group: ****P < 0.0001. Please click here to view a larger version of this figure.
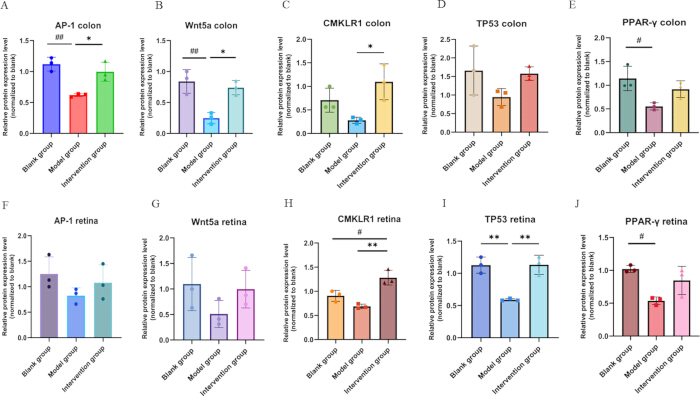
Figure 5: Bar chart of the expression levels of key regulatory proteins in the retina and colon. (A) Relative protein expression level (normalized to blank) of AP-1 in the colon (n = 3); (B) Relative protein expression level (normalized to blank) of Wnt5a in the colon (n = 3); (C) Relative protein expression level (normalized to blank) of CMKLR1 in the colon (n = 3); (D) Relative protein expression level (normalized to blank) of TP53 in the colon (n = 3); (E) Relative protein expression level (normalized to blank) of PPAR-γ in the colon (n = 3); (F) Relative protein expression level (normalized to blank) of AP-1 in the retina (n = 3); (G) Relative protein expression level (normalized to blank) of Wnt5a in the retina (n = 3); (H) Relative protein expression level (normalized to blank) of CMKLR1 in the retina (n = 3); (I) Relative protein expression level (normalized to blank) of TP53 in the retina (n = 3); (J) Relative protein expression level (normalized to blank) of PPAR-γ in the retina (n = 3). Compared with the blank group: #P < 0.05, ##P < 0.01; compared with the model group: *P < 0.05, **P < 0.01. Please click here to view a larger version of this figure.
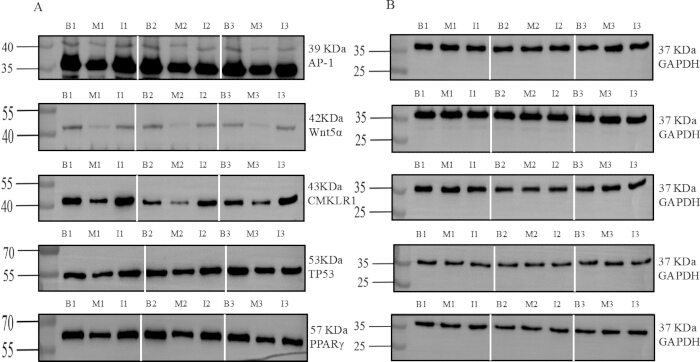
Figure 6: Representative WB grayscale blots of key regulatory proteins in the colon. (A) Target protein expression: AP-1, Wnt5a, CMKLR1, TP53, and PPAR-γ; (B) Loading control: GAPDH. Vertical white lines separate replicate sets (Rep1, Rep2, Rep3); Molecular weight markers (kDa) are indicated on the left, and protein names with corresponding kDa are shown on the right. Lanes are labeled as: B1 (Blank group 1), M1 (Model group 1), I1 (Intervention group 1); B2 (Blank group 2), M2 (Model group 2), I2 (Intervention group 2); B3 (Blank group 3), M3 (Model group 3), I3 (Intervention group 3). Full-length, uncropped Western blot (WB) images with visible molecular weight markers have been provided as Supplementary Figure 2. Please click here to view a larger version of this figure.
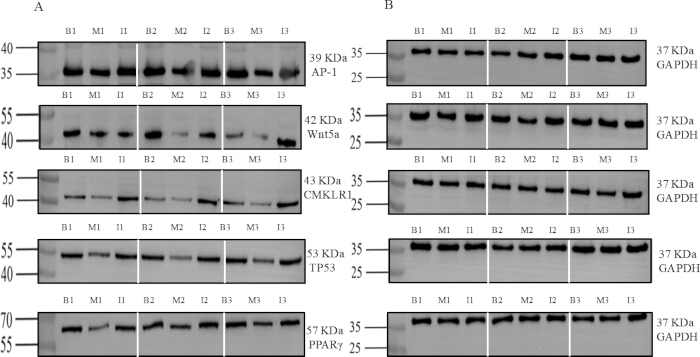
Figure 7: Representative WB grayscale blots of key regulatory proteins in the retina. (A) Target protein expression: AP-1, Wnt5a, CMKLR1, TP53, and PPAR-γ; (B) Loading control: GAPDH. Vertical white lines separate replicate sets (Rep1, Rep2, Rep3); Molecular weight markers (kDa) are indicated on the left, and protein names with corresponding kDa are shown on the right. Lanes are labeled as: B1 (Blank group 1), M1 (Model group 1), I1 (Intervention group 1); B2 (Blank group 2), M2 (Model group 2), I2 (Intervention group 2); B3 (Blank group 3), M3 (Model group 3), I3 (Intervention group 3). Full-length, uncropped WB images with visible molecular weight markers have been provided as Supplementary Figure 2. Please click here to view a larger version of this figure.
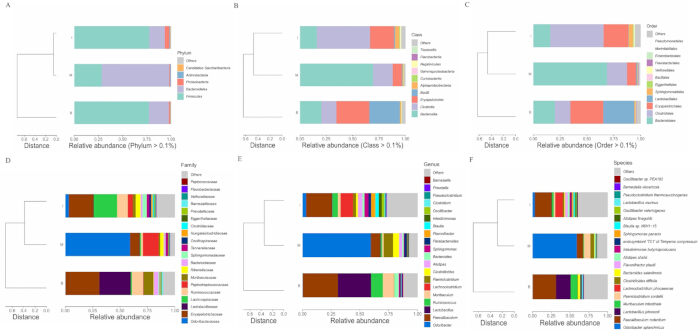
Figure 8: Hierarchical clustering of gut microbiota composition at different levels. Hierarchical clustering dendrogram based on Bray-Curtis dissimilarity among the blank control (B), model group(M), and intervention group (I). The branch length represents the degree of structural divergence. Stacked bar chart depicting the relative abundances of dominant phyla across the three groups. Phyla falling below the threshold are aggregated as “Others”. (A) Qiming granule (QMG) rebalances the gut microbiota composition at the phylum level; (B) QMG rebalances the gut microbiota composition at the class level; (C) QMG rebalances the gut microbiota composition at the order level; (D) QMG rebalances the gut microbiota composition at the family level; (E) QMG rebalances the gut microbiota composition at the genus level; (F) QMG rebalances the gut microbiota composition at the species level. Abbreviation: B, blank group; M, model group; I, intervention group. Please click here to view a larger version of this figure.
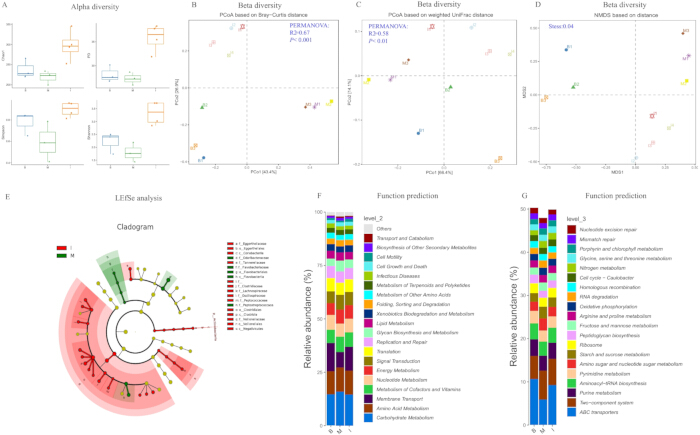
Figure 9: Analysis of gut microbiota diversity, differential abundance, and predicted functional pathways. (A) Alpha diversity analysis assessed by Chao1, PD, Simpson, and Shannon indices revealed that the intervention group exhibited higher microbial diversity than the model group, indicating that QMG treatment effectively restores gut microbial richness and evenness. (B) Beta diversity analysis assessed by principal coordinates analysis (PCoA) based on Bray-Curtis distance revealed significant differences among groups (PERMANOVA: R2=0.67, P < 0.001), indicating that the DR model and QMG intervention accounted for a substantial proportion of the variation in microbial community composition. (C) Beta diversity analysis assessed by PCoA based on weighted unique fraction (UniFrac) distance further confirmed the significant community shift (PERMANOVA: R2= 0.58, P < 0.01). (D) Beta diversity analysis assessed by non-metric multidimensional scaling (NMDS) ordination demonstrated a stress value of 0.04, suggesting that the QMG intervention significantly altered the global composition of the gut microbiota. (E) Cladogram of differential abundance analysis assessed by linear discriminant analysis effect size (LEfSe) revealed the primary differential microbiota between the model and intervention groups. Functional prediction of the gut microbiota at KEGG Level 2 (F) and KEGG Level 3 (G) suggested that the intervention not only reshaped the taxonomic composition and structure of the gut microbiota but also restored its functional metabolic capacity toward a homeostatic state. Please click here to view a larger version of this figure.
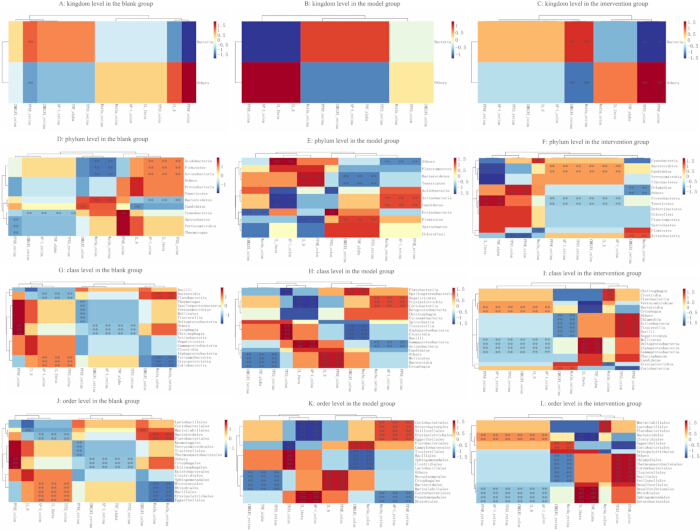
Figure 10: Global association of gut microbiota with inflammatory and regulatory factors. (A) Association of gut microbiota at kingdom level in the blank group; (B) Association of gut microbiota at kingdom level in the model group; (C) Association of gut microbiota at kingdom level in the intervention group; (D) Association of gut microbiota at phylum level in the blank group; (E) Association of gut microbiota at phylum level in the model group; (F) Association of gut microbiota at phylum level in the intervention group; (G) Association of gut microbiota at class level in the blank group; (H) Association of gut microbiota at class level in the model group; (I) Association of gut microbiota at class level in the intervention group; (J) Association of gut microbiota at order level in the blank group; (K) Association of gut microbiota at order level in the model group; (L) Association of gut microbiota at order level in the intervention group. Please click here to view a larger version of this figure.
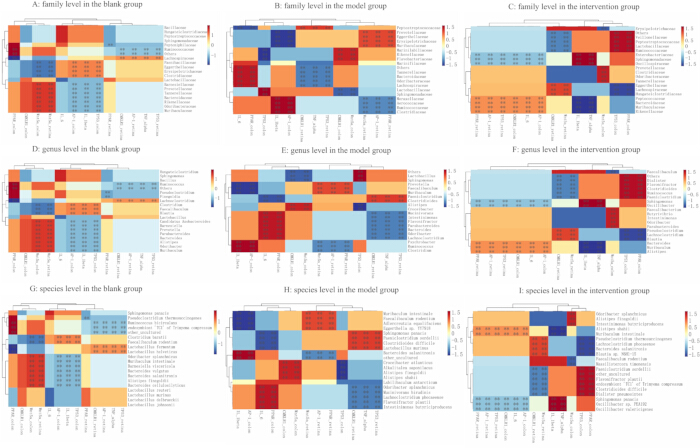
Figure 11: Fine association of gut microbiota with inflammatory and regulatory factors. (A) Association of gut microbiota at the family level in the blank group; (B) Association of gut microbiota at the family level in the model group. (C) Association of gut microbiota at family level in the intervention group; (D) Association of gut microbiota at genus level in the blank group; (E) Association of gut microbiota at genus level in the model group; (F) Association of gut microbiota at genus level in the intervention group; (G) Association of gut microbiota at species level in the blank group; (H) Association of gut microbiota at species level in the model group;(I) Association of gut microbiota at species level in the intervention group. Please click here to view a larger version of this figure.
| Groups (n = 6) | RGCs counts | Retinal thickness |
| Blank group | 56.17 ± 5.382 | 195.50 ± 19.54 μm |
| Model group | 32.00 ± 4.561#### | 142.30 ± 11.34 μm#### |
| Intervention group | 45.33 ± 2.066 ##*** | 173.00 ± 6.575 μm#** |
| p | <0.0001 | <0.0001 |
Table 2: Quantitative analysis of RGC counts and retinal thickness in the three experimental groups. Data are presented as Mean ± SD (n = 6 per group). Compared with the blank group: #P <0.05, ##P <0.01, ####P <0.0001; compared with the model group: **P <0.01, ***P <0.001.
| Groups (n = 6) | IL-1β | IL-6 | TNF-α |
| Blank group | 14.31 ± 2.28 | 12.48 ± 1.774 | 7.728 ± 2.048 |
| Model group | 62.88 ± 2.01#### | 80.95 ± 2.247#### | 49.00 ± 3.647#### |
| Intervention group | 21.7 ± 1.654**** | 23.27 ± 2.074**** | 12.35 ± 1.891**** |
| P | <0.0001 | <0.0001 | <0.0001 |
Table 3: Serum expression levels of IL-1β, IL-6, and TNF-α in the three experimental groups. Data are presented as Mean ± SD (n = 6 per group). Cytokine concentrations were determined by enzyme‑linked immunosorbent assay (ELISA) and are reported in pg/mL. Compared with the blank group: ####P < 0.0001; compared with the model group: ****P < 0.0001.
Supplementary Figure 1: Experimental Design and Study Timeline. Schematic overview of the experimental design.Please click here to download this file.
Supplementary Figure 2: Original, full-length, uncropped WB images corresponding to Figure 6 and Figure 7. Raw images without modification contain all molecular weight markers in colon and retina blots for AP-1, Wnt5a, TP53, CMKLR1, PPAR-γ, and loading control GAPDH. Molecular weight markers (kDa) are indicated. Lanes are labeled: B1 (Blank group 1), M1 (Model group 1), I1 (Intervention group 1); B2 (Blank group 2), M2(Model group 2), I2 (Intervention group 2); B3 (Blank group 3), M3 (Model group 3), I3 (Intervention group 3). The original blots were not subjected to high-contrast adjustments.Please click here to download this file.
Supplementary File 1: Detailed correlation analyses of gut microbiota with inflammatory and regulatory factors.Please click here to download this file.
المناقشة
يُعد اعتلال الشبكية السكري (DR) مضاعفة عصبية وعائية معقدة يحركها ارتفاع سكر الدم المزمن والالتهاب والخلل في التنظيم الأيضي22. وتصنف الأكاديمية الأمريكية لطب العيون اعتلال الشبكية السكري إلى اعتلال شبكية سكري غير تكاثري واعتلال شبكية سكري تكاثري، والذي يتميز ببدء تكوّن أوعية دموية جديدة23. ونظراً لمحدودية الاستراتيجيات العلاجية الحالية، برز استكشاف آليات جديدة كتوجه واعد لمعالجة اعتلال الشبكية السكري. ومن الجدير بالذكر أن الاختراقات الحديثة حددت محور الأمعاء-الشبكية كهدف علاجي حاسم، ولكنه غير مستغل بشكل كافٍ، لعلاج اعتلال الشبكية السكري. وقد اكتسب محور الأمعاء-الشبكية، الذي قدمه ووصفه شيلدون روان لأول مرة في عام 20176، شعبية في دراسة العمليات الفسيولوجية المرضية لأمراض العين. ومع ذلك، لا تزال الآليات الجزيئية المحددة التي تفسر دور محور الأمعاء-الشبكية في نشأة وتطور اعتلال الشبكية السكري غير واضحة، مما يعيق تطوير وتطبيق الاستراتيجيات العلاجية التي تستهدف هذا المحور سريرياً.
في هذه الدراسة، قمنا بتقييم فعالية QMG وآلياته الأساسية ضد اعتلال الشبكية السكري (DR) بشكل منهجي. وتوفر هذه النتائج أدلة أولية على أن QMG يخفف من التلف النسيجي المرضي للشبكية، ويثبط الالتهاب الجهازي، ويعيد التوازن إلى ميكروبيوم الأمعاء، وينظم ثنائي الاتجاه البروتينات التنظيمية الرئيسية (الشبكة التنظيمية التي تتمحور حول CMKLR1) في كل من القولون والشبكية، مما يثبت أن QMG يعد معدلاً محتملاً لمحور الأمعاء-الشبكية. ويعد الالتهاب الجهازي المزمن منخفض الدرجة سمة مميزة لمرض السكري (DM) ومحركاً رئيسياً لتلف الأوعية الدموية الدقيقة في الشبكية وتطور DR24. وأظهرت نتائج مقايسة ELISA أن مستويات IL-1β وIL-6 وTNF-α في المصل كانت مرتفعة بشكل ملحوظ في فئران نموذج DR (P < 0.0001)، مما يؤكد وجود استجابة التهابية جهازية قوية في حالة DR. ويمكن أن يؤدي الإفراز غير المنضبط لهذه السيتوكينات إلى اختلال الحاجز الدموي الشبكي، وتحفيز موت خلايا RGC المبرمج، ودفع تكوين أوعية دموية جديدة مرضية. وبعد التدخل باستخدام QMG، انخفضت مستويات هذه السيتوكينات بشكل ملحوظ (P < 0.0001)، بينما استعادت الشبكية سلامتها الهيكلية، وزادت نسبة بقاء خلايا RGC، وحُوفظ على سمك الشبكية. وتشير هذه النتائج إلى أن التأثيرات الواقية للشبكية بواسطة QMG ترتبط ارتباطاً وثيقاً بنشاطه القوي المضاد للالتهابات الجهازية. ومن الملاحظ أن هذا التأثير المضاد للالتهاب الجهازي لا يحدث بمعزل عن غيره، بل يقترن بتعديل QMG لميكروبيوم الأمعاء واستعادة البروتينات التنظيمية الرئيسية في القولون، مما يشير إلى أن QMG قد يمارس تأثيراته العلاجية من خلال محور "الأمعاء-الالتهاب الجهازي-الشبكية".
لمزيد من التوضيح للآلية الجزيئية التي يمارس من خلالها QMG تأثيراته المضادة لاعتلال الشبكية السكري (DR) عبر محور الأمعاء-الشبكية، تم فحص التعبير البروتيني للشبكة التنظيمية المتمحورة حول CMKLR1 (والتي تشمل CMKLR1 و Wnt5a و TP53 و AP-1 و PPAR-γ) في كل من أنسجة القولون والشبكية. وأظهرت النتائج أنه بعد تحفيز نموذج DR، أظهرت جميع البروتينات الخمسة اتجاهاً تنازلياً متسقاً في كل من القولون والشبكية، مما يشير إلى أن التواصل الإشاري بين الأمعاء والشبكية قد يكون محجوباً بشكل جهازي في ظل ظروف DR. وعقب التدخل باستخدام QMG، ارتفع تعبير CMKLR1 بشكل ملحوظ في كل من القولون والشبكية (P < 0.05 و P < 0.01)، مما يشير إلى أن QMG قد يستعيد التواصل ثنائي الاتجاه على طول محور الأمعاء-الشبكية من خلال التنشيط الجهازي لـ CMKLR1. بالإضافة إلى ذلك، استعاد QMG بشكل ملحوظ تعبير AP-1 و Wnt5a في القولون، وكذلك تعبير TP53 في الشبكية، مما يشير إلى أن البروتينات المختلفة قد تؤدي أدواراً وظيفية محددة للأنسجة على طول المحور: حيث يعد AP-1 و Wnt5a من المستجيبين الأكثر حساسية لـ QMG في القولون، بينما يلعب TP53، كمنظم للموت الخلوي المبرمج، دوراً أكثر حيوية في الحماية العصبية للشبكية. وكشف تحليل الارتباط الإضافي أن تعبير AP-1 و CMKLR1 و PPAR-γ و Wnt5a في القولون ارتبط ارتباطاً سلبياً ملحوظاً بمستويات السيتوكينات الالتهابية الجهازية (IL-1β و IL-6 و TNF-α) (P < 0.05 إلى P < 0.001)، بينما لم يلاحظ أي ارتباط مباشر بين سيتوكينات المصل وتعبير البروتين في الشبكية. يحمل هذا التباين دلالات آلية هامة: فقد يعمل QMG بشكل أساسي على البيئة الدقيقة للأمعاء عن طريق استعادة تعبير البروتينات التنظيمية الرئيسية في القولون، مما يؤدي بالتالي إلى تثبيط الالتهاب الجهازي؛ وفي المقابل، قد يتم تحقيق استعادة بروتينات الشبكية عبر مسارات غير مباشرة، مثل انتقال المستقلبات المشتقة من ميكروبات الأمعاء إلى الدورة الدموية، والتي تقوم بعد ذلك بتنظيم شلالات الإشارات في الشبكية عن بُعد، بدلاً من أن تكون بوساطة مباشرة من العوامل الالتهابية الجهازية. تدعم هذه النتيجة نموذجاً تنظيمياً محورياً "الأمعاء-الالتهاب الجهازي-الشبكية" وتوفر دليلاً آلياً رئيسياً للتأثير العلاجي لـ QMG على DR عبر محور الأمعاء-الشبكية. ومن بين الأهداف التي تم فحصها، أظهر CMKLR1 تغيرات ملحوظة في كل من أنسجة الشبكية والقولون، مما يجعله مؤشراً حيوياً أولياً محتملاً يربط محور الأمعاء-الشبكية. وقد ارتبط CMKLR1 في دراسات سابقة باستقلاب الدهون السكرية، وشدة DR، وتعديل ميكروبات الأمعاء25,26,27,28,29,30، مما يشير إلى أن تعبيره التفاضلي على طول محور الأمعاء-الشبكية قد يعكس مشاركته في عمليات مرضية متعددة. تضع هذه النتائج CMKLR1 كمرشح واعد كمؤشر حيوي لتشخيص DR والتدخل العلاجي، مما يستدعي المزيد من التحقق الآلي.
بينما يعمل CMKLR1 كعقدة مركزية في محور الأمعاء-الشبكية، يتم تحقيق التأثير العلاجي لـ QMG من خلال شبكة تنظيمية متعددة الأبعاد حيث يوفر كل من Wnt5a وTP53 وAP-1 وPPAR-γ دعماً تآزرياً أساسياً. وتعد إشارات Wnt حاسمة للحفاظ على التوازن في الظهارة المعوية وصحة القولون، بما في ذلك أدوارها في سلامة الظهارة، وتعديل الالتهاب، والحماية المخاطية بوساطة الميكروبيوتا31,32,33,34. كما ينظم PPAR-γ الاستجابات الالتهابية، وقد ثبت أنه يثبط الخلايا البلعمية المنشطة بالدهون في حالة DR ويعزز بقاء المستقبلات الضوئية عبر تعديل الخلايا الدبقية الصغيرة35,36,37. ويعمل AP-1 كعامل نسخ تؤثر من خلاله نواتج أيض ميكروبات الأمعاء، مثل حمض deoxycholic، على التوازن الالتهابي والمناعي38,39,40,41. أما TP53 فيشارك في عملية الالتهام الذاتي، والموت الخلوي المبرمج، وإصابة العصبونات الشبكية في ظروف فرط سكر الدم42,43,44,45. وبشكل جماعي، تشكل عقد الإشارات هذه شبكة مترابطة تربط ديناميكيات ميكروبات الأمعاء باعتلال الشبكية، مما دفعنا لاستقصاء ما إذا كان QMG يعدل هذه الشبكة على طول محور الأمعاء-الشبكية.
تنشأ إحدى الآليات المحورية التي يتم من خلالها تنظيم الالتهاب الجهازى من النظام البيئي للأمعاء. وقد كشف تحليل تسلسل 16S rDNA عن خلل توازن هيكلي في الميكروبيوم مدفوع بمرض السكري في مجموعة النموذج، والذي تميز بخلل كبير في نسبة Firmicutes/Bacteroidetes، وإثراء للتاكسونات الممرضة المحتملة (مثل Odoribacter و Clostridioides)، ونضوب في التاكسونات المفيدة (مثل Lactobacillus و Faecalibaculum). ومن المثير للاهتمام أن العلاج بـ QMG عمل كعامل لاستعادة الميكروبيوتا لعكس هذه التغيرات المرضية من خلال: (1) استعادة التوازن الميكروبي: تطبيع نسب العائلات والأجناس الرئيسية (Faecalibaculum و Ruminococcus و Erysipelotrichaceae) لتقترب من خط الأساس للمجموعة الضابطة؛ (2) التعديل المستهدف للميكروبات الممرضة: تقليل النمو المفرط المرتبط بالسكري لبكتيريا Odoribacter splanchnicus و Clostridioides difficile؛ (3) تعزيز تجميع المجتمع المفيد: تحفيز تكاثر التاكسونات المضادة للالتهابات أو المنتجة للمستقلبات، مثل Lachnoclostridium و Blautia و Flavonifractor plautii. علاوة على ذلك، أشارت تحليلات التنوع وتحليل ارتباط Spearman على مستويات متعددة إلى أن تدخل QMG يعيد توازن التركيب الأساسي متعدد المستويات بشكل فعال بطريقة تعزز التفاعلات الحمائية بين المضيف والميكروبات على طول محور الأمعاء-الشبكية. ولا تؤكد هذه النتيجة التأثير التنظيمي لـ QMG على ميكروبيوتا الأمعاء فحسب، بل تكشف أيضاً عن استراتيجية علاجية محتملة يقوم من خلالها QMG بتنسيق إعادة تشكيل الميكروبيوتا مع نشاط البروتينات التنظيمية الرئيسية (مثل IL-6 و TP53) لقمع الالتهاب الجهازى بشكل مشترك، وبالتالي تخفيف اعتلال الشبكية السكري.
أثبتت الدراسات الحديثة أن الطب الصيني التقليدي (TCM) يمارس تنظيماً متعدد الأهداف على محور الميكروبيوم-التمثيل الغذائي-المناعة، وهو ما يميزه عن العوامل الصيدلانية أحادية الهدف46. وقد أظهرت الأدلة المتراكمة الإمكانات العلاجية لـ QMG في حالات اعتلال الشبكية السكري (DR) والحالات العينية المرتبطة بها. حيث أظهرت تجربة عشوائية محكومة متعددة المراكز أن QMG قلل بشكل ملحوظ من زمن الدورة الشريانية الوريدية في الشبكية لدى مرضى DR، مما يشير إلى تحسن تدفق الدم في الشبكية وتخفيف نقص الأكسجة47. كما أكدت التحليلات التلوية أن QMG المقترن بالعلاج التقليدي أدى إلى تحسن ملحوظ في سماكة البقعة المركزية، وحدّة الإبصار، ومعدل الفعالية الإجمالي في حالات وذمة البقعة السكرية48، كما أدى إلى إطالة زمن تكسر الفيلم الدمعي وزيادة إفراز الدموع لدى المرضى الذين يعانون من جفاف العين49. وفي المرضى الذين يعانون من إصابة عصبية مرتبطة بـ NPDR، أظهر QMG عدم دونية مقارنة بـ calcium dobesilate في الحفاظ على سماكة طبقة الألياف العصبية للشبكية ومساحة المنطقة الخالية من الأوعية الدموية في النقرة50. وكشفت الدراسات الميكانيكية أن QMG يحمي من تلف الشبكية عبر مسارات متعددة، بما في ذلك تثبيط الموت الخلوي المبرمج الالتهابي (pyroptosis) لخلايا Müller والالتهاب المناعي عبر مسار P2X7R/NLRP351، وتنشيط مسار إشارات PI3K/Akt لتقليل الموت الخلوي المبرمج، وتعديل بروتينات الوصلات المحكمة للحفاظ على سلامة الحاجز الدموي الشبكي52. وحددت تحليلات علم الصيدلة الشبكي مركبات نشطة بيولوجياً متعددة في QMG تعمل بشكل تآزري على الأهداف المرتبطة بـ DR16، وأفادت الدراسات السريرية بعدم وجود أحداث ضارة شديدة، مما يشير إلى ملف سلامة إيجابي50. وتُعزى الفعالية العلاجية لـ QMG إلى التأثيرات التآزرية لمكوناته النشطة، بما في ذلك quercetin وkaempferol وisorhamnetin وformononetin وβ‑sitosterol، والتي تمارس مجتمعة تأثيرات مضادة للالتهابات ومضادة للأكسدة ومضادة للموت الخلوي المبرمج من خلال استهداف IL‑6 وTNF‑α وTP53 وAP‑153,54,55,56,57,58,59. وتوسع الدراسة الحالية هذه المعرفة من خلال إثبات أن التأثيرات الواقية لـ QMG تتم أيضاً عبر تعديل محور الأمعاء-الشبكية، وتحديداً من خلال استعادة التوازن الداخلي لميكروبيوم الأمعاء وتنظيم الشبكة الجزيئية المتمحورة حول CMKLR1 لكبح الالتهاب الجهازي وتخفيف تلف الشبكية.
يجب ملاحظة العديد من القيود في هذه الدراسة والتي تستدعي مزيدًا من الاستقصاء في الأبحاث المستقبلية. أولاً، تتطلب العلاقة السببية بين التغيرات في ميكروبات الأمعاء والتحسينات الوظيفية للشبكية مزيدًا من التحقق. ورغم ملاحظة ارتباطات قوية بين إعادة تشكيل الميكروبات الناجم عن QMG والأنماط الظاهرية الواقية للشبكية، فإن تجارب الاستدلال السببي المباشر، مثل نقل ميكروبات البراز، أو نماذج الحيوانات الخالية من الجراثيم، أو استنفاد الميكروبات الناجم عن المضادات الحيوية، ستكون ذات قيمة لتأكيد هذه العلاقة في الدراسات المستقبلية. ثانيًا، تم استخدام تسلسل 16S rDNA لتحديد تكوين الميكروبات، وهو ما يوفر دقة تصنيفية كافية على مستوى الجنس وما فوقه، ولكن لديه قدرة محدودة على تقديم معلومات وظيفية على مستوى السلالة أو إمكانات أيضية دقيقة. سيتم إجراء تسلسل الميتاجينوم أو تحليلات الميتابولوميك في الدراسات اللاحقة لتحديد المسارات الوظيفية الميكروبية الرئيسية التي ينظمها QMG. ثالثًا، تم تقييم التغيرات الميكروبية فقط في نقطة النهاية التجريبية، مما حال دون التتبع الديناميكي للتطور الزمني لإعادة بناء الميكروبات أثناء التدخل بـ QMG. سيساعد أخذ العينات الطولي في الدراسات المستقبلية في تحديد حركية إعادة تشكيل الميكروبات المدفوعة بـ QMG وعلاقتها الزمنية بحماية الشبكية. رابعًا، على الرغم من أن التحليل النسيجي المرضي لاحظ ترقق الشبكية وفقدان RGC والعنقودات الوعائية الجديدة، إلا أنه يجب أن تستكشف الدراسات المستقبلية بروتوكولات حقن STZ بجرعات متعددة والنماذج السكرية وراثيًا، بالإضافة إلى تقديم توصيف أكثر شمولاً للنمط الظاهري لـ DR.
باختصار، تثبت هذه الدراسة أن QMG يحسن اعتلال الشبكية السكري (DR) من خلال ربط الشبكة الجزيئية التي يتمركز حولها CMKLR1 بالالتهاب الجهازي عبر محور الأمعاء-الشبكية. يتجلى ميكانيكا عمل QMG على ثلاثة مستويات: على المستوى الميكروبي، يعكس QMG اختلال التوازن الميكروبي في الأمعاء الناجم عن السكري (على سبيل المثال، استعادة نسبة Firmicutes/Bacteroidetes، وتثبيط Odoribacter وClostridioides، وتعزيز البكتيريا المفيدة مثل Faecalibaculum)؛ وعلى المستوى الجزيئي، ينظم QMG مسار CMKLR1/Wnt5a/PPAR-γ/AP-1/TP53 ويخفف من الالتهاب الجهازي؛ وعلى مستوى الأنسجة، يحمي QMG بنية الشبكية. وتدعم هذه النتائج اعتبار QMG استراتيجية علاجية واعدة تعتمد على محور الأمعاء-الشبكية لعلاج DR، كما توفر أساساً ميكانيكياً لتطبيق الطب الصيني التقليدي (TCM) في علاج مضاعفات السكري.
الإفصاحات
يصرح المؤلفون بأنه ليس لديهم أي مصالح مالية متنافسة معروفة أو علاقات شخصية يمكن أن تبدو مؤثرة على العمل الوارد في هذه الورقة.
شكر وتقدير
يود المؤلف أن يتقدم بالشكر لـ جميع أعضاء فريق عمله الذين قدموا قدراً كبيراً من الدعم والمساعدة لإتمام هذا البحث.
تم دعم هذا البحث من قبل المؤسسة الوطنية للعلوم الطبيعية في الصين (منحة رقم: 82474580)، ومشروع الاستكشاف الحر لمؤسسة المستشفى في مستشفى جامعة تشنغدو للطب الصيني التقليدي (رقم 23ZYTS1601).
المواد
| الاسم | الشركة | رقم فهرسي | التعليقات |
|---|---|---|---|
| جسم مضاد أحادي النسيلة لـ AP-1 | Proteintech | 66313-1-IG | 1:5000 |
| جسم مضاد متعدد النسيلة لـ CMKLR1 | الألفة | AF5291 | 1:1000 |
| جسم مضاد متعدد النسيلة لـ GAPDH | الألفة | AF7021 | 1:5000 |
| جسم مضاد من الماعز مضاد لـ IgG (السلسلة الثقيلة + الخفيفة) للفئران مرتبط بإنزيم HRP | تعدد التخصصات العلمية | GAM0072 | 1:10000 |
| جسم مضاد من الماعز ضد IgG (H+L) للأرانب مرتبط بإنزيم HRP | علوم متعددة | GAR0072 | 1:10000 |
| GraphPad Prism | / | الإصدار 9.5 | |
| Image-Pro Plus | Media Cybernetics, Inc.، روكفيل، ماريلاند، الولايات المتحدة الأمريكية | الإصدار 6.0 | |
| منصة Luoning Bio-Cloud | http://www.biomediv.cn/login.html | ||
| إنترلوكين-1 للفئران (Mouse IL-1)βطقم مقايسة الممتز المربوط إنزيمياً (ELISA) لإنترلوكين 1 بيتا (Interleukin 1 Beta) | Elabscience | E-EL-M0037 | الكشف عن السيتوكينات في المصل |
| طقم مقايسة الممتز المجهري المناعي المرتبط بالإنزيم (ELISA) لإنترلوكين-6 (IL-6) للفئران | إيلابساينس (Elabscience) | E-EL-M0044 | كشف السيتوكينات في المصل |
| عامل نخر الورم في الفئران (Mouse TNF-α)αطقم مقايسة الامتصاص المناعي المرتبط بالإنزيم (ELISA) لعامل نخر الورم ألفا (Tumor Necrosis Factor Alpha) | إلاب ساينس (Elabscience) | E-EL-M3063 | كشف السيتوكينات في المصل |
| نانو فيلت (NanoFilt) | / | الإصدار 2.7.1 | |
| جهاز تسلسل النانوبور GridION | Oxford Nanopore Technologies | https://store.nanoporetech.com/gridion.html | |
| Pannoramic SCAN II | ماسح 3DHISTECH Pannoramic SCAN | https://www.3dhistech.com/scanners/pannoramic-scan-ii-digital-scanner/ | |
| مستقبلات بيروكسيسوم proliferate-activated receptor gamma (PPAR-γجسم مضاد متعدد النسائل | إيمونو واي (ImmunoWay) | bs-0530R | 1:1000 |
| بايثون | / | الإصدار 3.7.4 | |
| حبيبات تشي مينج (Qiming Granule) | شركة تشيجيانغ سانسينج ماندي للصناعات الدوائية المحدودة (Zhejiang Sansheng Mandi Pharmaceutical Co., Ltd.) | رقم الموافقة الوطنية الصينية على الدواء Z20090036 | ٠,٩ جم/كجم، تغذية قسرية عن طريق الفم |
| لغة البرمجة R | / | الإصدار 4.0.3 | |
| قاعدة بيانات SILVA | / | الإصدار 138 | |
| ستريبتوزوتوسين (STZ) | Sigma-Aldrich | S0130 | 35 ملجم/كجم، عن طريق الحقن peritoneal (i.p.) |
| جسم مضاد متعدد النسائل لـ TP53 | Abcam | ab131442 | 1:1000 |
| يو سيرش (Usearch) | / | الإصدار 10.0.240 | |
| جسم مضاد متعدد النسائل لـ Wnt5a | Proteintech | 55184-1-AP | 1:1000 |
| طقم Zymo Research BIOMICS DNA Microprep Kit | Zymo Research | D4301 | استخلاص الحمض النووي الريبوزي منقوص الأكسجين الجينومي (gDNA) من البراز |
المراجع
- Lei C, et al. Homocysteine and diabetic retinopathy. Exp Eye Res. 2026;262:110729.
- Owens DR, et al. IDF diabetes Atlas: A worldwide review of studies utilizing retinal photography to screen for diabetic retinopathy from 2017 to 2024 inclusive. Diabetes Res Clin Pract. 2025;226:112346.
- Zhu J, Huang J, Sun Y, Xu W, Qian H. Emerging role of extracellular vesicles in diabetic retinopathy. Theranostics. 2024;14(4):1631–1646.
- Xie L, Lin W. The role of gut microbiota dysbiosis in the inflammatory pathogenesis of diabetic retinopathy. Front Immunol. 2025;16:1604315.
- Niu J, Liu Y, Peng H, Chen J, Chen L. Early-stage diabetic retinopathy: gut-metabolic triggers, immune-neurodegeneration, and interventions. Graefes Arch Clin Exp Ophthalmol. 2025;263(10):2723–2736.
- Rowan S, et al. Involvement of a gut-retina axis in protection against dietary glycemia-induced age-related macular degeneration. Proc Natl Acad Sci U S A. 2017;114(22):E4472–E4481.
- Rzeczycki P, Pęciak O, Plust M, Droździk M. Gut Microbiota in the Regulation of Intestinal Drug Transporters: Molecular Mechanisms and Pharmacokinetic Implications. Int J Mol Sci. 2025;26(24):11897.
- Yang H, et al. Mediating role of aging and obesity in the relationship between dietary index for gut microbiota and metabolic syndrome and its potential regulatory mechanisms. Eur J Med Res. 2025;31(1):137.
- Zahavi EE, et al. Repeat-element RNAs integrate a neuronal growth circuit. Cell. 2025;188(16):4350–4365.e22.
- Dander E, et al. The chemerin/CMKLR1 axis regulates intestinal graft-versus-host disease. JCI Insight. 2023;8(5):e154440.
- Zhang J, et al. Therapeutic targets in the Wnt signaling pathway: Treating cancer with specificity. Biochem Pharmacol. 2025;236:116848.
- Liu M, Lim ST, Song W, Coffman TM, Wang X. Beyond lipids: fenofibrate in diabetic retinopathy and nephropathy. Trends Pharmacol Sci. 2026;47(3):325–341.
- Wu Y, et al. The active ingredient β-sitosterol in the anti-inflammatory agents alleviates perianal inflammation in rats by inhibiting the expression of Srebf2, activating the PPAR signaling pathway, and altering the composition of gut microbiota. Int Immunopharmacol. 2025;152:114470.
- Lin T, Chen C, Zhao LC, Zhu HY, Li W. The beneficial effects of Traditional Chinese Medicine on diabetic retinopathy: mechanisms, therapeutics, and prospects. Acupunct Herb Med 2026;6(2):188–204.
- Huo J, et al. Evaluation of individualized treatment of nonproliferative diabetic retinopathy: a multicenter, randomized, parallel-controlled study. J Tradit Chin Med. 2022;42(1):90–95.
- Huang Y, et al. Pharmacological mechanism and clinical study of Qiming granules in treating diabetic retinopathy based on network pharmacology and literature review. J Ethnopharmacol. 2023;302(Pt A):115861.
- Salma B, et al. Ameliorative Efficacy of the Cassia auriculata Root Against High-Fat-Diet + STZ-Induced Type-2 Diabetes in C57BL/6 Mice. ACS Omega. 2020;6(1):492–504.
- Srinivasan K, Viswanad B, Asrat L, Kaul CL, Ramarao P. Combination of high-fat diet-fed and low-dose streptozotocin-treated rat: a model for type 2 diabetes and pharmacological screening. Pharmacol Res. 2005;52(4):313–320.
- Liu Y, Deng J, Fan D. Ginsenoside Rk3 ameliorates high-fat-diet/streptozocin-induced type 2 diabetes mellitus in mice via the AMPK/Akt signaling pathway. Food Funct. 2019;10(5):2538–2551.
- Hu RY, et al. AFG Ameliorates Diabetic Retinopathy through AMPK-Dependent Autolysosomal Pathway: From Network Pharmacology to In Vivo and In Vitro Validation. J Agric Food Chem. 2026;74(2):2124–2139.
- Reagan-Shaw S, Nihal M, Ahmad N. Dose translation from animal to human studies revisited. FASEB J. 2008;22(3):659–661.
- Zou Q, et al. Oxidative stress in diabetic retinopathy. Clin Chim Acta. 2026;584:120871.
- Clements JN, Mesawich J, Twisdale C. Current and Emerging Pharmacologic Therapies for Diabetic Retinopathy. Pharmacotherapy. 2026;46(3):e70119.
- Rezvani Z, Khani F, Afarid M, Asadian F, Takhshid MA. Clinical values of systemic inflammatory indices in diabetic retinopathy. Clin Exp Optom. 2026;109(3):371–385.
- Zhu Z, et al. Targeting the CMKLR1-Mediated Signaling Rebalances Immunometabolism State in Middle-Age Testicular Macrophages. Adv Sci (Weinh). 2026;13(14):e15166.
- Lin Y, et al. Epithelial chemerin-CMKLR1 signaling restricts microbiota-driven colonic neutrophilia and tumorigenesis by up-regulating lactoperoxidase. Proc Natl Acad Sci U S A. 2022;119(29):e2205574119.
- Puthanmadhom Narayanan S, et al. Epigenetic Alterations Are Associated With Gastric Emptying Disturbances in Diabetes Mellitus. Clin Transl Gastroenterol. 2020;11(3):e00136.
- Wang L, et al. Chemerin/CMKLR1 Axis Promotes the Progression of Proliferative Diabetic Retinopathy. Int J Endocrinol. 2021;2021:4468625.
- Zheng C, et al. α-NETA down-regulates CMKLR1 mRNA expression in ileum and prevents body weight gains collaborating with ERK inhibitor PD98059 in turn to alleviate hepatic steatosis in HFD-induced obese mice but no impact on ileal mucosal integrity and steatohepatitis progression. BMC Endocr Disord. 2023;23(1):9.
- Dranse HJ, et al. The impact of chemerin or chemokine-like receptor 1 loss on the mouse gut microbiome. PeerJ. 2018;6:e5494.
- Flores-Hernández E, et al. Canonical and non-canonical Wnt signaling are simultaneously activated by Wnts in colon cancer cells. Cell Signal. 2020;72:109636.
- Qi Y, et al. Heat-inactivated Bifidobacterium adolescentis ameliorates colon senescence through Paneth-like-cell-mediated stem cell activation. Nat Commun. 2023;14(1):6121.
- Ou W, et al. Cooperation of Wnt/β-catenin and Dll1-mediated Notch pathway in Lgr5-positive intestinal stem cells regulates the mucosal injury and repair in DSS-induced colitis mice model. Gastroenterol Rep (Oxf). 2024;12:goae090.
- Dong Y, et al. Berberine ameliorates DSS-induced intestinal mucosal barrier dysfunction through microbiota-dependence and Wnt/β-catenin pathway. Int J Biol Sci. 2022;18(4):1381–1397.
- Escandon P, et al. The role of peroxisome proliferator-activated receptors in healthy and diseased eyes. Exp Eye Res. 2021;208:108617.
- Blot G, et al. Perilipin 2-positive mononuclear phagocytes accumulate in the diabetic retina and promote PPARγ-dependent vasodegeneration. J Clin Invest. 2023;133(19):e161348.
- Zhou W, et al. TREM2-dependent activation of microglial cell protects photoreceptor cell during retinal degeneration via PPARγ and CD36. Cell Death Dis. 2024;15(8):623.
- Bala Kumar S, et al. Gut microbial metabolites targeting JUN in renal cell carcinoma via IL-17 signaling pathway: network pharmacology approach. Mol Divers. 2026;30(1):613–632.
- Wang L, et al. Gut microbial bile acid metabolite skews macrophage polarization and contributes to high-fat diet-induced colonic inflammation. Gut Microbes. 2020;12(1):1–20.
- Hagan T, et al. Antibiotics-Driven Gut Microbiome Perturbation Alters Immunity to Vaccines in Humans. Cell. 2019;178(6):1313–1328.e13.
- Meng Y, et al. Jinlida ameliorates diabetic kidney disease via gut microbiota-dependent production of pyridoxamine targeting renal AGEs/RAGE and TGF-β pathways. Phytomedicine. 2026;150:157744.
- Zhou H, Zhang L, Ding C, Zhou Y, Li Y. Upregulation of HMOX1 associated with M2 macrophage infiltration and ferroptosis in proliferative diabetic retinopathy. Int Immunopharmacol. 2024;134:112231.
- Mohammad HMF, et al. Neuroprotective effect of levetiracetam in mouse diabetic retinopathy: Effect on glucose transporter-1 and GAP43 expression. Life Sci. 2019;232:116588.
- Peng H, et al. Autophagy and senescence of rat retinal precursor cells under high glucose. Front Endocrinol (Lausanne). 2023;13:1047642.
- Ding Y, Chen L, Xu J, Feng Y, Liu Q. APAF1 Silencing Ameliorates Diabetic Retinopathy by Suppressing Inflammation, Oxidative Stress, and Caspase-3/GSDME-Dependent Pyroptosis. Diabetes Metab Syndr Obes. 2024;17:1635–1649.
- Yang T, et al. Clinical study on the modulating effects of Jiaotaiwan on the modulating effects of microbiota–SCFAs–neurotransmitter/immune axis in patients with depression. Acupunct Herb Med 2025;5(4):456–468.
- Luo XX, et al. Effect of qiming granule on retinal blood circulation of diabetic retinopathy: a multicenter clinical trial. Chin J Integr Med. 2009;15(5):384–388.
- Hu Z, et al. Add-on effect of Qiming granule, a Chinese patent medicine, in treating diabetic macular edema: A systematic review and meta-analysis. Phytother Res. 2021;35(2):587–602.
- Yang M, et al. The Efficacy and Safety of Qiming Granule for Dry Eye Disease: A Systematic Review and Meta-Analysis. Front Pharmacol. 2020;11:580.
- Ma XF, et al. Efficacy and Safety of Qiming Granule for Nerve Injury Associated with Non-proliferative Diabetic Retinopathy: A Multicenter, Randomized, Non-inferiority, Active-Controlled Clinical Trial. Chin J Integr Med. 2026;32(3):195–203.
- Zhou Q, et al. Qiming granules regulate Müller cell pyroptosis and the P2X7R/NLRP3 immune inflammatory pathway in diabetic retinopathy. Chin Med. 2026;21(1):89.
- Zhou L, Qin T, Lv Y, Wu Z. Qiming Granules Ameliorate Diabetic Retinopathy by Regulating the PI3K/Akt Signaling Pathway. J Ocul Pharmacol Ther. 2026;42(3):202–212.
- Li HD, Li MX, Zhang WH, Zhang SW, Gong YB. Effectiveness and safety of traditional Chinese medicine for diabetic retinopathy: A systematic review and network meta-analysis of randomized clinical trials. World J Diabetes. 2023;14(9):1422–1449.
- Chen F, et al. Isorhamnetin promotes functional recovery in rats with spinal cord injury by abating oxidative stress and modulating M2 macrophages/microglia polarization. Eur J Pharmacol. 2021;895:173878.
- Naudhani M, Thakur K, Ni ZJ, Zhang JG, Wei ZJ. Formononetin reshapes the gut microbiota, prevents progression of obesity and improves host metabolism. Food Funct. 2021;12(24):12303–12324.
- Qu Y, et al. Kaempferol Alleviates Murine Experimental Colitis by Restoring Gut Microbiota and Inhibiting the LPS-TLR4-NF-κB Axis. Front Immunol. 2021;12:679897.
- Saikia L, et al. Therapeutic Potential of Quercetin in Diabetic Neuropathy and Retinopathy: Exploring Molecular Mechanisms. Curr Top Med Chem. 2024;24(27):2351–2361.
- Yao H, et al. Kaempferol Protects Blood Vessels From Damage Induced by Oxidative Stress and Inflammation in Association With the Nrf2/HO-1 Signaling Pathway. Front Pharmacol. 2020;11:1118.
- Zhang HX, Li YY, Liu ZJ, Wang JF. Quercetin effectively improves LPS-induced intestinal inflammation, pyroptosis, and disruption of the barrier function through the TLR4/NF-κB/NLRP3 signaling pathway in vivo and in vitro. Food Nutr Res. 2022;66:10.