The study presents a set of protocols to differentiate human primed pluripotent stem cells (hPSCs) towards early post-implantation embryonic lineages, and to assess genomic and chromosomal (in)stability during hPSC culture, including through the quantification of single- and double-strand breaks, mitotic defects, or aneuploidy.
مقالة منهجية
A Robust Protocol for Germ Layer Differentiation of Human Pluripotent Stem Cells and Evaluation of Their Chromosome and Genomic Integrity
* These authors contributed equally
في هذه المقالة
ملخص
الملخص
Human pluripotent stem cells (hPSCs) can differentiate into any cell type of the human body and represent a powerful in vitro model to recapitulate early human development. However, their use in regenerative medicine and developmental studies is limited by their genomic and chromosomal instability acquired during long-term culture, often driven by the clonal advantage conferred by spontaneous gain or loss of chromosomes. Here, a detailed culture condition that robustly recapitulates early differentiation and describes methods to assess chromosomal and genomic (in)stability in hPSC cultures. First, the cell culture approaches are described that enable controlled exit from pluripotency and homogeneous differentiation into primitive streak, neuroectoderm, paraxial/lateral mesoderm, and definitive endoderm-like cells. Second, a comprehensive set of protocols is described to assess genomic and chromosomal instability during routine pluripotent stem cell culture, including the detection of single- and double-strand breaks during S-phase, mitotic abnormalities (such as ultrafine bridges, lagging chromosomes or micronuclei) and their direct consequence–the emergence of aneuploidy after cell division. In summary, this work aims to standardize protocols to model early human post-implantation lineage commitment and to provide the tools required to assess routine karyotypic stability of hPSCs during in vitro culture.
المقدمة
Human pluripotency represents a developmental stage in which embryonic cells can give rise to all cell types of the future organism. Human pluripotent stem cells (hPSCs) capture this state in vitro and provide a powerful system to study human development and disease. Based on their origin, hPSCs can be subdivided into two groups. Human embryonic stem cells (hESCs) were first derived in 1998 from the epiblast of preimplantation human embryos, establishing culture conditions that support pluripotency, long-term self-renewal, and differentiation into mature cell types of all three germ layers1. In 2007, Yamanaka and colleagues demonstrated that somatic cells could be reprogrammed to pluripotency by expression of OCT4, KLF4, MYC, and SOX22. These human induced pluripotent stem cells (hiPSCs) display an “embryonic stem cell-like” transcriptional and epigenetic profile highly similar to hESCs and have opened new horizons towards personalized medicine (regenerative and cell therapy), given their isolation from the patient.
From a developmental biology perspective, mammalian development has been widely studied using the mouse embryo as a reference. However, significant interspecies differences in morphogenesis, cell fate specification, and chromosomal stability highlight the need to complement these studies with human-specific models3,4. Human embryo research is legally and ethically restricted beyond 14 days post-fertilization, corresponding to the onset of gastrulation. As a result, hPSCs have emerged as a powerful in vitro system to recapitulate aspects of early human embryonic development and cell fate choices in the absence of direct access to human embryos. During the last decades, research on cellular signaling, matrix support, and stem cell differentiation has paved the way for numerous protocols to generate robust early germ layers and mature cell types of diverse organs in two dimensions (2D) using PSCs, in a scalable manner5,6,7,8. These systems, however, lack a hierarchical structure, dimensionality, and an embryo-like architecture that has been recently provided by 3D human stem cell-based embryo models, which recapitulate early developmental stages through self-organization9,10,11.
In the first part of this article, the focus is on the generation of early post-implantation human embryonic lineages from hPSCs in 2D. Previous protocols have described in detail the signaling cascades driving pluripotency exit and specific lineage commitment using hPSCs, in an attempt to reconstruct developmental events that have been previously observed and documented during vertebrate patterning (including in the mouse embryo) but have remained impossible to test in the human context12,13,14. For instance, Wnt, BMP, and Nodal/Activin signaling are critical for the establishment of the primitive streak and the mesodermal and endodermal cellular subtypes that arise in the posterior side of the gastrulating mammalian embryo15,16. On the other hand, inhibition of TGFβ, Wnt, and BMP cascades drives anteriorization of the epiblast and the commitment of primed pluripotent stem cells towards neuroectodermal fate7,17,18,19. Given the diverse combination of basal medium, growth factors, and chemical inhibitors used in different protocols, there are unified procedures to generate the primitive streak, definitive endoderm, neuroectoderm, and lateral/paraxial mesoderm from hPSCs in a clear point-by-point protocol supported by the expected results. The advantage of using this first protocol lies in the robustness of generating a highly pure population of cells resembling a specific developmental stage, which allows scalable experimentation for bulk omic analysis (RNA sequencing, chromatin landscape profiling, metabolite quantification, proteomics, etc.). Additionally, the protocol is based on the use of growth factors/chemical inhibitors and bypasses the use of transgene overexpression, driving differentiation, making it accessible for many laboratories.
In the second part of the article, the basic and easy-to-follow approaches to quantify DNA damage, mitotic aberrations, and chromosomal instability in hPSC culture are described. Human pluripotent stem cells undergo basal replicative stress and chromatin defects over long-term culture, which promote DNA damage and mitotic defects20,21,22,23. Additionally, culture conditions, including high cell density24 and signaling pathways involved in pluripotency maintenance21,25,26—such as those mediated by growth factors like FGF2 and TGFβ1—can trigger chromosomal instability. Thus, given the pervasive genomic instability of PSCs, this protocol offers an array of methods for researchers studying chromosome and genome integrity mechanisms. It includes the biochemistry approaches to map these frequent aberrations observed in PSC culture across the cell cycle, including: the accumulation of DNA damage or single strand breaks in cells undergoing DNA replication by immunofluorescence; the quantification of mitotic defects observed by static imaging (ultrafine bridges and chromosome missegregation), as well as the mapping of the consequences of these phenomena, namely the imbalance of chromosome number in cells after division (aneuploidy) or the presence of micronuclei. Overall, these techniques offer a starting point to study DNA integrity and chromosome (in)stability beyond moving to other more complex techniques, including single-cell genomic analysis.
البروتوكول
The human induced pluripotent stem cell (hiPSC) line H10-CESCG-297 was reprogrammed from peripheral mononuclear blood cells of a male donor by the laboratory of Prof. Snyder (Stanford University) with institutional review board approval (Stanford University, 30064). A material transfer agreement was obtained for research use. Laboratory testing confirmed a negative result for Mycoplasma. Expression of core pluripotent factors and the capacity to differentiate towards the three germ layers confirmed the primed state of the human pluripotent stem cell (hPSC) line. The Comité d’Ethique Hospitalo-Facultaire H.U.B-ULB (021/406) also approved use of the cell line for the research project (protocol approval: P2026/305/CCB B4062026000130). Representative results were generated using H10-CESCG-297; the same protocols have also been validated for human embryonic stem cell (hESC) lines, including H9 and H1.
NOTE: Refer to Supplementary File 1 for hPSC culture, thawing, freezing, and image acquisition and analysis procedures. Follow the differentiation and genome-integrity procedures described below.
1. Differentiation of human PSCs toward the three germ layers
NOTE: Approximately 20% detached and floating cells can occur on the day after seeding under pluripotency conditions. During differentiation toward the three germ layers, apoptosis can increase to approximately 40% detached and floating cells during pluripotency exit. Unlike the passaging procedure in Supplementary File 1, full single-cell dissociation permits accurate cell counting and controlled seeding density to start differentiation assays. ROCKi exposure during the first 24 h after seeding supports cell survival and attachment.
- Differentiate human PSCs toward the primitive streak
- Warm cell-culture reagents at room temperature for 30 min before use. Maintain hPSCs according to Supplementary File 1 (Section 1.2, Passaging human PSCs) until reaching 70%–80% confluence in six wells. Determine the cell number before seeding.
- One hour prior to dissociation, coat the required number of wells of a 12-well plate with 0.25 mL of vitronectin solution (5 µg/mL) per well. Place the well plate in an incubator at 37 °C for 1 h.
- Prepare a solution of EDTA 0.5 mM in Dulbecco’s phosphate-buffered saline (DPBS). Discard the spent medium in which PSCs have been cultivated and wash once with phosphate-buffered saline (PBS).
- Add 0.5 mL of EDTA 0.5 mM solution per well from the wall of the plate and incubate at 37 °C for 5 min.
- Carefully aspirate the 0.5 mM EDTA solution without dislodging the detached hPSC clumps. Add 1 mL of serum-free medium (SFM) containing 10 µM Y-27632 and pipette approximately 10 times to obtain a single-cell suspension.
- Transfer the medium with cells into a 15 mL conical tube using a 5 mL serological pipette or P1000 tip. Aspirate the leftover rhVTN from the pre-coated well plate(s) and add 1 mL of SFM with 10 µM Y-27632 to each well of the 12-well plate.
- Seed hPSCs at 70,000 cells/well in a 12-well plate. Culture in SFM for 48 h, including ROCKi during the first 24 h and excluding ROCKi during the subsequent 24 h.
- On Day 3, replace the medium with primitive streak (PS) medium (Table 1) and culture the cells for an additional 24 h before harvesting.
- Differentiate human PSCs toward lateral mesoderm
- Maintain hPSCs according to the procedure described in the Supplementary File 1 (Section 1.2, Passaging human PSCs) until reaching 70%–80% confluence in 6 wells.
- One hour prior to dissociation, coat the required number of wells of a 12-well plate with 0.25 mL of vitronectin solution (5 µg/mL) per well. Place the well plate at 37 °C for 1 h.
- Dissociate the hPSC colonies into single cells as described in the EDTA dissociation procedure in Section 1.1.
- Seed hPSCs at 70,000 cells/well in a 12-well plate. Culture in SFM for 48 h, including ROCKi during the first 24 h and excluding ROCKi during the subsequent 24 h.
- On Day 3, replace the medium with lateral mesoderm (LM)-A medium (Table 1) and culture the cells for an additional 24 h. On Day 4, replace LM-A medium with LM-B medium (Table 1), and culture the cells for an additional 24 h before harvesting.
- Differentiate human PSCs toward paraxial mesoderm
- Maintain hPSCs according to the procedure described in the Supplementary File 1 (Section 1.2, Passaging human PSCs) until reaching 70%–80% confluence in 6 wells.
- One hour before dissociation, coat the required number of wells of a 12-well plate with 0.25 mL of vitronectin solution (5 µg/mL) per well. Place the well plate in an incubator at 37 °C for 1 h.
- Dissociate the hPSC colonies into single cells as described in the EDTA dissociation procedure in Section 1.1.
- Seed hPSCs at 70,000 cells/well in a 12-well plate. Culture in SFM for 48 h, including ROCKi during the first 24 h and excluding ROCKi during the subsequent 24 h.
- On Day 3, replace the medium with paraxial mesoderm (PM)-A medium (Table 1) and culture the cells for an additional 24 h. On Day 4, replace PM-A medium with PM-B medium (Table 1), and culture the cells for an additional 24 h prior to harvesting.
- Differentiate human PSCs toward definitive endoderm
- Maintain hPSCs according to the procedure described in the Supplementary File 1 (Section 1.2, Passaging human PSCs) until reaching 70%–80% confluence in 6 wells.
- One hour before dissociation, coat the required number of wells of a 12-well plate with 0.25 mL of vitronectin solution (5 µg/mL) per well. Place the well plate in an incubator at 37 °C for 1 h.
- Dissociate the hPSC colonies into single cells as described in the EDTA dissociation procedure in Section 1.1.
- Seed hPSCs at 50,000 cells/well in a 12-well plate. Culture in SFM for 48 h, including ROCKi during the first 24 h and excluding ROCKi during the subsequent 24 h.
- On Day 3, replace the medium with definitive endoderm (DE)-A medium (Table 1) and culture the cells for an additional 24 h.
- On Day 4, replace DE-A medium with DE-B medium (Table 1). Culture for an additional 48 h and replace the DE-B medium daily before harvesting.
- Differentiate human PSCs toward neuroectoderm
- Maintain hPSCs according to the procedure described in the Supplementary File 1 (Section 1.2, Passaging human PSCs) until reaching 70%–80% confluence.
- One hour prior to dissociation, coat the required number of wells of a 12-well plate with 0.25 mL of vitronectin solution (5 µg/mL) per well. Place the well plate at 37 °C for 1 h.
- Dissociate the hPSC colonies into single cells as described in the EDTA dissociation procedure in Section 1.1.
- Seed hPSCs at 50,000 cells/well in a 12-well plate. Culture in SFM with ROCKi for the first 24 h.
- On Day 2, replace the medium with neuroectoderm (NE) medium (Table 1). Replace NE medium daily and culture for an additional 96 h before harvesting on Day 7.
2. Gene expression analysis of fate markers
- Extract RNA and synthesize cDNA
NOTE: Perform RNA extraction according to the Quick-RNA Miniprep kit instructions, with the minor modifications described below.- Resuspend the pellet in 300 µL of the kit lysis buffer. Transfer the lysate to a Spin-Away Filter in a collection tube.
- Centrifuge at 13,000 × g for 30 s. Mix the flow-through thoroughly with 300 µL of absolute ethanol at a 1:1 ratio.
- Transfer the mixture to a Zymo-Spin IIICG Column in a collection tube. Centrifuge at 13,000 × g for 30 s and discard the flow-through.
- Wash the column with 400 µL RNA Wash buffer provided by the kit and centrifuge the samples at 13,000 × g for 30 s. Discard the flow-through.
- Mix 5 µL of DNase I (1 U/µL) with 75 µL of DNA digestion buffer in a nuclease-free tube. Add 80 µL directly to the center of each column and incubate for 15 min at room temperature.
- After incubation, add 400 µL of RNA Prep Buffer to the column and centrifuge the column at 13,000 × g for 30 s. Discard the flow-through.
- Label nuclease-free centrifuge tubes with the sample names. Transfer each column to the corresponding tube and discard the collection tubes.
- Add 40 µL of DNase/RNase-free water directly to the center of the column matrix without touching the matrix. Centrifuge at 13,000 × g for 1 min, discard the column, and retain the eluted RNA.
- Quantify the RNA concentration using a NanoDrop. Prepare cDNA from 700 ng of RNA per sample according to the instructions for the iScript cDNA synthesis kit, using the modified volumes specified below.
- Calculate the required RNA and Milli-Q water volumes from the measured RNA concentration. Use a combined RNA and Milli-Q water volume of 7.5 µL per sample.
- Label PCR tubes and transfer the required amount of RNA and Milli-Q water.
- Prepare a master mix containing 0.5 µL of reverse transcriptase and 2 µL of 5× reaction mix per tube. Multiply each volume by the number of samples.
- Add 2.5 µL of the master mix to each tube and mix the total mixture well.
- Centrifuge the samples for 10 s. Run the thermal cycler program for 5 min at 25 °C, 20 min at 46 °C, and 1 min at 95 °C.
- Dilute the cDNA fourfold in Milli-Q water by combining 10 µL of cDNA with 30 µL of Milli-Q water.
NOTE: Store cDNA at -20 °C.
- Perform quantitative PCR
- Prepare a qPCR plate layout for all genes and samples. Include three technical replicates for each sample-gene combination; the representative biological experiment used three technical replicates per sample.
- Prepare qPCR mixes as described in the two mixture-preparation steps below.
- Prepare mix 1 by combining Milli-Q water and diluted cDNA in a nuclease-free tube. For each well, provide 4 µL of Milli-Q water and 1 µL of diluted cDNA; calculate each sample mix as 4 µL Milli-Q water × 3 technical replicates × number of genes × 1.05 and 1 µL diluted cDNA × 3 technical replicates × number of genes × 1.05.
- Prepare mix 2 by combining iTaq SYBR Green with forward and reverse qPCR primers prepared from 10 µM stocks. For each well, provide 4 µL of iTaq SYBR Green and 1 µL of the combined primers, producing 0.5 µM of each primer; calculate each gene mix as 4 µL iTaq SYBR Green × 3 technical replicates × number of samples × 1.05 and 1 µL combined primers × 3 technical replicates × number of samples × 1.05.
- Load 5 µL of mix 1 and 5 µL of mix 2 into the corresponding wells defined in the plate layout prepared at the start of Section 2.2. Seal the plate with the Microseal B Foil.
- Centrifuge the plate for 2 min at 100 × g.
- Place the plate in the qPCR instrument. Program an initial denaturation for 3 min at 95 °C, followed by 40 cycles of denaturation for 5 s at 95 °C and annealing/elongation for 30 s at 60 °C.
- Run the qPCR.
- Export the data and normalize expression to the housekeeping gene. Plot relative expression using ΔCt, calculated as ΔCt(sample) = Ct(treatment) - Ct(reference).
NOTE: Refer to Supplementary Table 1 for the primer sequences used.
3. Immunofluorescence protocol to determine cell-fate acquisition
- Immunostain and image cell-fate markers
- Before seeding cells for immunofluorescence as described in Supplementary File 1 (Section 1.2, Passaging human PSCs), place 15 mm glass coverslips in a 12-well plate. Carefully add approximately 700 µL of 5 µg/mL recombinant human vitronectin (rhVTN) to each well and incubate at 37 °C for 1 h.
- After culture of hPSCs/differentiation (Section 1.2 of the Supplementary File 1 and Section 1 of the protocol, respectively), wash once with PBS. Fix the cells using 4% paraformaldehyde (PFA) for 15 min at room temperature.
CAUTION: Handle 4% PFA in a biosafety cabinet operating at biosafety level 2 or in a chemical fume hood. Avoid skin contact and inhalation. Clean spills with 70% ethanol. - Wash the wells twice with 1 mL of PBS.
NOTE: Store the plate at 4 °C for several weeks if necessary. Prevent drying by adding 1.5 mL of PBS to each well and sealing the plate with parafilm. - From the permeabilization step onward, add all solutions slowly over the coverslips to prevent cell detachment. Permeabilize using 0.5% Triton X-100 in DPBS for 10 min.
- Block for 30 min with a blocking solution composed of 2% horse serum (HS), 0.1% Triton X-100, and DPBS. Prepare primary antibody dilutions in blocking solution, and incubate the coverslips with the solution overnight at 4 °C.
- Create a humid chamber with wet tissue or tube lids partially filled with water to prevent antibody evaporation. Place the coverslips in a light-protected box containing wet tissue to prevent drying.
- On the following day, wash the coverslips three times with DPBS. Incubate with secondary antibodies and DAPI (1 ng/mL) in blocking solution for 1 h at room temperature.
NOTE: Protect samples from light during and after secondary-antibody incubation. - Wash the coverslips three times with DPBS. Label glass slides according to the sample names and mount coverslips using Fluoromount on glass slides.
- Seal the coverslips with transparent nail polish to prevent evaporation and store the sealed coverslips at 4 °C. Perform static imaging using an epifluorescence or confocal microscope with a 63× oil objective.
- Quantify cell-fate acquisition by immunofluorescence
- Acquire at least 5–10 images per sample at 60× magnification. Install Fiji/ImageJ on the analysis computer.
- Open each image separately in Fiji/ImageJ as a composite image. Select Image > Color > Split Channels.
- Select the DAPI channel and open the Threshold window by pressing Option + Shift + T.
- Adjust the threshold to select all nuclei. Select Apply to display selected nuclei in white.
- In the same image, select Process > Smooth, followed by Process > Binary > Make Binary and Process > Binary > Watershed. Confirm separation of individual nuclei in the DAPI channel.
- Select Analyze > Analyze Particles in the same image. Set Size to 1500-Infinity, adjusting the value according to nuclear size; set Circularity to 0–1; select Overlay Masks under Show; select Display Results, Clear Results, and Add to Manager; and select OK.
- Confirm that numbered nuclei appear in the DAPI image and keep the ROI Manager window open.
- Select the image containing the cell-fate marker of interest, such as TBXT or OCT4. Select Show All twice in ROI Manager to transfer the numbered nuclear regions to the marker channel.
- Manually count marker-positive nuclei and express the count relative to the total number of nuclei.
4. Quantification of DNA damage in human PSCs during S phase
- Culture cells and induce single- and double-strand DNA damage
- Maintain hPSCs according to the procedure described in the Supplementary File 1 (Section 1.2, Passaging human PSCs) until reaching 70%–80% confluence in 6 wells.
- One hour before dissociation, coat the required number of wells with glass coverslips inside a 12-well plate with 0.5 mL of vitronectin solution (5 µg/mL) per well. Place the well plate in an incubator at 37 °C for 1 h.
- Dissociate the hPSC colonies into single cells as described in the EDTA dissociation procedure in Section 1.1.
- Seed hPSCs at a density of 70,000 cells/well in 12-well plates. Culture the cells in SF medium with Y-27632 ROCK inhibitor (10 µM) during the first 24 h.
- Change the medium to SF without ROCKi during the following days until harvesting. When reaching 70%–80% confluence, add EdU 10 µM to the medium of the cells for 20 min.
- Wash the wells twice with DPBS and add warm SFM with the DNA damage treatment selected for each well, and incubate for 3 h until harvesting.
- For proof-of-concept experiments, treat cells with aphidicolin (50–200 nM), hydroxyurea (HU; 1–3 mM), or camptothecin (CPT; 1–2.5 µM) to impair DNA replication. Prepare each compound in DMSO and treat control wells with a DMSO volume matching the corresponding drug condition.
- Immunostain and image single- and double-strand breaks
- After hPSCs treatment, wash cells with PBS.
- Fix the cells using 4% paraformaldehyde (PFA) for 15 min at room temperature. Follow the procedure with caution as described below.
CAUTION: Handle 4% PFA in a biosafety cabinet operating at biosafety level 2 or in a chemical fume hood. Avoid skin contact and inhalation. Clean spills with 70% ethanol. - Wash each well twice with PBS.
NOTE: Store the plate at 4 °C for several weeks if necessary. Prevent drying by adding 1.5 mL of PBS to each well and sealing the plate with parafilm. - Permeabilize using 0.5% Triton X-100 in DPBS for 30 min.
- Perform the Click-iT EdU reaction according to the kit instructions. Prepare the EdU reaction mixture and incubate the coverslips for 30 min in the dark.
- Block for 30 min with blocking solution, composed of 2% horse serum (HS), 0.1% Triton X-100, and DPBS.
- Prepare primary-antibody dilutions in blocking solution and incubate the coverslips overnight at 4 °C. Use phospho-RPA antibody to detect ssDNA damage and phosphorylated H2AX (γH2AX) antibody to detect dsDNA damage.
- Create a humid chamber with wet tissue or tube lids partially filled with water to prevent antibody evaporation. Place the coverslips in a light-protected box containing wet tissue to prevent drying.
- On the following day, wash the coverslips three times with DPBS. Incubate with secondary antibodies and DAPI (1 ng/mL) in blocking solution for 45 min.
NOTE: Protect samples from light during and after secondary-antibody incubation. - Wash the samples three times with DPBS. Label glass slides according to the sample names and mount coverslips using Fluoromount on glass slides.
- Seal the coverslips with transparent nail polish to prevent evaporation and store the sealed coverslips at 4 °C. Perform static imaging using an epifluorescence or confocal microscope using 63× oil magnification.
- For further quantification, acquire at least 10 representative images of each coverslip.
- Quantify single- and double-strand DNA breaks
- Install Fiji/ImageJ on the analysis computer. Open each image separately in Fiji/ImageJ as a composite image.
- Select Image > Color > Split Channels. Select the DAPI channel and open the Threshold window by pressing Option + Shift + T.
- Adjust the threshold to select all nuclei. Select Apply to display selected nuclei in white.
- In the same image, select Process > Smooth, followed by Process > Binary > Make Binary and Process > Binary > Watershed. Confirm separation of individual nuclei in the DAPI channel.
- Select Analyze > Analyze Particles in the same image. Set Size to 1500-Infinity, adjusting the value according to nuclear size; set Circularity to 0-1; select Overlay Masks under Show; select Display Results, Clear Results, and Add to Manager; and select OK.
- Confirm that numbered nuclei appear in the DAPI image and keep the ROI Manager window open.
- Select the image containing the damage marker of interest, such as γH2AX or phospho-RPA. Select Show All twice in ROI Manager to transfer the numbered nuclear regions to the damage-marker channel.
- Select Measure in ROI Manager and copy the mean value for each nucleus from the Results table. Interpret each value as the mean fluorescence intensity of the damage-marker signal in the corresponding nucleus.
5. Ultrafine bridge detection in hPSCs
- Culture cells for ultrafine bridge analysis
- Maintain hPSCs according to the procedure described in the Supplementary File 1 (Section 1.2, Passaging human PSCs) until reaching 70-80% confluence in 6 wells.
- One hour before dissociation, coat the required number of wells with glass coverslips inside a 12-well plate with 0.5 mL of vitronectin solution (5 µg/mL) per well. Place the well plate in an incubator at 37 °C for 1 h.
- Dissociate the hPSC colonies into single cells as described in the EDTA dissociation procedure in Section 1.1.
- Seed hPSCs at 70,000 cells/well in a 12-well plate. Culture in SFM containing 10 µM Y-27632 for the first 24 h.
- Change the medium to SF without ROCKi during the following days until harvesting.
- At 70–80% confluence, apply the planned treatment. For proof-of-concept induction of replicative stress and mitotic ultrafine bridges, treat with aphidicolin (50–200 nM) for 16 h.
- Harvest the cells and proceed to ultrafine-bridge immunostaining and imaging as described in Section 5.2.
- Immunostain and image ultrafine bridges
- After hPSCs treatment, wash cells once with DPBS. Fix the cells using 4% PFA for 5 min at room temperature, followed by treatment with ice-cold methanol for another 5 min at -20 °C.
CAUTION: Handle 4% PFA in a biosafety cabinet operating at biosafety level 2 or in a chemical fume hood. Avoid skin contact and inhalation. Clean spills with 70% ethanol. - Wash the coverslips twice with 1 mL of DPBS in each well.
NOTE: Store the plate at 4 °C for several weeks if necessary. Prevent drying by adding 1.5 mL of PBS to each well and sealing the plate with parafilm. - Block for 30 min with blocking solution, composed of 5% horse serum (HS), 0.1% Triton X-100, and DPBS.
- Prepare primary-antibody dilutions in blocking solution and incubate the coverslips for 3 h at room temperature in a humid chamber prepared as described in Step 3.1.6. Use anti-BLM primary antibodies to label ultrafine bridges.
- Wash the coverslips three times with DPBS and incubate in a solution with secondary antibodies and DAPI (1 ng/mL) in blocking solution for 45 min at room temperature, protected from light. Wash the samples three times with DPBS.
- Label the glass slides according to the sample names to avoid confusion and mount coverslips using Fluoromount on glass slides. Seal the coverslips with transparent nail polish to prevent evaporation and store the sealed coverslips at 4 °C.
- Perform static imaging using an epifluorescence or confocal microscope using 63× oil magnification. Quantify the number of anaphases or telophases with the presence or absence of BLM+ ultrafine bridges in each coverslip.
- After hPSCs treatment, wash cells once with DPBS. Fix the cells using 4% PFA for 5 min at room temperature, followed by treatment with ice-cold methanol for another 5 min at -20 °C.
6. Chromosome missegregation and micronucleus detection in hPSCs
NOTE: Anaphase frequency depends on the proliferative state and decreases during germ-layer differentiation. Maintain confluence below 90% to retain higher anaphase rates because overconfluence can reduce proliferation. Unsynchronized hPSC cultures generally contain 2%–5% anaphases per total cells in a captured field, although rates vary between cultures. Basal chromosome missegregation, defined as anaphases with clear lagging chromosomes, remains approximately 5%–8% and varies among hPSC lines. Micronuclei occur at <2% under basal culture conditions.
- Culture cells to study mitotic defects and lagging chromosomes
- Maintain hPSCs according to the procedure described in the Supplementary File 1 (Section 1.2, Passaging human PSCs) until reaching 70%–80% confluence in 6 wells.
- One hour before dissociation, coat the required number of wells with glass coverslips inside a 12-well plate with 0.5 mL of vitronectin solution (5 µg/mL) per well. Place the well plate at 37 °C for 1 h.
- Dissociate the hPSC colonies into single cells as described in the EDTA dissociation procedure in Section 1.1.
- Seed hPSCs at 70,000 cells/well in a 12-well plate. Culture in SFM containing 10 µM Y-27632 for the first 24 h.
- Change the medium to SF without ROCKi during the following days until harvesting.
- At 70–80% confluence, apply the planned treatment. For proof-of-concept induction of mitotic catastrophe, treat with the MPS1 inhibitor reversine (0.25–0.5 µM) for 6 h, followed by a 7 h recovery without reversine before harvesting.
- Harvest the cells and proceed to chromosome-missegregation and micronucleus immunostaining and imaging as described in Section 6.2.
- Immunostain and image chromosome missegregation and micronuclei
- After hPSCs treatment, wash the cells once with DPBS.
- Fix the cells using 4% PFA for 15 min at room temperature. Follow precaution steps that appear below.
CAUTION: Handle 4% PFA in a biosafety cabinet operating at biosafety level 2 or in a chemical fume hood. Avoid skin contact and inhalation. Clean spills with 70% ethanol. - Wash the coverslips twice with 1 mL of PBS in each well.
NOTE: Store the plate at 4 °C for several weeks if necessary. Prevent drying by adding 1.5 mL of PBS to each well and sealing the plate with parafilm. - Block for 30 min with blocking solution, composed of 2% horse serum (HS), 0.1% Triton X-100, and DPBS.
- Prepare primary-antibody dilutions in blocking solution and incubate the coverslips overnight at 4 °C in a humid chamber prepared as described in Step 3.1.6. Use anti-Lamin B1 antibodies to label nonruptured micronuclei and CREST antibodies to detect centromeric proteins in lagging chromosomes.
- Create a humid chamber with wet tissue or tube lids partially filled with water to prevent antibody evaporation. Place the coverslips in a box containing wet tissue to prevent drying.
- Wash the coverslips three times with DPBS and incubate in a solution with secondary antibodies and DAPI (1 ng/mL) in blocking solution for 45 min at room temperature, protected from light. Wash the samples three times with DPBS.
- Label the glass slides according to the sample names to avoid confusion, and mount coverslips using Fluoromount on the corresponding glass slides. Seal the coverslips with transparent nail polish to prevent evaporation and store the sealed coverslips at 4 °C.
- Perform static imaging using an epifluorescence or confocal microscope using 63× oil magnification.
- Count interphase cells containing contiguous Lamin B1-positive micronuclei. Count anaphases or telophases containing centric CREST-positive or acentric CREST-negative lagging chromosomes.
7. Quantification of aneuploidy by Giemsa karyotyping
- Culture cells for aneuploidy assessment by Giemsa karyotyping
- Maintain hPSCs according to the procedure described in the Supplementary File 1 (Section 1.2, Passaging human PSCs) until reaching 70%–80% confluence in 6 wells.
- One hour before dissociation, coat the required number of wells from a 6-well plate with 0.5 mL of vitronectin solution (5 µg/mL) per well. Place the well plate at 37 °C for 1 h.
NOTE: Coat two wells of a 6-well plate per sample for harvesting. - Dissociate the hPSC colonies into single cells as described in the EDTA dissociation procedure in Section 1.1.
- Seed hPSCs at 140,000 cells/well in a 6-well plate. Culture in SFM containing 10 µM Y-27632 for the first 24 h.
- Change the medium to SF without ROCKi during the following days until harvesting.
- At 70%–80% confluence, apply treatment if required and arrest cells in G2/M with 100 ng/mL nocodazole. For proof-of-concept aneuploidy induction, treat with 0.1 µM reversine for 6 h, followed by 100 ng/mL nocodazole for 16 h.
- Collect the complete supernatant containing floating cells because mitotic cells tend to float. Wash once with DPBS, detach the remaining cells with 0.5 mM EDTA as described in Supplementary File 1 (Section 1.2.5), combine cells from two wells in a 15 mL tube, and proceed to Section 7.2.
NOTE: Metaphase spreading efficiency depends primarily on successful mitotic arrest after nocodazole pretreatment, which produced approximately 80% of cells in G2/M in the representative experiments, metaphase chromosome condensation, and sufficient drop height and expulsion speed to rupture cells on the slide.
- Fix and process samples for Giemsa karyotyping
- Prepare 500 mL of Carnoy's fixative at least 1 day in advance by mixing 375 mL of 100% methanol with 125 mL of acetic acid at a 3:1 ratio; divide into 50 mL aliquots and store at -20 °C. On the day of fixation, prepare 50 mL of hypotonic solution by mixing 40 mL of Milli-Q water with 10 mL of RPMI 1640 without serum or antibiotics.
CAUTION: Prepare Carnoy's fixative in a chemical fume hood and avoid inhalation and skin contact with acetic acid. Neutralize acetic acid spills with sodium bicarbonate (NaHCO3) or sodium hydroxide (NaOH), producing water (H2O), carbon dioxide (CO2), and sodium acetate (CH3COONa), and then clean the surface with 70% ethanol. - Centrifuge cells at room temperature for 4 min at 200 × g.
- Remove the supernatant and gently resuspend the cells in 750 µL of hypotonic solution. Transfer the suspension to a 1.5 mL tube.
- From the hypotonic incubation onward, pipette gently to prevent swollen cells from rupturing. Incubate cells for 15 min at room temperature.
- Add 250 µL of Carnoy's fixative prechilled to -20 °C to each tube. Gently mix the cell suspension by pipetting.
NOTE: Excessive pipetting shear can rupture the cells. Expect the suspension color to change from red to green because of the pH change. - Centrifuge cells at 4 °C for 4 min at 200 × g. Remove the supernatant carefully without touching the pellet of cells.
- Resuspend in 1 mL of Carnoy’s. Centrifuge cells at 4 °C for 4 min at 200 × g.
- Remove the supernatant carefully without touching the pellet of cells. Resuspend in 1 mL Carnoy’s.
- Store cells for at least one day at -20 °C.
NOTE: Store samples at -20 °C for several months if required. - Prepare 3–4 glass slides per sample as follows. Clean slides with 70% ethanol in a beaker and dry the slides with a paper towel.
- Remove the EtOH completely by transferring the slides to a beaker with distilled water and ice, surrounded by ice. Let the slides cool down for 1 h to allow proper cell spreading later on.
- Add ice directly to the distilled water to produce an ice-water mixture suitable for metaphase spreading. Remove samples from the freezer and centrifuge at 4 °C for 4 min at 200 × g.
- Place a sheet of Whatman paper on a paper towel on the bench. Remove supernatant carefully.
- Resuspend the first sample in 500 µL of 100% acetic acid using a 1000 µL tip. Remove one slide from the ice-water mixture and place the slide on the prepared Whatman paper.
- Position at least three slides in contact with one another to minimize sample loss. Test the setup with water before sample application to verify the drop direction. Drop each sample vertically from approximately 1 m with rapid pipette expulsion to rupture cells and expose metaphase spreads.
- Take the 500 µL solution with cells with a 1000 µL pipette. Drop all the volume with cells onto the slide in one strong pulse.
- Practice the drop with water to establish the pipette position. Divide each sample into two 250 µL portions to retain a backup. Maintain a drop height of approximately 1 m to rupture cells and spread chromosomes.
- Label the sample name on the slide. Heat a small cooker with a flat surface at ~50 °C and cover the surface with wet tissue paper.
- Place all slides on the heated surface until completely dry; drying can take up to 30 min. Allow the slides to dry completely at room temperature in the chemical fume hood.
- Prepare 500 mL of Carnoy's fixative at least 1 day in advance by mixing 375 mL of 100% methanol with 125 mL of acetic acid at a 3:1 ratio; divide into 50 mL aliquots and store at -20 °C. On the day of fixation, prepare 50 mL of hypotonic solution by mixing 40 mL of Milli-Q water with 10 mL of RPMI 1640 without serum or antibiotics.
- Stain, image, and quantify Giemsa karyotype samples
- Prepare enough 8% Giemsa solution to fill a glass slide box by mixing 4 mL of Giemsa stain with 46 mL of Milli-Q water.
CAUTION: Prepare Giemsa solution in a chemical fume hood and avoid inhalation and skin contact. - Place the slides in a glass slide box filled with Giemsa solution. Stain for 15 min.
- Remove the slides and discard the staining solution. Fill the box with Milli-Q water and wash the slides three times to remove residual Giemsa stain.
- Dry the slides under the chemical hood overnight.
- On the following day, apply two 30 µL drops of Euparal to each slide. Place a coverslip over the mounting medium and gently seal by applying finger pressure.
CAUTION: Euparal is toxic and flammable, and high inhalation exposure can cause organ damage; eye exposure can cause severe irritation and redness. Perform the Euparal mounting step in a chemical fume hood while wearing latex or nitrile gloves and safety goggles. Absorb spills immediately with tissue and wash the area with water and detergent. After eye contact, rinse the eyes with water for at least 15 min. - Image as many metaphase spreads as possible per slide with a brightfield microscope and a 63× oil objective.
- After imaging, open each image in Fiji/ImageJ and manually count the chromosomes in each spread with the Multi-point or Point Tool. Quantify at least 50 spreads per sample.
- Image only spreads containing clearly separated and countable chromosomes. Classify spreads with 46 chromosomes as euploid and spreads with any other chromosome count as aneuploid.
- Prepare enough 8% Giemsa solution to fill a glass slide box by mixing 4 mL of Giemsa stain with 46 mL of Milli-Q water.
8. Statistical analysis
- Perform statistical analyses and prepare graphs using GraphPad Prism. Unless otherwise stated, present data as the mean ± standard deviation (SD), define statistical significance as an adjusted p value < 0.05, and use the following figure thresholds: *p < 0.05, **p < 0.01, ***p < 0.001, and ****p < 0.0001.
- Define an independent biological replicate as a separate cell-culture experiment. Treat results as paired when every treatment condition is evaluated within the same independent experiment.
- Treat individual cells, nuclei, anaphases, metaphase spreads, microscopic fields, and regions of interest as technical measurements rather than independent biological replicates. Specify biological-replicate and technical-observation counts in the figure legends.
- Compare matched treatment conditions by repeated-measures one-way ANOVA followed by Dunnett's multiple comparisons test. Compare independent groups by ordinary one-way ANOVA followed by Dunnett's multiple comparisons test.
- When accounting for unequal variances, use Welch's one-way ANOVA followed by Dunnett's T3 multiple comparisons test. Specify the statistical test for each experiment in the corresponding figure legend.
النتائج
Efficient differentiation of hPSCs towards the three germ layers
Primed human pluripotent stem cells (hPSCs) represent in vitro the human epiblast of the pre-gastrulating embryo and are a great model to recapitulate early human embryogenesis (Figure 1A,B). They self-renew and retain pluripotency -the ability to differentiate towards all the cell types of the future organism. Here, we direct PSC differentiation towards lineage-specific paths upon primed pluripotency exit through a chemical and growth factor approach (Figure 1B,C). The protocols described in Figure 1C have been implemented based on previous lineage specification methods using hPSCs, including those generating the primitive streak stage6,21,27, lateral and paraxial mesoderm6,21,27, definitive endoderm5,21,28, and neuroectoderm7,21.
Human pluripotent stem cells are characterized by the expression of core pluripotency factors, including OCT4 (Figure 1D). Upon reaching 70% confluency, removal of pluripotent medium conditions and modulation of specific signaling cascades trigger a downregulation of POU5F1 and NANOG mRNA levels, and the protein it codes, pluripotency factor OCT4, towards differentiation to any lineage tested (Figure 1D–F). Strong activation of Wnt/β-catenin signaling through GSK3 inhibition robustly induces a primitive streak-like cell state, characterized by the upregulation of Brachyury (TBXT) at both the mRNA and protein levels, with ~97% of cells quantified as TBXT+ (Figure 1D,E,G). Activation of WNT, BMP, and Nodal/Activin signaling to specify a posterior primitive streak-like cell, followed next day by inhibition of Wnt and TGFβ signaling while maintaining BMP activation, drives the formation of lateral mesoderm (LM)-like cells, characterized by high HAND1 protein and mRNA expression (Figure 1D,E,G). On the other hand, activation of Wnt signaling and Activin-A in the absence of BMP signaling drives the formation of an anterior primitive streak-like state. Subsequent inhibition of the BMP cascade while maintaining Wnt activity drives the formation of paraxial mesoderm (PM)-like cells expressing TBX6 protein and TBX6 mRNA levels (Figure 1D,E,G). Sustained activation of Nodal/Activin-A after WNT activity peak at the PS stage induces differentiation of hPSCs towards definitive endoderm (DE), characterized by high mRNA and protein levels of SOX17 (Figure 1D,E,G). Last, maintenance during several days of hPSCs under a double TGFβ and BMP inhibition regime triggered the formation of neuroectodermal cells expressing PAX6 at the protein (~65% positive cells) and mRNA levels, which corresponds in vivo to the epithelial layer of the anterior epiblast at the onset of gastrulation (Figure 1A). Of note, the protocols described yield a robust and homogeneous differentiation towards post-implantation lineages (>92% positive for lineage-specific markers), except for neuroectodermal differentiation (~65% PAX6+ cells) (Figure 1D,E,G), with an efficiency similar to other studies5,6,7,27,28. Additionally, we provide a list of reference cell fate markers that characterize the lineages described here (Table 2).
Mapping genome and chromosome (in)stability in pluripotency
Alterations in chromosome structure and number (aneuploidy) represent a hallmark of tumorigenesis, which often impair cellular differentiation of hPSCs29,30,31,32,33, representing a hurdle for their application in cell therapy and regenerative medicine. Given the underlying chromosomal instability that can arise during long-term hPSC culture, driven by the acquisition and selection of recurrent chromosomal abnormalities and by endogenously elevated replicative stress22,32,34. Quantification of chromosomal integrity and DNA damage remains critical: as an experimental checkpoint to validate the health of the cells prior to starting differentiation protocols, and ii) for those interested in studying the mechanisms of genome integrity regulation in stem cells. Here, the utility of a combined chromosomal instability and DNA damage assessment workflow for distinguishing different forms of genome instability in hPSCs (Figure 2A) is demonstrated. As proof-of-concept perturbations, cells were exposed to a panel of replication stress-inducing agents and mitotic inhibitors (Figure 2B–O, Table 3).
Compared to somatic cells, hPSCs display fast cell cycle dynamics characterized by a shortened G1 phase and a high proportion of cells in S-phase, which makes them susceptible to replication stress (RS)22,35,36. Replication stress can arise from diverse mechanisms, including replication fork slowing, nucleotide depletion, and replication-transcription conflicts, ultimately leading to DNA damage. To model distinct forms of replication stress, cells were treated with aphidicolin (Aphi; 50 nM), an inhibitor of replicative DNA polymerases; hydroxyurea (HU; 1–3 mM), which depletes intracellular deoxyribonucleotide pools through inhibition of ribonucleotide reductase; or camptothecin (CPT; 1–2.5 µM), a topoisomerase I inhibitor that generates severe replication-associated DNA lesions (Figure 2B, Table 3). Low doses of aphidicolin and HU induced a modest increase in double-stranded DNA breaks, as measured by γH2AX (Figure 2C,D). In contrast, treatment with CPT produced substantially greater γH2AX accumulation, indicating enhanced replication-associated DNA damage (Figure 2C,D). Similarly, phospho-RPA levels were most strongly and consistently elevated following CPT treatment. HU-treated cells in S-phase displayed a bimodal response, with some cells showing a mild increase in phospho-RPA, while others remained unperturbed, but at the same threshold as aphidicolin-treated cells. Overall, the phospho-RPA levels in the HU-treated condition were comparable to those observed following aphidicolin treatment. (Figure 2C,D). Together, these results demonstrate that the workflow can quantitatively distinguish distinct degrees and types of replication stress, highlighting its utility for evaluating genome stability in hPSCs and their response to genotoxic stress.
Replication stress can give rise to incomplete DNA replication at vulnerable genomic regions, allowing cells that have escaped DNA repair mechanisms to enter mitosis with under-replicated DNA21,37. During chromosome segregation in mitosis (M-phase), unreplicated DNA can generate ultrafine bridges (UFBs), which are visualized as BLM+ threads connecting chromatids during segregation38,39. Treatment with aphidicolin at either 50 or 200 nM for 16 h increased the percentage of mitotic hPSCs displaying BLM-positive UFBs relative to the DMSO-treated control (Figure 2E–G), highlighting the sensitivity of this developmental stage to genomic instability. The largest mean increase, approximately threefold relative to control, was observed following treatment with 50 nM aphidicolin. These results demonstrate that mild replication stress can persist into mitosis as unresolved DNA structures in hPSCs. Intriguingly, we have recently shown that long-term culture of hPSCs also increases the rate of UFBs in mitosis20, linking basal replication stress with mitotic defects (Figure 2A).
Unrepaired genomic instability often causes mitotic catastrophe at the onset of cell division. Chromosome missegregation represents a phenotype characterized by the presence of “lagging” chromosomes lying between the separating chromatids during anaphase, which frequently occurs in cells with unresolved damage in S-phase. These events can lead to incorrect segregation of chromosomes into the daughter cells after mitosis, which can give rise to an imbalance in the structure/number of chromosomes (aneuploidy), which is frequent during long-term pluripotent stem cell culture20,21. Primed hPSCs display a basal rate of chromosome missegregation of ~5%–9%21(Figure 2H–J), which drastically increases to 30%–70% upon MPS1 checkpoint spindle inhibition via reversine in a concentration-dependent manner (Figure 2H–J). As a consequence, many of these lagging chromosomes cause nuclear envelope rupture and reside in the cytoplasm, forming micronuclei (MN) after mitosis. Micronuclei are often considered a hallmark and driver of chromosomal instability, since the presence of DNA outside the nucleus triggers an immune cellular response that can promote tumor progression and further replicative stress40,41. In pluripotent conditions, MN are scarce in interphase hPSCs (Figure 2K,L). While a low dose of reversine treatment (0.25 µM) increases the presence of MN to ~5% of the cells, 0.5 µM reversine triggers ~40% of hPSCs in interphase with micronuclei (Figure 2K,L). In conclusion, mitotic instability can be easily measured through immunofluorescence and static imaging by quantifying the percentage of anaphases displaying lagging chromosomes and the percentage of interphase cells with MN.
To functionally confirm gains and losses of chromosomes after genomic stress, we perform karyotype or Giemsa staining. This technique allows the spread of the compact chromosomes of metaphase-arrested cells for direct visual quantification after staining, confirming whether each cell is euploid (46 chromosomes) or aneuploid (imbalance in this number). Pre-treatment with reversine rendered a high percentage of aneuploid cells (~40%) compared to the control untreated (~20%) (Figure 2M–O). In conclusion, an array of methods is provided to map genomic stress and chromosomal instability across the human pluripotent stem cell cycle.
Troubleshooting and identification of suboptimal outcomes
Representative suboptimal outcomes are shown in Figure 3, which helps to troubleshoot the protocols described above. The two differentiated hPSC cultures shown in Figure 3A display high cell densities and overlaps between adjacent DAPI-positive nuclei. Following thresholding and watershed processing, groups of overlapping nuclei were merged into large, segmented objects rather than being identified as individual nuclei (Figure 3A, right pictures). In other regions, individual nuclei were fragmented into multiple nuclei or were not accurately segmented. Consequently, the resulting regions of interest did not reliably correspond to individual cells and were not suitable for quantitative measurement of nuclear fluorescence intensity.
When this occurs, the threshold, watershed, and particle-size parameters should first be reviewed, and the segmentation overlay should be checked to confirm that each region of interest corresponds to one intact nucleus. The same analysis criteria should be applied consistently across experimental conditions to avoid quantification bias. To reduce segmentation failure, the initial seeding density should be optimized to prevent excessive confluence, and representative fields containing distinguishable nuclei should be acquired without selectively excluding regions based on the experimental phenotype. If individual nuclei cannot be separated reliably after parameter adjustment, the image should be excluded from quantitative analysis, or cells should be manually segmented. In this scenario, more powerful software, including Ilastik or CellPose, may be of great help to avoid manual segmentation42,43.
Figure 3B shows representative suboptimal Giemsa-stained metaphase preparations. Instead of forming a single spread containing spatially separated chromosomes, the chromosomes remain clustered and overlap each other. Some fields also contain multiple chromosome clusters, cellular debris, and poorly defined or incompletely dispersed metaphase preparations. These features prevent reliable identification and counting of individual chromosomes and may result from inadequate hypotonic swelling, incomplete cellular rupture, excessive cell density on the slide, insufficient dropping force, or inconsistent dropping height. Additionally, it is not rare to observe metaphase spreads with condensation defects (~5%–10% in basal conditions culturing hPSCs, Figure 3C). We and others22 have graded these metaphases where chromosomes are highly condensed, making it impossible to quantify the chromosome number.
To improve metaphase-spread quality, the duration of hypotonic treatment should be kept consistent, the fixed-cell suspension should be resuspended gently but completely, and the cell concentration should be adjusted before slide preparation. The slide should be sufficiently cold and wet, and the suspension should be dropped at a consistent height and force. Only metaphase spreads containing clearly distinguishable, sufficiently condensed chromosomes within an imaging field should be included in chromosome-number quantification. Dense chromosome clusters, overlapping spreads, incomplete cellular rupture, and fields in which chromosome loss or mixing between adjacent spreads is suspected should be excluded.
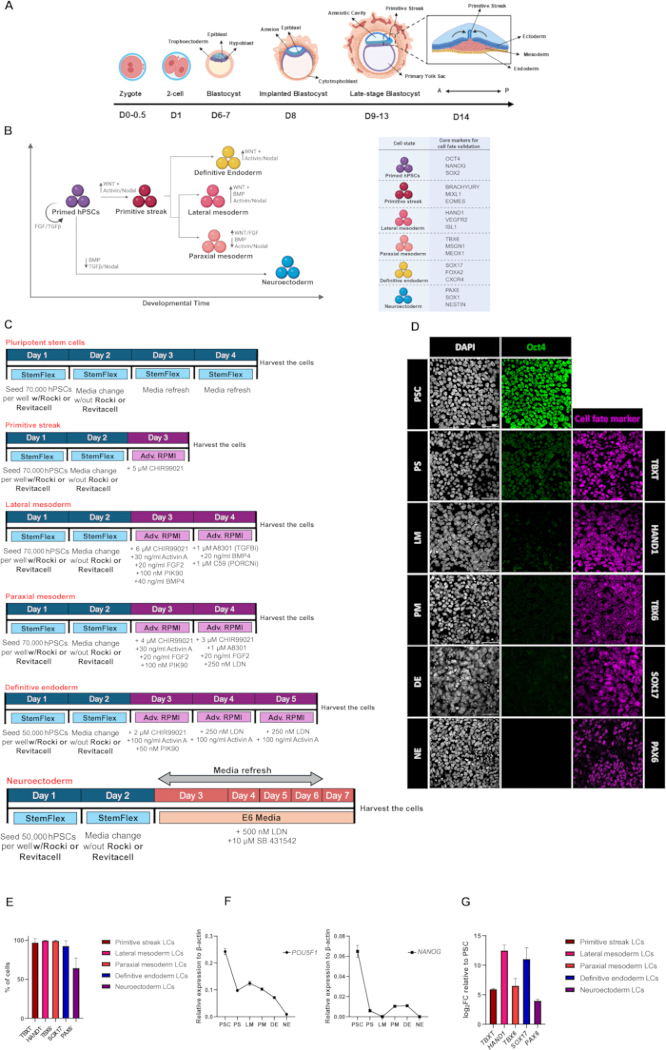
Figure 1. In vitro differentiation of human pluripotent stem cells into early embryonic lineages and validation of cell fate identity. (A) Schematic representation of early human embryonic development until the gastrulation stage, highlighting the developmental context of the in vitro lineages derived in this study. Inspiration for the creation of this scheme comes from Shahbazi et al44. (B) Overview of the differentiation of hPSCs to generate primitive streak (PS), lateral mesoderm (LM), paraxial mesoderm (PM), definitive endoderm (DE), and neuroectoderm (NE)-like cells. (C) Experimental timeline and culture conditions used for human lineage specification. (D) Representative immunofluorescence experiment characterizing lineage-specific identity acquisition following differentiation. Nuclei were counterstained with DAPI. Primitive streak (PS)-like cells were identified by TBXT, lateral mesoderm (LM) by HAND1, paraxial mesoderm (PM) by TBX6, definitive endoderm (DE) by SOX17, and neuroectoderm (NE) by PAX6. Scale bars: 50 µm. (E) Quantification of lineage-associated marker-positive cells following differentiation. Primitive-streak-like, lateral-mesoderm-like, paraxial-mesoderm-like, definitive-endoderm-like, and neuroectoderm-like cells were identified by TBXT, HAND1, TBX6, SOX17, and PAX6 expression, respectively. The percentage of marker-positive cells was calculated relative to the total number of DAPI-positive nuclei in each field. Bars represent the mean ± SD of 10 imaging fields with n>1000 cells analyzed per lineage in one representative differentiation experiment. No inferential statistical comparisons were performed. (F) Representative experiment of a qPCR of hPSCs undergoing differentiation. Expression values were normalized to β-actin and plotted as relative expression (2^-ΔCt). Data are mean ± SD of n = 3 technical replicates. (G) Representative experiment of a qPCR of hPSCs undergoing differentiation. Expression values were normalized to β-actin and plotted as log₂ fold change (log₂FC) relative to the pluripotent state. Data are mean ± SD of n = 3 technical replicates. Figures 1A–C have been created using BioRender and are used under the terms of the applicable license. Please click here to view a larger version of this figure.
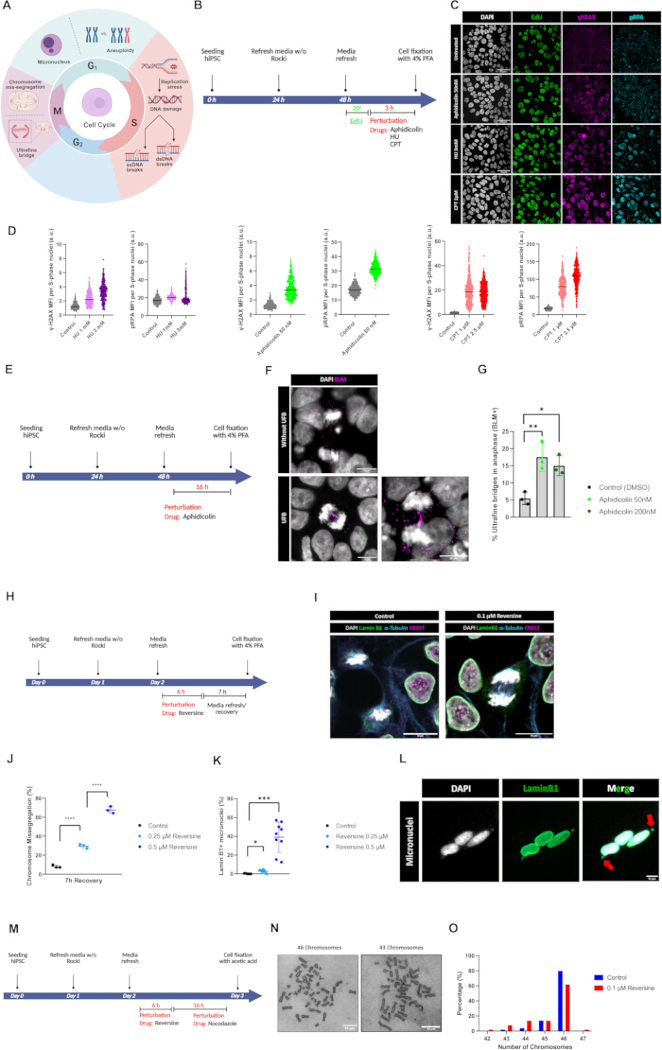
Figure 2. Mapping DNA damage and mitotic defects in hPSCs. (A) Schematic overview of the genomic and chromosomal instability phenotypes associated with each phase of the human cell cycle, including single-stranded DNA (ssDNA) and double-stranded DNA (dsDNA) breaks, ultrafine bridges (UFBs), chromosome missegregation, micronuclei formation, and aneuploidy. (B) Experimental workflow to assess DNA damage responses to replication stress during S-phase using Aphidicolin, hydroxyurea (HU), and camptothecin (CPT). (C) Representative immunofluorescence images of untreated and drug-treated hPSCs stained with DAPI, EdU, γH2AX, and phospho-RPA (pRPA). EdU-positive nuclei identify cells in S phase, whereas γH2AX marks DNA double-strand breaks. pRPA serves as a marker of DNA damage associated with single-stranded DNA and DNA replication stress, and can also be detected at sites of double-strand break repair. Scale bars: 50 µm. (D) Quantification of γH2AX and pRPA mean fluorescence intensity (MFI) in EdU-positive nuclei following treatment with HU, aphidicolin, or CPT, as shown in C. Data are from a representative biological experiment with >300 EdU-positive nuclei analyzed per condition. The number of EdU-positive nuclei analyzed were: control (n = 326), HU 1 mM (n = 314), HU 3 mM (n = 304), aphidicolin 50 nM (n = 377), CPT 1 µM (n = 426), and CPT 2.5 µM (n = 504). Values are shown in arbitrary units (a.u.). (E) Experimental workflow used to assess ultrafine bridge formation following aphidicolin treatment. (F) Representative immunofluorescence images of anaphase cells without and with BLM+ ultrafine bridges. Cells were stained with DAPI and BLM. Scale bars, 10 µm. (G) Quantification of the percentage of anaphase cells containing BLM-positive ultrafine bridges after treatment with aphidicolin. Data are mean ± SD of n = 3 independent biological replicates, with > 50 anaphases quantified per condition in each experiment; each dot represents one independent experiment. Statistical significance was assessed using repeated-measures one-way ANOVA followed by Dunnett’s multiple comparisons test, comparing each aphidicolin-treated condition with the DMSO control. *p < 0.05 and **p < 0.01. (H) Experimental workflow used to induce chromosome segregation defects and micronuclei formation. (I) Representative immunofluorescence images of control and reversine-treated cells stained for DAPI, Lamin B1, α-tubulin, and CREST. The arrow indicates a chromosome missegregation event. Scale bars = 10 µm. (J) Quantification of chromosome missegregation following reversine treatment and 7 h recovery. Data are mean ± SD of n = 3 independent biological replicates, with > 100 anaphases quantified per condition in each experiment; each dot represents one independent experiment. Statistical significance was assessed using one-way ANOVA followed by Dunnett’s multiple comparisons test. ****p < 0.0001. (K) Quantification of interphase cells displaying Lamin B1-positive micronuclei following reversine treatment. Data are mean ± SD of n > 3 independent biological replicates, with > 100 interphase cells quantified per condition in each experiment. Statistical significance was assessed using Welch’s ANOVA followed by Dunnett’s T3 multiple comparisons test. *p < 0.05, ***p < 0.001. (L) Representative immunofluorescence images of micronuclei stained for DAPI and Lamin B1. Arrows indicate Lamin B1-positive micronuclei. Scale bars: 10 µm. (M) Experimental workflow used for metaphase spread preparation and karyotype analysis. (N) Representative metaphase chromosome spreads showing cells with normal chromosome number, 46 chromosomes, and abnormal chromosome number, 43 chromosomes. Scale bars: 10 µm. (O) Quantification of cells with normal and abnormal chromosome number following the indicated treatments (n = 50 metaphase spreads per condition combined from n = 3 different biological experiments/3 independent coverslips). Figure 2A has been created using BioRender and is used under the terms of the applicable license. Please click here to view a larger version of this figure.
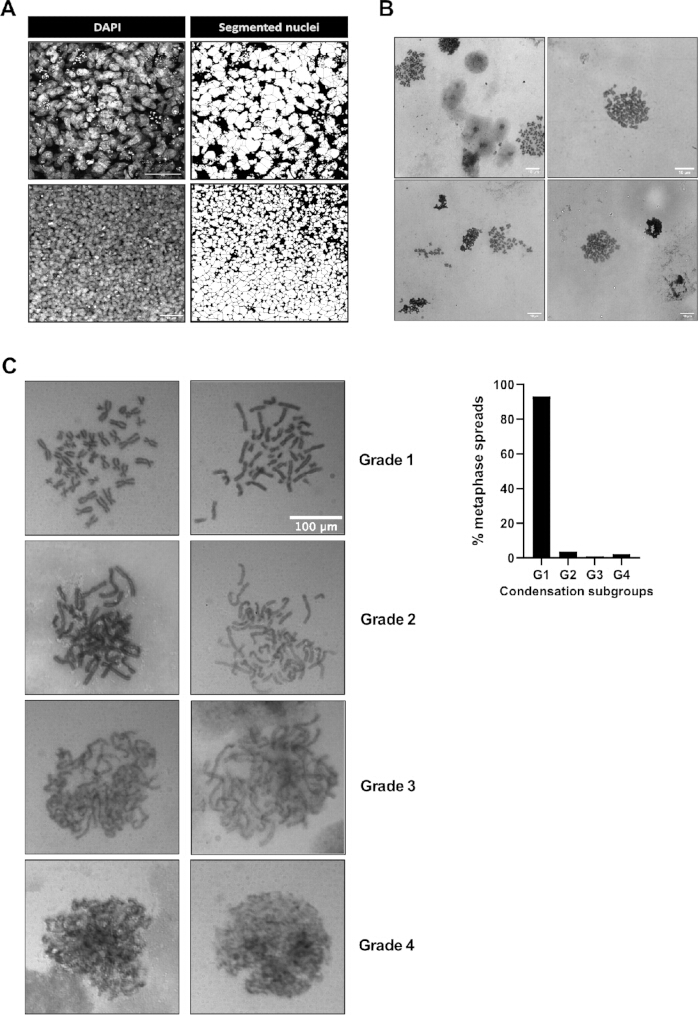
Figure 3: Troubleshooting and identification of suboptimal outcomes. (A) Representative unsuccessful nuclear segmentation of differentiated definitive endoderm cells. The high density and overlap of DAPI-positive nuclei caused adjacent nuclei to be merged into large objects in the segmentation, preventing reliable single-nucleus fluorescence quantification. Scale bar: 50 µm. (B) Representative suboptimal Giemsa-stained metaphase preparations showing clustered and overlapping chromosomes, incomplete chromosome spreading, and poorly separated metaphase spreads. These preparations were unsuitable for chromosome-number quantification because individual chromosomes could not be distinguished and counted confidently. Scale bar: 10 µm. (C) (Left) Representative metaphase spreads after Giemsa staining clustered in four groups (g1–g4) based on ascending condensation defects; (Right) Quantification of the left phenotypes (n = 1 independent biological replicate, with n > 100 metaphase spreads quantified). Scale bar: 100 µm. Please click here to view a larger version of this figure.
| Media Name | Basal Condition | Growth Factors & Inhibitors |
| SFM | Stem Flex supplemented with 1% P/S | - |
| PS | Advanced RPMI supplemented with 1X L-Glutamine and 1% P/S | 5 µM CHIR99021 |
| LM | Advanced RPMI supplemented with 1X L-Glutamine and 1% P/S | LM-A Media: |
| 6 µM CHIR99021 | ||
| 30 ng/ml Activin A | ||
| 20 ng/ml FGF2 | ||
| 100 nM PIK90 | ||
| 40 ng/ml BMP4 | ||
| LM-B Media: | ||
| 1 µM A8301 | ||
| 20 ng/ml BMP4 | ||
| 1 µM C59 | ||
| PM | Advanced RPMI supplemented with 1X L-Glutamine and 1% P/S | PM-A Media: |
| 4 µM CHIR99021 | ||
| 30 ng/ml Activin A | ||
| 20 ng/ml FGF2 | ||
| 100 nM PIK90 | ||
| PM-B Media: | ||
| 3 µM CHIR99021 | ||
| 1 µM A8301 | ||
| 20 ng/ml FGF2 | ||
| 250 nM LDN193189 | ||
| DE | Advanced RPMI supplemented with 1X L-Glutamine and 1% P/S | DE-A Media: |
| 2 µM CHIR99021 | ||
| 100 ng/ml Activin A | ||
| 50 nM PIK90 | ||
| DE-B Media: | ||
| 250 nM LDN193189 | ||
| 100 ng/ml Activin A | ||
| NE | E6 supplemented with 1X L-Glutamine and 1% P/S | 500 nM LDN193189 |
| 10 µM SB431542 |
Table 1: Media compositions used in this study for differentiation of hiPSCs into early embryonic lineages. The ingredients of the media for each early embryonic lineage, with the respective concentrations, are indicated in that table.
| Cell State | Core markers for cell fate validation |
| Primded pluripotency | OCT4, NANOG, SOX2, TRA-1-60, SSEA4, LIN28A, DNMT3B, CDH1 |
| Primitive streak (PS) | TBXT, MIXL1, EOMES, SNAI1, CDX2, GSC |
| Lateral mesoderm (LM) | HAND1, FOXF, ISL1, KDR/VEGFR2, GATA4 |
| Paraxial mesoderm (PM) | TBX6, MSGN1, MEOX1, PAX3, FOXC1 |
| Definitive endoderm (DE) | SOX17, FOXA2, CXCR4, GATA4, GATA6, HNF4A |
| Neuroectoderm (NE) | PAX6, SOX1, SOX2, NESTIN, OTX2, ZIC1, ZEB2 |
Table 2: Marker panels for validation of early human cell lineages. Early human embryonic lineages and their markers for cell fate validation are indicated in that table. The markers listed in this table are not necessarily restricted to a single lineage when considered individually. Cell identity should therefore be checked using the combined expression of multiple positive markers, together with loss of pluripotency-associated markers and, where necessary, the absence of markers associated with alternative lineages. Marker interpretation should also consider the differentiation stage and signaling conditions. For instance, CDX2 is listed as a primitive streak (PS) marker, but it is not unique to this developmental lineage. CDX2 is also expressed in nascent posterior (lateral) mesoderm, extraembryonic mesoderm, as well as in amnion and trophoblast-like cells, depending on the species and the developmental time and context.
| Compound | Concentration | Mechanism/Funciton | Cell Cycle Phase Affected |
| Aphidicolin | 50–200 nm | DNA polymerase inhibitor. It leads to slowed DNA synthesis and replication fork stalling. | S phase/early S phase |
| Hydroxyurea (HU) | 1 mM, 3 mM | Inhibits ribonucleotide reductase, reducing dNTP pools and slowing/stalling DNA replication forks. | S phase |
| Camptothecin (CPT) | 1 µM, 2.5 µM | Inhibits topoisomerase I by trapping Topoisomerase I–DNA cleavage complexes. Collision of replication forks with these trapped complexes converts the lesions into replication-associated DNA damage, including single-strand breaks (SSBs) and double-strand breaks (DSBs). | S phase |
| Reversine | 0.1 µM, 0.25 µM, 0.5 µM | ATP-competitive drug that binds to ATP pocket of monopolar spindle 1 kinase (MPS1) and thus inhibiting the spindle assembly checkpoint (SAC). Blockage of SAC causes improper chromosome missegregation and premature dividing which leads to aneuploidy. | Mitosis |
Table 3: Compounds used in this study to induce replication stress and DNA damage in hiPSCs. Compounds used for inducing DNA errors are listed alongside their brief respective mechanism, concentrations, and target cell cycle phases.
Supplementary Table 1: Primer sequences. The primer sequences used in this study are listed in this table. Please click here to download this file.
Supplementary File 1: hPSC culture and image analysis approach. The procedure to freeze, thaw, and passage hPSCs and the image analysis approaches are described here. Please click here to download this file.
المناقشة
This protocol combines two key aspects of the pluripotent stem cell field: the generation of early human post-implantation lineages and the evaluation of genome and chromosome integrity during culture. The first part provides a reproducible approach for differentiating hPSCs into primitive streak-like cells, mesodermal, definitive endodermal, and neuroectodermal lineages using chemically defined culture conditions and growth factors. The second part describes a set of established assays to monitor DNA damage, mitotic defects, micronuclei accumulation, and numerical aneuploidy. Together, these methods provide a reference for researchers seeking to recapitulate human development and differentiation in vitro, as well as for those investigating genome integrity mechanisms.
The differentiation methods explained in this article were adapted from previously published directed-differentiation methods and consolidated into a common experimental framework. Loh et al. (2016) generated distinct anterior and mid/posterior primitive-streak populations by varying TGFβ, WNT, FGF, BMP, and PI3K signaling in CDM2 basal medium6. In contrast, the present primitive-streak protocol uses a simplified 24 h CHIR99021 treatment in Advanced RPMI and generates a primitive-streak-like population without separately specifying anterior and mid/posterior primitive-streak identities. The subsequent lateral- and paraxial-mesoderm protocols retain the principal signaling combinations, and 48 h differentiation sequence described by Loh et al., but Advanced RPMI is used instead of CDM2 as the basal medium. Definitive-endoderm differentiation was adapted from the sequential signaling strategy of Loh et al. (2014)5 and Boon et al. (2020)28, in which initial Activin/Nodal and WNT pathway activation is followed by sustained Activin/Nodal signaling and BMP inhibition. This protocol preserves this three-day signaling sequence but uses Advanced RPMI rather than CDM2 as the basal medium and PIK90 rather than PI-103 for PI3K inhibition. Neuroectoderm differentiation closely follows the chemically defined E6-based dual-SMAD-inhibition approach of Tchieu et al. (2017) using LDN193189 and SB4315427, but is restricted to the generation and assessment of early neuroectoderm rather than the broader parallel derivation of multiple ectodermal lineages. A major advantage of performing these differentiation protocols in two-dimensional (2D) culture is their experimental accessibility and scalability. First, the generation of relatively homogeneous lineage populations under defined conditions sets the stage for studying subsequent stages of cell fate specification and maturation that occur during organogenesis, which is of considerable interest for regenerative medicine and cell therapy applications. Second, 2D lineage specification provides enough material for cost-effective, “in-depth” bulk omic analyses, such as ChIP-sequencing, RNA-sequencing, metabolomics, or proteomics, compared to more complex 3D stem cell embryo-like models. In this sense, the 2D is not meant to fully recapitulate the cellular complexity of the embryo, but it provides a practical, simple model to study lineages separately.
At the same time, this simplicity represents one of the main limitations. In vivo, early development occurs in a complex three-dimensional environment where cells receive spatially and temporally regulated signals from neighboring tissues. In the 2D system, this architecture and heterogeneity are largely lost. Therefore, although the protocol can efficiently generate cells expressing markers of specific lineages, it does not fully capture the spatial organization, morphogen gradients, mechanical forces, or cell-cell interactions present between the embryo lineages and their envelopes. Thus, the results should be interpreted as lineage-like generated in vitro, rather than as a complete model of the developing embryo.
The assays described in the second part provide a useful characterization of genomic and chromosomal stability in hPSCs. Co-localization of DNA damage markers, including γH2AX and phospho-RPA in EdU+ cells, identifies cells undergoing replicative stress in S-phase, which may subsequently give rise to ultrafine bridges (BLM+ DNA fibers) in the following mitosis. Chromosome missegregation, micronuclei accumulation, and Giemsa karyotype staining further establish a connection between genomic stress and chromosomal instability, even under standard pluripotent culture conditions. These assays are relatively accessible and can be performed using standard immunofluorescence, microscopy, and cytogenetic methods. Collectively, they provide practical tools for monitoring hPSC culture quality and evaluating mechanisms that regulate genome stability.
However, these assays also present important limitations. First, γH2AX and phospho-RPA are indirect markers of DNA damage and replication-stress response rather than direct measurements of DNA breaks. Consequently, basal γH2AX and phospho-RPA signals detected in untreated cells may not directly reflect the presence or number of DNA breaks and should be interpreted cautiously. Population-averaged fluorescence measurements may also obscure heterogeneous responses, as a modest signal distributed across many cells may differ biologically from strong and concentrated marker accumulation in a smaller subset of cells. These measurements should therefore be interpreted together with the single-cell signal distribution and staining pattern. Furthermore, the detection of single- or double-strand breaks does not reveal in which regions of the genome or loci they occur. This limitation can be addressed using higher-resolution approaches such as ChIP-sequencing of γH2AX or RPA binding, as well as emerging omics methods, including INDUCE-seq45, which enables genome-wide profiling of both physiological and aberrant DNA double-strand breaks. Second, most of the mitotic instability readouts described (UFBs, lagging chromosomes, micronuclei) rely on fixed-cell imaging and therefore provide only static snapshots of cellular phenotypes that may or may not ultimately result in chromosomal instability (CIN). Besides, these analyses are inherently susceptible to observer bias, as identification relies on manual assessment. To strengthen the link between these defects and CIN, live-cell confocal imaging using H2B-GFP hPSC lines or SiR-DNA/SPY-DNA labeling (Spyrochrome) can be employed for long-term tracking, mitotic dynamics, and the fate of those divisions, providing valuable insights into the consequences of chromosome missegregation and aneuploidy.
Third, although Giemsa karyotyping can determine changes in chromosome number, it has several technical limitations. Chromosome spreading during metaphase can result in chromosome loss or displacement, potentially introducing errors during manual chromosome counting. This may occur during the step in which the cell suspension is dropped onto the slide from a defined height using a strong aspiration pulse, as described in Section 7.2. This step represents an important technical trade-off, as sufficient mechanical force is required to disrupt the cells and allow visualization of the metaphase chromosomes, but excessive force may also result in chromosome displacement or loss. In the experiment, approximately 20% of cells in the control group were classified as aneuploid (Figure 2O). This relatively high frequency may, at least in part, reflect technical limitations associated with the chromosome-spreading procedure, although we cannot exclude the possibility of a biological contribution. Notably, previous analyses using more advanced approaches (single-cell whole-genome sequencing) applied to study the same cell line used here reported an aneuploidy rate of approximately 5%. Furthermore, this technique presents limited resolution and cannot identify smaller structural variants or the exact chromosome gains or losses, which can be overcome using chromosome painting or Karyo-FISH. Alternatively, recent single-cell genome sequencing approaches, including single-cell genome sequencing and single-cell-acoustic cell tagmentation sequencing46, enable high-throughput analysis of copy number variation across hundreds of individual cells and can additionally detect single-nucleotide variants when sequencing depth is sufficient. However, these methods are substantially more resource-intensive.
Overall, this protocol provides a practical and accessible set of tools for generating early developmental lineage-like cells and assessing genome instability in hPSC cultures. Nevertheless, integrating these approaches with advanced live-cell imaging and high-resolution sequencing technologies would provide a more comprehensive understanding of the origins, dynamics, and consequences of genome instability during hPSC maintenance and differentiation.
The assays described above detect genome instability at different stages of the cell cycle and should be selected according to the experimental question. EdU-associated γH2AX and phospho-RPA staining measure replication-associated DNA damage during S phase; analysis of BLM-positive ultrafine bridges detects unresolved replication intermediates persisting into anaphase; chromosome-missegregation and micronucleus analyses detect ongoing mitotic errors and their post-mitotic consequences; and Giemsa-stained metaphase spreads determine whether these defects have resulted in an abnormal chromosome number. These assays are therefore complementary rather than interchangeable and evaluate the integrity of the genomic blueprint across different checkpoints in the cell.
The γH2AX/phospho-RPA are primarily intended for mechanistic studies of replication stress and DNA damage. Single- and double-strand breaks are basal in untreated pluripotent conditions, but do not activate the ATR and ATM checkpoint responses that occur upon mild to severe damage or repair dysfunction. Thus, these approaches are more appropriate for researchers studying the role of critical replication, damage, or repair factors, as well as to understand exogenous responses of early lineages to replication stress21,47. However, they are not intended to be used as quality control of hPSC lines over long-term culture.
Chromosome-missegregation, ultrafine-bridge analysis and metaphase chromosome count are more suitable for routine surveillance. Chromosome-missegregation analysis provides an early functional readout of ongoing chromosomal instability, whereas Giemsa-stained metaphase spreads determine the proportion of cells with an abnormal chromosome number. Micronucleus analysis may provide a complementary and relatively accessible indicator of recent chromosome-misdivision or chromosome-breakage events, although it does not identify their origin and should not replace direct chromosome-number analysis. Additionally, live-cell imaging using SPY-DNA or similar non-invasive dye will reflect the ongoing chromosomal instability and the fate of those defective mitosis21,48. If resources allow, single-cell low-coverage whole-genome sequencing of a few dozen cells will reflect the ongoing chromosomal instability, while bulk g-DNA sequencing is not recommended unless you aim to capture specific aneuploid clones expanded after clonal advantage gain. Recently, our laboratory has demonstrated that long-term passaging of hPSCs increases ultrafine bridge formation, chromosome missegregation, and aneuploidy rates20. These findings highlight the risk of chromosomal instability during prolonged in vitro culture and support routine monitoring of chromosome-segregation fidelity and chromosome-number stability in hPSC cultures.
For hPSC lines maintained under stable culture conditions, it is recommended to assess chromosome-number stability at least twice per year, approximately every 6 months. Chromosome-missegregation analysis can be performed at the same interval as an additional measure of ongoing chromosomal instability. Additional testing should be performed after extended passaging, recovery from cryostorage, substantial changes in culture medium, matrix, or passaging procedure, unexpected alterations in growth or morphology, and before initiating prolonged or resource-intensive differentiation experiments. Genome-integrity testing should also be performed before establishing new working cell stocks and before using cells in studies requiring high genomic stability. Besides, it is recommended to expand early passage hPSCs and not use them for more than 10 passages, as they acquire chromosomal instability.
الإفصاحات
The authors declare no conflicts of interest related to this work. Artificial intelligence (AI) was not used to generate figures or draft any part of the manuscript. AI was used solely as a support tool to review the literature and references and to provide an independent assessment of the manuscript’s structure after it had been written.
شكر وتقدير
The authors would like to acknowledge the support and help of the LiMiF microscopy facility on cellular imaging. G.V. holds a Belgian PhD scholarship from the Belgian Kids Fund (BKF). This work has been financed with the support of Actions Blanches 2024 ULB grant and the Mandat d’Impulsion Scientifique Ulysse (MISU) from the FNRS (project number MISU F.6002.26), both held by A.d.J.S. The authors acknowledge the use of BioRender to generate the figures in this article, under an active license.
المواد
| الاسم | الشركة | رقم فهرسي | التعليقات |
|---|---|---|---|
| 15 mL Conical tubes | Falcon | 352096 | Used for cell collection, washing, centrifugation, and reagent preparation. |
| 15 mm glass coverslips | ThermoFisher Scientific | 174969 | Used for plating hPSCs prior to immunofluorescence staining; one coverslip per condition. |
| 50 mL Conical tubes | Falcon | 252070 | Used for cell collection, washing, centrifugation, and reagent preparation. |
| 96-well qPCR plates | Axygen | PCR-96-FLT-C | Used for qPCR reactions in 96-well format. Samples and genes are loaded in technical triplicates. |
| A8301 | Selleckchem | S7692 | TGFβ pathway inhibitor used in lateral mesoderm (LM) differentiation. |
| Acetic Acid | VWR | 20104.298 | Used for Carnoy's fixative solution. |
| Activin A | PeproTech/ ThermoFisher Scientific | 120-14-10UG | Growth factor used in primitive streak (PS), lateral mesoderm (LM), paraxial mesoderm (PM) and definitive endoderm (DE) differentiation. |
| Advanced RPMI medium | Gibco | 12633012 | Basal medium for primitive streak (PS), lateral mesoderm (LM), paraxial mesoderm (PM) and definitive endoderm (DE) differentiation. |
| Anti-Blooms Syndrome Protein Blm antibody | Abcam | ab2179 | Primary antibody used to detect BLM-positive ultrafine bridges during anaphase. Specie: Rabbit |
| Anti-Brachyury / Bry antibody [EPR18113] | Abcam | ab209665 | Primary antibody used to detect primitive streak (PS) marker. Specie: Rabbit |
| Anti-Centromere Protein Antibody | Antibodies Inc. | 15-234 | Primary antibody used to label centromeres/kinetochores during chromosome segregation analysis. Specie: Human |
| Anti-Lamin B1 antibody | Abcam | ab229025 | Primary antibody used to label nuclear lamina and Lamin B1-positive micronuclei. Specie: Rabbit |
| Anti-PAX6 antibody | Cell Signaling Technology | 60433 | Primary antibody used to detect neuroectoderm (NE) identity marker. Specie:Rabbit |
| Anti-phospho-Histone H2A.X (Ser139) Antibody, clone JBW301 | Sigma-Aldrich | 05-636-I | Primary antibody used to detect DNA damage/double-strand break-associated signaling in EdU-positive S-phase nuclei. Specie: Mouse |
| Anti-RPA32/RPA2 (phospho S4 + S8) antibody | Abcam | ab87277 | Primary antibody used to detect replication stress and ssDNA accumulation in S-phase nuclei. Specie: Rabbit |
| Anti-SOX17 antibody [EPR20684] | Abcam | ab224637 | Primary antibody used to detect definitive endoderm (DE) marker. Specie: Rabbit |
| Anti-TUBA4A (TUBA1) Antibody | Sigma-Aldrich | T9026 | Primary antibody used to label microtubules/mitotic spindle during chromosome missegregation analysis. Specie:Mouse |
| Aphidicolin | Santa Cruz Biotechnology | sc-201535 | Used for inducing replication stress and ultrafine bridges during mitosis. |
| Benchtop centrifuge | VWR | 521-2161 | Used for pelleting cells during thawing, passaging, and sample preparation. |
| Biological safety cabinet / laminar flow hood | Esco Lifesciences | AC2-4K8 | Used for sterile handling of hPSCs, media preparation, well plate-coating, passaging, and differentiation setup. |
| BMP4 | Proteintech (SanBio) | HZ-1045 | Growth factor used for lateral mesoderm (LM) differentiation. |
| C59 | Abcam | ab142216 | PORCN/WNT secretion inhibitor used in lateral mesoderm (LM) differentiation. |
| Camptothecin (CPT) | Selleckchem | S1288 | Used for inducing the single-stranded DNA breaks in cells. |
| Cell culture plates 12-well | SARSTEDT | 83.3921 | Used for directed differentiation of hPSCs into early embryonic lineages. |
| Cell culture plates, 6-well | SARSTEDT | 83.3920 | Used for routine hPSC maintenance and expansion before differentiation. |
| CHIR99021 | Sigma-Aldrich | SML1046 | GSK3 inhibitor/WNT pathway activator. Used in primitive streak (PS), lateral mesoderm (LM), paraxial mesoderm (PM) and definitive endoderm (DE) differentiation. |
| CO2 incubator | Heraeus | HeraCell 150 | Used to culture hPSCs and differentiated lineages at 37 °C and 5% CO2. |
| Cryovial freezing container / controlled-rate freezing container | ThermoFisher Scientific | 1535050 | Used to gradually freeze cells at -80 °C before transfer to liquid nitrogen. |
| Cryovials | Greiner | 122263 | Used for storing the cells at liquid nitrogen. |
| DAPI | Sigma-Aldrich | D9542 | Nuclear counterstain used in all immunofluorescence experiments. |
| DMSO | MedChem Express | HY-Y0320C | Cryoprotectant used in hPSC freezing medium to protect cells during cryopreservation. Also used as solvent for some small-molecule compounds where applicable. |
| Donkey anti-goat Alexa Fluor 546 | ThermoFisher Scientific | A11056 | Secondary antibody used to detect goat primary antibodies. |
| Donkey anti-mouse Alexa Fluor 488 | ThermoFisher Scientific | A21202 | Secondary antibody used to detect mouse primary antibodies. |
| Donkey anti-rabbit Alexa Fluor 594 | ThermoFisher Scientific | A21207 | Secondary antibody used to detect rabbit primary antibodies. |
| Goat anti-rabbit Alexa Fluor 647 | ThermoFisher Scientific | A21244 | Secondary antibody used to detect rabbit primary antibodies. |
| DPBS/PBS | Gibco | 14190144 | Used for washing cells during culture/passaging/fixating/permeabilization solutions. |
| EDTA | Invitrogen | AM9260G | Used for dissociation of the hPSCs before seeding or passaging to differentiation cultures. |
| EdU detection reagent / Click-iT EdU kit | Invitrogen | C10337 | Used to detect EdU incorporation and identify S-phase cells in DNA damage assays. |
| Essential 6 (E6) medium | Gibco | A1516401 | Basal medium for neuroectoderm (NE) differentiation. |
| Ethanol, 95–100% | VWR | 20821.296 | Added to RNA Wash Buffer concentrate and to RNA lysate/flow-through during RNA extraction. |
| Euparal | Carl Roth | 7356.1 | Resin mounting medium that used for mounting and preservation of Giemsa stained coverslips. |
| FBS | Gibco | 10270106 | Component of cryopreservation medium for freezing hPSCs. |
| FGF2 | PeproTech/ThermoFisher Scientific | 100-18C-50UG | Growth factor used for lateral and paraxial mesoderm (LM/PM) differentiation. |
| Fluorescence microscope | Carl Zeiss AG | Axio Imager.Z2 | Used for routine immunofluorescence imaging and screening of stained samples. |
| Fluoromount Aqueous Mounting Medium | Sigma-Aldrich | F4680-25ML | Used to mount coverslips on glass slides; examples include ProLong Gold or Fluoromount. Approximately 13 µL per coverslip. |
| Giemsa Stain | Sigma-Aldrich | 10092013 | Used to visualize the chromosomes during metaphase of the mitosis. |
| Glass microscope slides | VWR | 631-0147 | Used to mount coverslips after immunostaining. |
| HAND1 antibody | R&D Systems | AF3168 | Primary antibody used to detect lateral mesoderm identity marker. Specie: Goat |
| Horizontal shaker / orbital shaker | Grant Instruments | PS-M3D | Used for washes and incubations with gentle horizontal oscillation. |
| Horse serum | Gibco | 16050130 | Used in blocking buffer; final concentration 2% horse serum. |
| Human recombinant vitronectin (rhVTN) | Gibco | A31804 | Plate coating reagent; use at 5 µg/mL. |
| Human TBX6 Antibody | R&D Systems | AF4744 | Primary antibody used to detect paraxial mesoderm identity marker. Specie: Goat |
| Hydroxyurea (HU) 98% powder | Sigma-Aldrich | H8627-1G | Used to induce replication stress and DNA damage in hPSCs. |
| Immersion oil | Carl Zeiss AG | 000000-0360-890 | Used with the 63x oil objective for confocal imaging. |
| Inverted phase-contrast microscope | Leica | DM IL | Used to monitor hPSC colony morphology, confluency, attachment, and differentiation quality during culture. |
| iScript cDNA Synthesis Kit | Bio-Rad Laboratories | 1708891 | Used for reverse transcription of RNA into cDNA. |
| iTaq Universal SYBR Green Supermix | Bio-Rad Laboratories | 1725121 | Used for qPCR amplification and detection of gene expression using SYBR Green chemistry. |
| LDN | Selleckchem | S2618 | BMP pathway inhibitor used in paraxial mesoderm (PM), definitive endoderm (DE) and neuroectoderm (NE) differentiation media. |
| LSM confocal microscope | Carl Zeiss AG | LSM780 | Used for high-resolution confocal imaging of immunofluorescence samples. Images are acquired using oil-immersion objectives when indicated. |
| Methanol | VWR | BDH92498.320 | Used for Carnoy's fixative solution. |
| Micropipette Tips | VWR | NC2024380, 613-6435, 613-6434 | Used for media preparation, reagent addition, cell handling, and qPCR/IF sample preparation. |
| Microseal “B” Foil Seals | Bio-Rad Laboratories | MSB1001B | Used to seal 96-well qPCR plates before centrifugation and amplification. |
| Nanodrop Eight spectrophotometer | Thermo Fisher Scientific | NDE-GL | Used to quantify total RNA concentration before cDNA synthesis. |
| Nocodazole | Selleckchem | S2775 | Used for arresting the cells during mitosis. |
| Nuclease-free tubes | Thermo Fisher Scientific | AM12400 | Used for RNA collection, DNase preparation, and sample handling during RNA extraction. |
| Oct3/4 antibody (C-10) | Santa Cruz Biotechnology | sc-5279 | Primary antibody used to detect pluripotency marker OCT4 in hPSCs and differentiated lineages. Specie: Mouse |
| Paraformaldehyde (PFA) | Sigma-Aldrich | 158127-100G | Used for cell fixation in immunofluorescence workflows. |
| PCR tubes, 0.2 mL | Invitrogen | AM12225 | Used for cDNA synthesis reactions. |
| Penicilin/Streptomycin | Gibco | 15140122 | Antibiotic solution used in culture media to reduce bacterial contamination during hPSC maintenance and differentiation. |
| PIK90 | Selleckchem | S1187 | Small-molecule inhibitor used in lateral mesoderm (LM), paraxial mesoderm (PM) and definitive endoderm (DE) induction media; block the downstream phosphorylation of AKT. |
| Pipettes / micropipettes | Eppendorf | 05-403-151 | Used for media preparation, reagent addition, cell handling, and qPCR/IF sample preparation. |
| Plate centrifuge | Eppendorf | 12894952 | Used to briefly spin down sealed qPCR plates before loading into the qPCR machine. |
| qTower qPCR machine | Analytik Jena | qTower3 | Used to perform real-time qPCR with FAM/SYBR detection. Program: 95 °C for 3 min, then 40 cycles of 95 °C for 5 s and 60 °C for 30 s, followed by melting curve analysis. |
| Quick-RNA Miniprep Kit | Zymo Research | R1055 | Used to isolate total RNA from the samples. |
| Reversine | Sigma-Aldrich | R3904-1MG | Used to induce chromosome missegregation during mitosis. |
| ROCK inhibitor Y-27632 | STEMCELL TECHNOLOGIES | 72304 | Used during first 24 h after hPSC seeding to support survival; remove at next medium change. |
| SB431542 | MedChem Express | HY-10431 | TGFβ/Activin/Nodal pathway inhibitor used in neuroectoderm (NE) differentiation. |
| Serological pipettes | VWR | 734-0352, 612-3698, 734-0350 | Used for cell culture media handling, washing, and cell transfer. |
| StemFlex medium | Gibco | A3349401 | Basal medium for hPSC maintenance and initial culture after seeding before lineage induction. |
| Sterile ddH2O | Qiagen | 129115 | Used to wash coverslips after ethanol sterilization. |
| Thermal cycler | Applied Biosystems | 4375305 | Used for cDNA synthesis with the following program: 25 °C for 5 min, 46 °C for 20 min, 95 °C for 1 min, hold at 4 °C. |
| Triton X-100 | Sigma-Aldrich | T8787 | Detergent used for permeabilization and blocking solutions; concentrations vary by assay (0.5% for permeabilization and 0.1% in blocking solution). |
| Water bath | Grant Instruments | NC1808978 | Used to thaw frozen hPSC vials rapidly at 37 °C. |
المراجع
- Thomson JA, et al. Embryonic stem cell lines derived from human blastocysts. Science. 1998;282(5391):1145–7.
- Takahashi K, et al. Induction of pluripotent stem cells from adult human fibroblasts by defined factors. Cell. 2007;131(5):861–72.
- Rossant J. Mouse and human blastocyst-derived stem cells: vive les différences. Development. 2015;142(1):9–12.
- Molè MA, Weberling A, Zernicka-Goetz M. Comparative analysis of human and mouse development: from zygote to pre-gastrulation. Curr Top Dev Biol. 2020;136:113–38.
- Loh KM, et al. Efficient endoderm induction from human pluripotent stem cells by logically directing signals controlling lineage bifurcations. Cell Stem Cell. 2014;14(2):237–52.
- Loh KM, et al. Mapping the pairwise choices leading from pluripotency to human bone, heart, and other mesoderm cell types. Cell. 2016;166(2):451–67.
- Tchieu J, et al. A modular platform for differentiation of human PSCs into all major ectodermal lineages. Cell Stem Cell. 2017;21(3):399–410.e7.
- Moghe P, et al. Coupling of cell shape, matrix and tissue dynamics ensures embryonic patterning robustness. Nat Cell Biol. 2025;27(3):408–23.
- Rossant J, Tam PPL. Opportunities and challenges with stem cell-based embryo models. Stem Cell Reports. 2021;16(5):1031–8.
- Oldak B, et al. Complete human day 14 post-implantation embryo models from naive ES cells. Nature. 2023;622(7983):562–73.
- Fu J, Warmflash A, Lutolf MP. Stem-cell-based embryo models for fundamental research and translation. Nat Mater. 2021;20(2):132–44.
- Niehrs C. The Spemann organizer and embryonic head induction. EMBO J. 2001;20(4):631–7.
- Sasai Y, Lu B, Steinbeisser H, De Robertis EM. Regulation of neural induction by the Chd and Bmp-4 antagonistic patterning signals in Xenopus. Nature. 1995;378(6555):419–22.
- Rossant J, Tam PPL. Emerging asymmetry and embryonic patterning in early mouse development. Dev Cell. 2004;7(2):155–64.
- Steventon B, et al. Differential requirements of BMP and Wnt signalling during gastrulation and neurulation define two steps in neural crest induction. Development. 2009;136(5):771–9.
- Morgani SM, Hadjantonakis AK. Signaling regulation during gastrulation: insights from mouse embryos and in vitro systems. Curr Top Dev Biol. 2020;137:391–431.
- Sasai Y, De Robertis EM. Ectodermal patterning in vertebrate embryos. Dev Biol. 1997;182(1):5–20.
- Takata N, Sakakura E, Eiraku M, Kasukawa T, Sasai Y. Self-patterning of rostral-caudal neuroectoderm requires dual role of Fgf signaling for localized Wnt antagonism. Nat Commun. 2017;8:12501.
- Watanabe K, et al. Directed differentiation of telencephalic precursors from embryonic stem cells. Nat Neurosci. 2005;8(3):288–96.
- de Jaime-Soguero A, et al. Long-term prevention of aneuploidy in human pluripotent stem cells by fine-tuning GSK3 activity. bioRxiv. 2025:2025.10.27.684724. Available from: https://doi.org/10.1101/2025.10.27.684724
- de Jaime-Soguero A, et al. Developmental signals control chromosome segregation fidelity during pluripotency and neurogenesis by modulating replicative stress. Nat Commun. 2024;15(1):634.
- Lamm N, et al. Genomic instability in human pluripotent stem cells arises from replicative stress and chromosome condensation defects. Cell Stem Cell. 2016;18(2):253–61.
- Na J, et al. Aneuploidy in pluripotent stem cells and implications for cancerous transformation. Protein Cell. 2014;5(8):569–79.
- Jacobs K, et al. Higher-density culture in human embryonic stem cells results in DNA damage and genome instability. Stem Cell Reports. 2016;6(3):330–41.
- Acebrón SP, Hattemer J, Rausch T, De Jaime-Soguero A. Morphogen gradients as drivers of mosaicism during early human development. BioEssays. 2026;48:e70128.
- Bufe A, et al. Wnt signaling recruits KIF2A to the spindle to ensure chromosome congression and alignment during mitosis. Cell Death Discov. 2021;7(1):263.
- Lam AQ, et al. Rapid and efficient differentiation of human pluripotent stem cells into intermediate mesoderm that forms tubules expressing kidney proximal tubular markers. J Am Soc Nephrol. 2014;25(6):1211–25.
- Boon R, et al. Amino acid levels determine metabolism and CYP450 function of hepatocytes and hepatoma cell lines. Nat Commun. 2020;11(1):1393.
- Ben-David U, et al. Aneuploidy induces profound changes in gene expression, proliferation and tumorigenicity of human pluripotent stem cells. Nat Commun. 2014;5:4825.
- Ben-David U, Amon A. Context is everything: aneuploidy in cancer. Nat Rev Genet. 2020;21(1):44–62.
- Krivec N, et al. Gain of 1q confers an MDM4-driven growth advantage to undifferentiated and differentiating hESC while altering their differentiation capacity. Cell Death Dis. 2024;15(11):852.
- Zhang M, et al. Aneuploid embryonic stem cells exhibit impaired differentiation and increased neoplastic potential. EMBO J. 2016;35(21):2285–300.
- Su J, et al. Genomic integrity safeguards self-renewal in embryonic stem cells. Cell Rep. 2019;28(6):1400–9.e4.
- Devalle S, et al. Implications of aneuploidy for stem cell biology and brain therapeutics. Front Cell Neurosci. 2012;6:20.
- Kurashima K, Kamikawa Y, Tsubouchi T. Embryonic stem cells maintain high origin activity and slow forks to coordinate replication with cell cycle progression. EMBO Rep. 2024;25(8):3757–76.
- Matson JP, et al. Rapid DNA replication origin licensing protects stem cell pluripotency. eLife. 2017;6:e30473.
- Böhly N, Kistner M, Bastians H. Mild replication stress causes aneuploidy by deregulating microtubule dynamics in mitosis. Cell Cycle. 2019;18(20):2770–83.
- Sofueva S, et al. Ultrafine anaphase bridges, broken DNA and illegitimate recombination induced by a replication fork barrier. Nucleic Acids Res. 2011;39(15):6568–84.
- Chan KL, North PS, Hickson ID. BLM is required for faithful chromosome segregation and its localization defines a class of ultrafine anaphase bridges. EMBO J. 2007;26(14):3397–409.
- Fenech M, et al. Micronuclei as biomarkers of DNA damage, aneuploidy, inducers of chromosomal hypermutation and as sources of pro-inflammatory DNA in humans. Mutat Res Rev Mutat Res. 2020;786:108342.
- MacKenzie KJ, et al. cGAS surveillance of micronuclei links genome instability to innate immunity. Nature. 2017;548(7668):461–5.
- Berg S, et al. ilastik: interactive machine learning for (bio)image analysis. Nat Methods. 2019;16(12):1226–32.
- Stringer C, Wang T, Michaelos M, Pachitariu M. Cellpose: a generalist algorithm for cellular segmentation. Nat Methods. 2021;18(1):100–6.
- Shahbazi MN, Pasque V. Early human development and stem cell-based human embryo models. Cell Stem Cell. 2024;31(10):1398–418.
- Dobbs FM, et al. Precision digital mapping of endogenous and induced genomic DNA breaks by INDUCE-seq. Nat Commun. 2022;13(1):3989.
- Minussi DC, et al. Breast tumours maintain a reservoir of subclonal diversity during expansion. Nature. 2021;592(7852):302–8.
- Kafer GR, et al. Replication stress tolerance and management differs between naïve and primed pluripotent cells. bioRxiv. 2022:2022.05.12.491744.
- Deng C, Ya A, Compton DA, Godek KM. A pluripotent developmental state confers a low fidelity of chromosome segregation. Stem Cell Reports. 2023;18(2):475–88.
إعادة الطباعة والأذونات
تم نشر هذه المقالة
الفيديو قريباً