This retrospective controlled study compared desloratadine monotherapy with desloratadine plus montelukast in 360 children with allergic rhinitis. Combination therapy was associated with greater symptom improvement, faster clinical response, and larger reductions in inflammatory markers, while safety conclusions remained limited by the small number of adverse events.
مقالة بحثية
Combination Therapy of Montelukast and Desloratadine in Pediatric Allergic Rhinitis: Effects on Symptoms and Inflammatory Markers
في هذه المقالة
ملخص
الملخص
This retrospective, controlled study evaluated the clinical outcomes of montelukast sodium combined with desloratadine syrup in pediatric patients with allergic rhinitis. Medical records from 360 children aged 6–12 years treated between October 2021 and November 2024 were reviewed. Patients were classified according to documented treatment as desloratadine monotherapy (Group A, n = 180) or desloratadine plus montelukast (Group B, n = 180). During the 4-week treatment period, Total Nasal Symptom Score (TNSS), Total Non-Nasal Symptom Score (TNNSS), time to symptom improvement, serum immunoglobulin E (IgE), interleukin-13 (IL-13), eosinophil counts, and adverse events were assessed. Group B had lower post-treatment TNSS (4.65 ± 2.12 vs 5.32 ± 2.09, p = 0.003) and TNNSS (1.96 ± 1.43 vs 2.48 ± 1.01, p < 0.001), and rhinorrhea improved sooner (10.38 ± 1.87 vs 13.48 ± 1.20 days, p < 0.001). Greater reductions were also observed in inflammatory markers, including IgE and IL-13 (90.36 ± 22.58 vs 102.78 ± 19.25 ng/L, p < 0.001). Adverse-event rates did not differ significantly (0.56% vs 1.67%; Fisher’s exact test, p = 0.623), although only four events were recorded. These findings indicate that combination therapy was associated with greater improvements in clinical symptoms and inflammatory markers than desloratadine monotherapy; however, the retrospective, nonrandomized design and limited safety events require cautious interpretation.
المقدمة
Allergic rhinitis (AR) is one of the most common chronic allergic diseases in children and imposes a substantial burden on sleep, school performance, daily functioning, and quality of life1,2. Recent epidemiological evidence demonstrates considerable geographic variability in pediatric AR prevalence and confirms that the disease remains an important global health problem throughout childhood1. Persistent or inadequately controlled AR can impose a considerable burden on daily functioning and quality of life. Previous clinical studies have shown that desloratadine can improve symptom severity and quality-of-life outcomes in patients with intermittent or persistent allergic rhinitis3,4. In addition, the clinical and quality-of-life benefits associated with second-generation antihistamines and leukotriene receptor antagonists, such as montelukast, have been evaluated in populations with allergic rhinitis5,6. These findings support continued efforts to optimize pharmacological management and to identify treatment strategies that provide effective symptom control while accounting for individual disease characteristics and treatment response.
Current evidence supports a stepwise and individualized approach to pediatric AR management. Second-generation antihistamines remain useful for controlling histamine-mediated symptoms such as sneezing, nasal pruritus, and rhinorrhea, whereas intranasal corticosteroids are central to the management of persistent or moderate-to-severe disease7,8,9,10,11. Montelukast may provide symptom relief in selected patients; however, contemporary practice parameters recommend a more selective role for leukotriene receptor antagonists, particularly when alternative therapies are insufficient or not tolerated8,9. Recent international guidance further emphasizes treatment selection based on symptom patterns, disease severity, treatment response, and patient-specific considerations9,10,11.
Recent systematic reviews and meta-analyses have shown that montelukast-antihistamine combination therapy may improve nasal symptoms compared with antihistamine monotherapy, although the magnitude of benefit varies across individual outcomes and antihistamine agents12,13,14. Thus, the purpose of the present study was not simply to re-evaluate the overall effectiveness of this combination strategy. Rather, pediatric evidence remains limited regarding the concurrent assessment of different dimensions of treatment response within the same clinical cohort. Accordingly, the present study simultaneously evaluated nasal symptom burden (TNSS), non-nasal symptom burden (TNNSS), diary-derived time to improvement of individual nasal symptoms, and changes in systemic inflammatory markers, including IgE, eosinophil counts, and IL-13, in children receiving desloratadine alone or desloratadine plus montelukast. By integrating symptom severity, response kinetics, and inflammatory changes in a single pediatric cohort, this study provides complementary clinical evidence beyond evaluations that focus primarily on overall symptom improvement.
البروتوكول
The study was approved by the Ethics Committee of The First Hospital of Putian (Approval No. 24EKLCYWGY02) and was conducted in accordance with the Declaration of Helsinki. Written informed consent was obtained from the legal guardians of all participants. Because this was a retrospective observational study rather than a prospective clinical trial, prospective randomization, allocation concealment, blinding, and clinical trial registration were not applicable.
Identification and screening of eligible medical records
Pediatric AR records were identified from the institutional medical record system for the period October 1, 2021, through November 30, 2024. The predefined study interval was applied consistently for all screening and data extraction. The inclusion criteria were age 6–12 years; AR diagnosed according to the Chinese Guidelines for the Diagnosis and Management of Pediatric Allergic Rhinitis; typical symptoms occurring on ≥4 days/week plus serum-specific IgE positivity or a positive skin prick test; symptoms persisting for ≥3 months; no systemic antiallergic therapy within the preceding month; pre-treatment TNSS ≥6; and baseline FEV1/FVC within 80%–120% of predicted values. The exclusion criteria were nasal polyps, deviated nasal septum, chronic rhinosinusitis, immunodeficiency, acute asthma exacerbation, hepatic or renal dysfunction, cardiovascular disease, malignancy, recent corticosteroid/antihistamine/leukotriene receptor antagonist/immunomodulator use within 4 weeks before treatment initiation, hypersensitivity to the study drugs, insufficient medical-record documentation to ascertain treatment exposure or the predefined outcome measures, or psychiatric/cognitive impairment that prevented reliable outcome assessment. The screening process and reasons for exclusion were documented. All consecutive pediatric AR records identified during the predefined study period were screened according to the prespecified eligibility criteria. No random sampling, case selection, or restriction based on treatment-group size was applied. In total, 428 records were assessed, 68 were excluded according to the predefined criteria, and all 360 eligible records were retained for analysis (Supplementary Figure 1).
Supplementary Figure 1: Flow diagram of patient selection and group classification. The diagram shows the consecutive identification of medical records, eligibility screening, exclusion reasons, treatment-based classification without sampling or matching, follow-up record assessment, and the final inclusion of 180 patients per group.Please click here to download this file.
Treatment groups and baseline characteristics
Eligible records were classified according to the treatment regimen documented in the medical record. No matching, propensity score matching, random sampling, or other procedure was used to equalize group sizes. Among the 360 consecutive eligible records, 180 documented desloratadine monotherapy and were classified as Group A, whereas 180 documented desloratadine plus montelukast and were classified as Group B. Thus, the equal group size occurred naturally after application of the predefined eligibility criteria rather than through investigator-directed sampling or matching. Random sequence generation and allocation concealment were not performed because treatment exposure had already occurred in routine clinical practice prior to the retrospective record review. Sex, age, disease duration, family history of allergy, food allergy, AR severity and type, allergen sensitization profile, stable asthma, atopic dermatitis, and baseline pulmonary-function indices were extracted. Allergen sensitization was determined from serum-specific IgE and/or skin prick testing recorded at the initial visit. Pulmonary function data were retained only as baseline eligibility information and were not interpreted as treatment efficacy outcomes in this analysis.
Treatment exposure, follow-up documentation, and adherence
For Group A, the documented course of desloratadine syrup at 5 mg/day orally, administered once daily in the morning for 4 weeks, was extracted. For Group B, the documented course of desloratadine syrup at 5 mg/day orally, plus montelukast sodium chewable tablets at 5 mg once daily at bedtime for 4 weeks, was extracted. All children in Group B were 6–12 years of age and received the same 5 mg dose of montelukast; therefore, no within-group dose stratification was applied. Routine care, daily symptom diaries, and weekly follow-up records were reviewed to determine symptom scores, time to symptom improvement, treatment adherence, and adverse events. Treatment adherence was calculated as the number of documented doses taken, divided by the number of prescribed doses, multiplied by 100%. Treatment discontinuation was specifically reviewed during data extraction. Premature discontinuation because of adverse events, intolerance, or lack of efficacy was not, by itself, considered an exclusion criterion if sufficient subsequent follow-up and outcome documentation were available. In the final cohort, no treatment discontinuations attributable to adverse events, intolerance, or lack of efficacy were documented in either group. Follow-up records covering an additional 4 weeks after treatment completion were reviewed, including visits documented at weeks 2 and 4. Concomitant corticosteroids, other antihistamines, immunomodulators, and Chinese herbal antiallergic preparations were excluded during the treatment interval. Isotonic saline nasal irrigation up to twice daily at approximately 37 °C was permitted when documented.
Symptom outcomes
TNSS values at baseline and after treatment were extracted. Rhinorrhea, nasal pruritus, sneezing, and nasal congestion were scored from 0 (absent) to 3 (severe), yielding a total score of 0–12. Rhinorrhea was scored as 0, absent; 1, mild with occasional wiping; 2, moderate with frequent wiping but no functional impairment; and 3, severe continuous discharge interfering with activities. The same 0–3 severity structure was applied to nasal pruritus, sneezing, and nasal congestion according to the predefined clinical criteria. TNNSS values at baseline and after treatment were also extracted. Ocular symptoms (pruritus/lacrimation), headache, and cough were scored from 0 to 3, yielding a total score of 0–9. Time to symptom improvement was determined from the routine daily diary. For rhinorrhea, nasal pruritus, nasal congestion, and sneezing, improvement was defined as the first day on which symptom severity decreased by ≥50% from baseline. Diary entries were verified against the weekly follow-up record. The predefined observation window for this endpoint was the 28-day treatment period. All patients in both groups met the ≥50% improvement threshold for each of the four nasal symptoms during this period; therefore, no observations were censored in the time-to-improvement analyses.
Inflammatory biomarker data
Fasting venous blood collection records obtained before and after treatment were extracted. According to the source clinical protocol, 3–5 mL of venous blood was collected at each assessment. Serum samples used for IgE and IL-13 measurements were separated by centrifugation at 3,000 x g for 10 min. Serum IgE was quantified using an ELISA-based assay, and serum IL-13 was measured using a Human IL-13 ELISA Kit according to the manufacturer’s instructions. ELISA absorbance was read using a Multiskan FC Microplate Photometer. Peripheral eosinophil (EOS) counts were obtained from routine hematology testing using an XN-1000 Automated Hematology Analyzer. For this retrospective analysis, the corresponding laboratory values were extracted and retained as recorded in the medical records.
Adverse-event and neuropsychiatric safety data
Weekly follow-up notes and caregiver-reported documentation were reviewed for treatment-emergent adverse events, including somnolence, headache, nausea/vomiting, and diarrhea. A targeted retrospective review of available records was performed for sleep, behavioral, and neuropsychiatric symptoms potentially relevant to montelukast exposure, including insomnia, nightmares or abnormal dreams, irritability, agitation, anxiety, mood or behavioral changes, suicidal ideation, and self-harm. The records were also reviewed to determine whether a dedicated prospective neuropsychiatric rating scale had been used. In this retrospective cohort, no such standardized prospective scale was administered; therefore, the absence of documentation was interpreted with caution.
Statistical analysis
Data were analyzed using SPSS Statistics version 26.0. Continuous-variable distributions were assessed using the Shapiro-Wilk test and Q-Q plots, and homogeneity of variance was assessed using Levene’s test. Normally distributed continuous data were expressed as mean ± SD. Independent-samples t-tests were used for continuous variables measured at a single time point, including baseline variables and time to symptom improvement. Because all participants achieved the predefined symptom-improvement endpoint within the observation window and no censored observations were present, time to symptom improvement was analyzed as an observed continuous variable rather than using a censored time-to-event method. For TNSS, TNNSS, IgE, EOS count, and IL-13 measured before and after treatment, a two-way repeated-measures ANOVA was performed with group as the between-subjects factor and time as the within-subjects factor. Group, time, and group × time interaction effects were reported with F statistics, P values, and partial η². With two time points, the sphericity assumption was inherently satisfied. Bonferroni adjustment was applied for pairwise comparisons, and mean differences were reported with 95% confidence intervals and Cohen’s d for key between-group comparisons. Categorical variables were presented as n (%) and compared using the Pearson chi-square test; Fisher’s exact test was used when expected cell counts were <5. Two-sided tests were used, and p < 0.05 was defined as statistically significant. Because the study was retrospective and nonrandomized, an intention-to-treat analysis was not performed. No missing-data imputation was required because all analyzed records contained complete outcome data.
النتائج
Baseline characteristics
The final cohort included 360 children, with 180 records in each treatment group. No statistically significant differences were observed in sex distribution, age, disease duration, family history of allergy, food allergy, AR severity, allergen sensitization profiles, stable asthma, or atopic dermatitis (all p > 0.05, Table 1). Age and disease duration were comparable between the two treatment groups (Figure 1). All patients met the predefined criteria for persistent AR. Baseline pulmonary function was within the predefined normal range in both groups, with no significant between-group differences in FEV1 (96.8 ± 8.7% vs 97.4 ± 8.5% predicted, p = 0.508), FVC (98.1 ± 8.9% vs 98.7 ± 9.1% predicted, p = 0.524), or FEV1/FVC (88.6 ± 4.7% vs 88.9 ± 4.5%, p = 0.532). Treatment adherence was also comparable (95.6 ± 4.8% vs 95.1 ± 5.0%, p = 0.331).
| Variable | Group A (n = 180) | Group B (n = 180) | χ²/t | p-value |
| Gender, male/female | 86/94 | 93/87 | 0.55 | 0.46 |
| Age (years) | 8.84 ± 1.57 | 8.97 ± 1.58 | 0.78 | 0.434 |
| Disease duration (months) | 7.56 ± 1.43 | 7.48 ± 1.38 | 0.54 | 0.59 |
| Family history of allergy | 78 (43.3) | 82 (45.6) | 0.18 | 0.67 |
| Food allergy | 44 (24.4) | 41 (22.8) | 0.14 | 0.71 |
| AR severity, moderate/severe | 35/145 | 38/142 | 0.15 | 0.694 |
| House dust mite sensitization | 121 (67.2) | 124 (68.9) | 0.11 | 0.735 |
| Pollen sensitization | 69 (38.3) | 73 (40.6) | 0.19 | 0.666 |
| Animal dander/mold sensitization | 31 (17.2) | 29 (16.1) | 0.08 | 0.777 |
| Stable asthma | 28 (15.6) | 31 (17.2) | 0.18 | 0.669 |
| Atopic dermatitis | 21 (11.7) | 24 (13.3) | 0.23 | 0.633 |
Table 1: Baseline demographic and clinical characteristics of the two groups.
Values are mean ± SD or n (%), as appropriate. Allergen-sensitization categories are not mutually exclusive.
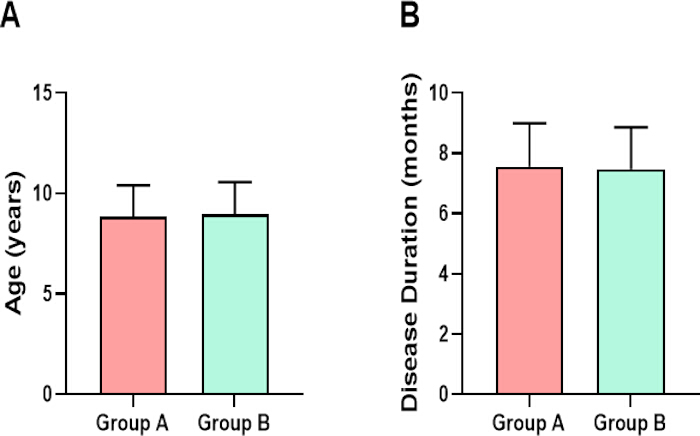
Figure 1: Comparison of baseline age and disease duration between the two treatment groups. Panel A shows age, expressed in years, and Panel B shows disease duration, expressed in months. Bars represent mean ± SD. Please click here to view a larger version of this figure.
Nasal symptom scores
Baseline TNSS values were comparable between Group A and Group B (10.82 ± 1.38 vs 10.96 ± 1.30 points, p = 0.327). Repeated-measures ANOVA showed significant effects of group (F (1,358) = 4.30, p = 0.039, partial η2 = 0.012), time (F (1,358) = 1919.55, p < 0.001, partial η2 = 0.843), and group × time interaction (F (1,358) = 9.05, p = 0.003, partial η2 = 0.025). Post-treatment TNSS was lower in Group B than in Group A (4.65 ± 2.12 vs 5.32 ± 2.09; mean difference, 0.67 points; 95% CI, 0.24–1.11; Cohen’s d = 0.32; p = 0.003; Figure 2).
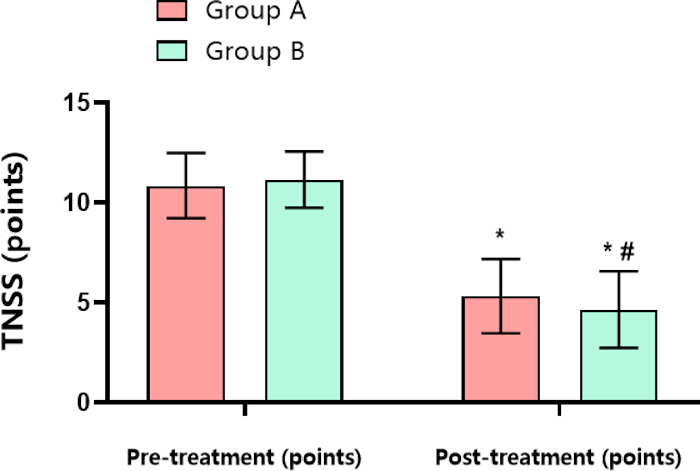
Figure 2. Comparison of Total Nasal Symptom Score (TNSS) between groups before and after treatment. Error bars represent SD. * = p < 0.001 versus pre-treatment within the same group; # = p = 0.003 versus Group A at the same time point. Pairwise comparisons were Bonferroni-adjusted. Please click here to view a larger version of this figure.
Non-nasal symptom scores
Baseline TNNSS values were comparable between Group A and Group B (7.38 ± 1.46 vs 7.31 ± 1.49 points, p = 0.668). Repeated-measures ANOVA showed significant effects of group (F(1,358) = 7.88, p = 0.005, partial η2 = 0.022), time (F (1,358) = 2684.15, p < 0.001, partial η2 = 0.882), and group × time interaction (F (1,358) = 5.17, p = 0.024, partial η2 = 0.014). Post-treatment TNNSS was lower in Group B than Group A (1.96 ± 1.43 vs 2.48 ± 1.01; mean difference, 0.52 points; 95% CI, 0.26–0.77; Cohen’s d = 0.42; p < 0.001; Figure 3).
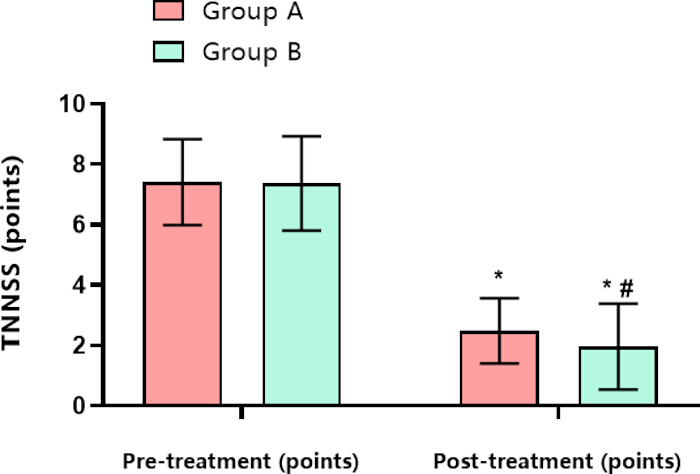
Figure 3: Comparison of Total Non-Nasal Symptom Score (TNNSS) between groups before and after treatment. Error bars represent SD. * = p < 0.001 versus pre-treatment within the same group; # = p < 0.001 versus Group A at the same time point. Pairwise comparisons were Bonferroni-adjusted. Please click here to view a larger version of this figure.
Time to symptom improvement
Based on daily symptom records, all patients in both groups met the predefined ≥50% improvement threshold for each of the four nasal symptoms during the 28-day treatment period; therefore, no observations were censored. Group B had a shorter time to symptom improvement than Group A. The mean between-group difference (Group A minus Group B) was 3.10 days for rhinorrhea (95% CI, 2.77–3.43; Cohen’s d = 1.97; p < 0.001), 0.47 days for nasal pruritus (95% CI, 0.10–0.84; Cohen’s d = 0.26; p = 0.014), 0.64 days for nasal congestion (95% CI, 0.35–0.92; Cohen’s d = 0.47; p < 0.001), and 0.48 days for sneezing (95% CI, 0.07–0.89; Cohen’s d = 0.24; p = 0.023; Table 2).
| Rhinorrhea | Nasal Pruritus | Nasal Congestion | Sneezing | |
| Group A | 13.48 ± 1.20 | 12.43 ± 1.68 | 10.28 ± 1.26 | 8.93 ± 2.39 |
| Group B | 10.38 ± 1.87 | 11.96 ± 1.89 | 9.64 ± 1.47 | 8.45 ± 1.48 |
| t-value | 18.7 | 2.48 | 4.43 | 2.28 |
| p-value | p < 0.001 | p = 0.014 | p < 0.001 | p = 0.023 |
Table 2: Time to symptom improvement in the two treatment groups, expressed in days.
The overall event rates were compared using Fisher’s exact test (p = 0.623).
Inflammatory biomarkers
Baseline IgE, EOS, and IL-13 levels were comparable between groups (IgE: 224.80 ± 28.60 vs 229.60 ± 27.90 U/mL, p = 0.108; EOS: 1.34 ± 0.35 vs 1.31 ± 0.39 ×10⁹/L, p = 0.441; IL-13: 154.72 ± 24.86 vs 157.63 ± 25.14 ng/L, p = 0.270). Significant time and group × time interaction effects were observed for all three biomarkers. The group main effect was significant for EOS and IL-13 but not for IgE. For IgE, the group, time, and interaction effects were F (1,358) = 1.57 (p = 0.211, partial η2 = 0.004), F (1,358) = 9416.28 (p < 0.001, partial η2 = 0.963), and F (1,358) = 74.28 (p < 0.001, partial η2 = 0.172), respectively. For EOS, the corresponding effects were F (1,358) = 5.38 (p = 0.021, partial η2 = 0.015), F (1,358) = 3744.79 (p < 0.001, partial η2 = 0.913), and F(1,358) = 35.78 (p < 0.001, partial η2 = 0.091). For IL-13, they were F (1,358) = 7.68 (p = 0.006, partial η2 = 0.021), F(1,358) = 1194.55 (p < 0.001, partial η2 = 0.769), and F (1,358) = 19.76 (p < 0.001, partial η2 = 0.052). Post-treatment IgE, EOS, and IL-13 were lower in Group B; for IL-13, the mean between-group difference was 12.42 ng/L (95% CI, 8.07–16.77; Cohen’s d = 0.59; p < 0.001; Figure 4).
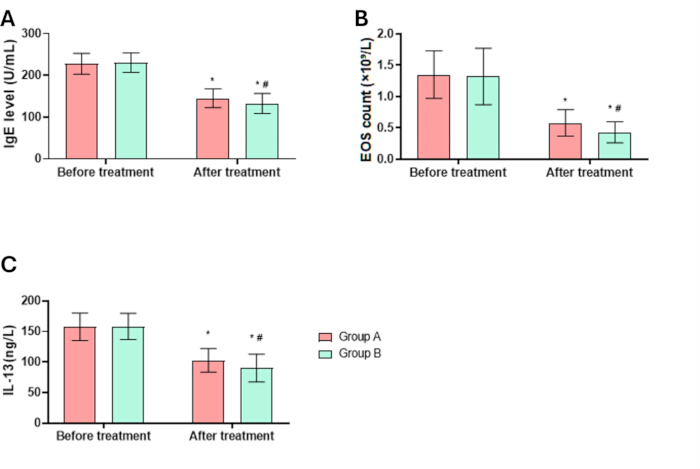
Figure 4: Longitudinal comparison of inflammatory biomarkers between the two treatment groups.
(A) Serum immunoglobulin E (IgE) levels before and after treatment. (B) Peripheral blood eosinophil (EOS) counts before and after treatment. (C) Serum interleukin-13 (IL-13) levels before and after treatment. Error bars represent the standard deviation (SD). * = p < 0.001 versus before treatment within the same group; # = p < 0.001 versus Group A at the same time point. Please click here to view a larger version of this figure.
Adverse events
Group A had 3 documented adverse events (1 nausea/vomiting and 2 somnolence), whereas Group B had 1 documented adverse event (somnolence). The overall adverse-event rates were 1.67% and 0.56%, respectively, with no statistically significant difference (Fisher’s exact test, p = 0.623; Table 3). None of the four documented adverse events resulted in treatment discontinuation, and no discontinuations because of intolerance or lack of efficacy were documented in either group. In the targeted retrospective review, apart from somnolence, no documented cases of insomnia, nightmares or abnormal dreams, irritability, agitation, anxiety, mood or behavioral changes, suicidal ideation, or self-harm were identified. Because these symptoms were ascertained retrospectively rather than with a validated prospective assessment instrument, under-reporting of mild or transient symptoms cannot be excluded.
| Adverse event | Group A (n = 180) | Group B (n = 180) |
| Nausea/vomiting | 1 | 0 |
| Dizziness/headache | 0 | 0 |
| Somnolence | 2 | 1 |
| Diarrhea | 0 | 0 |
| Total | 3 (1.67%) | 1 (0.56%) |
Table 3: Adverse events were recorded in the two treatment groups.
The de-identified participant-level analytical dataset used for the analyses reported in this manuscript is provided as Supplementary File 1, and the corresponding variable dictionary is provided as Supplementary File 2. Direct patient identifiers and calendar dates are excluded from the shared dataset to protect participant privacy. Patient_ID represents an arbitrary de-identified study identifier used solely to link variables within the supplementary dataset and has no analytical meaning. The clinical and outcome variables provided in Supplementary File 1 correspond to those used in the analyses reported in this manuscript.
Supplementary File 1: Participant-level analytical dataset. The dataset contains participant-level data for the 360 children included in the retrospective cohort, including treatment group and regimen, demographic and baseline clinical characteristics, treatment adherence, pre- and post-treatment TNSS and TNNSS values, time to improvement of individual nasal symptoms, inflammatory biomarker measurements, adverse events, neuropsychiatric-event documentation, and follow-up status. Please click here to download this file.
Supplementary File 2: Variable dictionary for the participant-level analytical dataset. The file defines the variables included in Supplementary File 1 and provides the corresponding descriptions, variable types, coding or ranges, units, and assessment time points. Please click here to download this file.
المناقشة
This retrospective controlled study found greater improvements in nasal and non-nasal symptoms and larger reductions in inflammatory biomarkers in children whose records documented desloratadine plus montelukast than in those receiving desloratadine alone. These findings are broadly consistent with recent systematic reviews and meta-analyses reporting improved symptom control with montelukast-antihistamine combination therapy12,13,14. The distinct contribution of the present study lies in the integrated evaluation of several clinically relevant dimensions of treatment response within a single pediatric cohort, rather than in re-establishing the overall efficacy of combination therapy. Specifically, concurrent assessment of TNSS, TNNSS, diary-derived time to improvement in individual nasal symptoms, and systemic inflammatory markers enabled the examination of symptom burden, response kinetics, and inflammatory changes together. The combination group also had a shorter time to improvement in rhinorrhea and nasal congestion, which may be consistent with the known role of leukotriene D4 in regulating nasal mucosal vascular permeability15. These findings should be interpreted within current guideline frameworks, which favor individualized, stepwise management and do not recommend leukotriene receptor antagonists as a universal first-line therapy for AR8,9,10,11.
The observed clinical effects may be partly explained by complementary inhibition of histamine- and leukotriene-mediated inflammatory pathways. Desloratadine is a peripheral H1-receptor antagonist, whereas montelukast blocks cysteinyl-leukotriene receptors16,17. Previous studies have linked montelukast-containing regimens to effects on eosinophilic and Th2-associated inflammatory signaling18,19,20. In the present cohort, EOS and IL-13 decreased, but Th1/Th2 cell subsets were not directly measured; therefore, these findings should not be interpreted as direct evidence of Th2 immune modulation. Because histamine and leukotriene pathways can contribute concurrently to allergic airway responses, their complementary inhibition may provide a biological rationale for the observed findings21,22. However, the present study did not directly investigate these molecular mechanisms, and mechanistic interpretation should be approached with caution.
Safety findings also require caution. Only four adverse events were recorded across the entire cohort, and the difference between groups was not statistically significant. Sleep, behavioral, and neuropsychiatric events were identified through retrospective review of routine clinical documentation rather than prospective standardized screening; consequently, mild or transient symptoms may have been under-ascertained. Larger prospective studies with dedicated safety monitoring are needed before firm comparative-safety conclusions can be drawn.
The present findings suggest that concurrent assessment of nasal and non-nasal symptom scores, time to symptom improvement, and systemic inflammatory biomarkers may provide a broader evaluation of treatment response in pediatric allergic rhinitis than symptom assessment alone. Future prospective multicenter studies should confirm these associations using standardized treatment protocols, longer follow-up periods, and predefined safety assessments. Inclusion of local nasal inflammatory markers and standardized neuropsychiatric monitoring may further clarify the biological and safety profiles of montelukast-containing combination therapy.
The single-center retrospective design and nonrandom treatment allocation may have introduced selection bias, information bias, and residual confounding. Treatment selection may have been influenced by clinical characteristics or physician preference that were not fully captured in the records; thus, observed associations should not be interpreted as definitive causal effects. The 8-week observation period did not permit assessment of long-term maintenance efficacy. The absence of nasal lavage cytokine profiling limited assessment of local immunomodulatory effects, and the age restriction to 6–12 years limits generalizability to younger children. Pulmonary function was not included in the final efficacy analysis. Finally, the small number of recorded adverse events and the retrospective ascertainment of neuropsychiatric safety limit the validity of the safety conclusions.
Conclusion
Montelukast sodium combined with desloratadine syrup was associated with greater improvements in clinical symptoms and greater reductions in inflammatory markers than desloratadine monotherapy in this pediatric retrospective cohort. Given the nonrandomized design and limited safety events, the findings should be considered associative and confirmed in prospective multicenter studies.
الإفصاحات
The authors declare no competing financial interests. No generative artificial intelligence (AI) tools were used in the preparation, writing, editing, analysis, or figure preparation of this manuscript.
شكر وتقدير
The authors thank the clinical, laboratory, and medical-records staff of The First Hospital of Putian for their assistance with routine clinical documentation and record retrieval. This study was conducted using institutional clinical and research resources. No dedicated external research grant is declared in this manuscript.
المواد
| الاسم | الشركة | رقم فهرسي | التعليقات |
|---|---|---|---|
| 0.9% Sodium Chloride Irrigation, USP, 1000 mL | Baxter Healthcare Corporation | Item No. 2F7124; NDC 0338-0048-04 | Sterile, preservative-free isotonic saline suitable for irrigation. |
| BD Vacutainer SST II Advance, 5 mL, 13 × 100 mm | Becton, Dickinson and Company | 367955 | Serum-separation blood collection tube with clot activator and gel. |
| Centrifuge 5702 R with Rotor A-4-38 and blood-tube adapters | Eppendorf SE | 5703000365 | Refrigerated benchtop centrifuge compatible with 13/16 mm blood collection tubes. |
| Desloratadine Oral Solution, 0.5 mg/mL | INA Pharmaceutics, Inc. | NDC 74157-011-01 | Oral second-generation H1-antihistamine; 0.5 mg/mL solution. |
| Human IL-13 ELISA Kit | Invitrogen / Thermo Fisher Scientific | BMS231-3 | 96-test sandwich ELISA kit for quantitative detection of human IL-13 in serum/plasma. |
| IBM SPSS Statistics, Version 26.0 | IBM Corp. | PID 5725-A54 | Statistical analysis software used for descriptive statistics, repeated-measures ANOVA, t tests, chi-square/Fisher tests, confidence intervals, and effect sizes. |
| Immunoglobulin E (IgE) Human ELISA Kit | Abcam | ab108650 | 96-well ELISA kit for quantitative determination of human IgE; absorbance read at 450 nm. |
| Montelukast Sodium Chewable Tablets, 5 mg | Rising Pharmaceuticals | NDC 57237-213-30 | Leukotriene receptor antagonist; 5 mg chewable tablet formulation. |
| Multiskan FC Microplate Photometer | Thermo Fisher Scientific | 51119000 | 96-well absorbance microplate reader; includes 450 nm filter suitable for ELISA readout. |
| SINUS RINSE Kit, 240 mL squeeze bottle | NeilMed Pharmaceuticals Inc. | 240 mL (8 fl oz) SINUS RINSE system | Large-volume, low-pressure nasal irrigation bottle; 240 mL reservoir. |
| XN-1000 Automated Hematology Analyzer | Sysmex Corporation | Model XN-1000 | Automated hematology analyzer capable of reporting absolute and percentage eosinophil counts (EO#, EO%). |
المراجع
- Licari A, et al. Epidemiology of allergic rhinitis in children: a systematic review and meta-analysis. J Allergy Clin Immunol Pract. 2023;11(8):2547-56. doi:10.1016/j.jaip.2023.05.016.
- Cheng M, et al. New progress in pediatric allergic rhinitis. Front Immunol. 2024;15:1452410. doi:10.3389/fimmu.2024.1452410.
- Buczyłko K, et al. The influence of desloratadine on course of intermittent allergic rhinitis. Pol Merkur Lekarski. 2005;18(104):133-40.
- Bousquet J, et al. Randomized controlled trial of desloratadine for persistent allergic rhinitis: correlations between symptom improvement and quality of life. Allergy Asthma Proc. 2013;34(3):274-82. doi:10.2500/aap.2013.34.3668.
- Saverno KR, Seal B, Goodman MJ, Meyer K. Economic evaluation of quality-of-life improvement with second-generation antihistamines and montelukast in patients with allergic rhinitis. Am Health Drug Benefits. 2009;2(7):309-16.
- Pradalier A, Neukirch C, Dreyfus I, Devillier P. Desloratadine improves quality of life and symptom severity in patients with allergic rhinitis. Allergy. 2007;62(11):1331-4. doi:10.1111/j.1398-9995.2007.01374.x.
- Velentza L, Maridaki Z, Blana E, Miligkos M. Antihistamines in the management of pediatric allergic rhinitis: a systematic review. Paediatr Drugs. 2020;22(6):673-83. doi:10.1007/s40272-020-00419-x.
- Dykewicz MS, et al. Rhinitis 2020: a practice parameter update. J Allergy Clin Immunol. 2020;146(4):721-67. doi:10.1016/j.jaci.2020.07.007.
- Wise SK, et al. International consensus statement on allergy and rhinology: allergic rhinitis - 2023. Int Forum Allergy Rhinol. 2023;13(4):293-859. doi:10.1002/alr.23090.
- Bousquet J, et al. Next-generation Allergic Rhinitis and Its Impact on Asthma (ARIA) guidelines for allergic rhinitis based on GRADE and real-world evidence. J Allergy Clin Immunol. 2020;145(1):70-80.e3. doi:10.1016/j.jaci.2019.06.049.
- Sousa-Pinto B, et al. Allergic Rhinitis and Its Impact on Asthma (ARIA)-EAACI Guidelines-2024-2025 revision: part I-guidelines on intranasal treatments. Allergy. 2026;81(4):954-76. doi:10.1111/all.70131.
- Kim JS, Stybayeva G, Hwang SH. Efficacy of montelukast-antihistamine combination therapy versus antihistamine monotherapy in allergic rhinitis: a systematic review and meta-analysis. Clin Exp Otorhinolaryngol. 2026;19(2):164-76. doi:10.21053/ceo.2025-00201.
- Kim JS, Stybayeva G, Hwang SH. Efficacy of a combination therapy of montelukast and antihistamines in allergic rhinitis: a systematic review and network meta-analysis. Allergy Asthma Immunol Res. 2025;17(6):692-708. doi:10.4168/aair.2025.17.6.692.
- Wang Q, Liu B, Hu Y. Effects of montelukast on allergic rhinitis in children: a systematic review and meta-analysis. Am J Transl Res. 2025;17(10):7557-68. doi:10.62347/ZBEV1016.
- Davis BE, et al. Single-dose desloratadine and montelukast and allergen-induced late airway responses. Eur Respir J. 2009;33(6):1302-8. doi:10.1183/09031936.00169008.
- Cingi C, et al. Does desloratadine alter the serum levels of montelukast when administered in a fixed-dose combination? Laryngoscope. 2013;123(11):2610-4. doi:10.1002/lary.24134.
- Ciebiada M, Górska-Ciebiada M, DuBuske LM, Górski P. Montelukast with desloratadine or levocetirizine for the treatment of persistent allergic rhinitis. Ann Allergy Asthma Immunol. 2006;97(5):664-71. doi:10.1016/S1081-1206(10)61098-8.
- Ciebiada M, et al. Use of montelukast alone or in combination with desloratadine or levocetirizine in patients with persistent allergic rhinitis. Am J Rhinol Allergy. 2011;25(1):e1-6. doi:10.2500/ajra.2011.25.3540.
- Ciebiada M, et al. Quality of life in patients with persistent allergic rhinitis treated with montelukast alone or in combination with levocetirizine or desloratadine. J Investig Allergol Clin Immunol. 2008;18(5):343-9.
- Ciebiada M, Barylski M, Gorska Ciebiada M. Nasal eosinophilia and serum soluble intercellular adhesion molecule 1 in patients with allergic rhinitis treated with montelukast alone or in combination with desloratadine or levocetirizine. Am J Rhinol Allergy. 2013;27(2):e58-62. doi:10.2500/ajra.2013.27.3881.
- Roquet A, et al. Combined antagonism of leukotrienes and histamine produces predominant inhibition of allergen-induced early and late phase airway obstruction in asthmatics. Am J Respir Crit Care Med. 1997;155(6):1856-63. doi:10.1164/ajrccm.155.6.9196086.
- Ayan A, et al. The effect of antiallergic treatment with desloratadine-montelukast on salivary glands function in allergic rhinitis. Hell J Nucl Med. 2014;17(3):190-3. doi:10.1967/s002449910144.