Statistical physics modeling provides molecular-scale insights into adsorption mechanisms and physically meaningful parameters beyond classical isotherms. With over 90% of studies reporting R2 > 0.95, it supports process optimization and multicomponent prediction. Integration with machine learning and standardized protocols may further advance water treatment and environmental remediation.
مقالة مراجعة
Statistical Physics Approaches to Adsorption Isotherm Models: A Review
في هذه المقالة
ملخص
الملخص
The present review critically examines the application of statistical physics to the development and interpretation of adsorption isotherm models, with particular emphasis on systems relevant to wastewater treatment. Rather than describing adsorption solely through empirical uptake curves, statistical physics provides a molecular-level framework that connects equilibrium adsorption data to descriptors of steric effects, energetic heterogeneity, and thermodynamic behavior. The models reviewed encompass monolayer, multilayer, single-solute, competitive, binary, ternary, and quaternary adsorption configurations. More than fifteen statistical-physics-based formulations are discussed, with particular emphasis on their mathematical expressions and the physicochemical significance of their fitted parameters. Thermodynamic quantities, including adsorption entropy, free enthalpy, internal energy, and adsorption-energy distributions, are considered as complementary tools for improving the mechanistic interpretation of adsorption processes. The review further examines the application of these models to pollutants such as dyes, pharmaceuticals, and heavy metals at adsorbent interfaces. In contrast to classical isotherm equations such as the Langmuir and Freundlich equations, statistical physics models provide access to molecular descriptors, including the aggregation number (n), receptor-site density (NM), adsorption energy, and layer-formation tendency, thereby offering deeper insight into adsorption mechanisms. Models derived from the grand canonical partition function can further account for adsorbate orientation, anchoring modes, interaction types, physisorption or chemisorption, and the number of molecules retained per adsorption site. In addition, they enable the macroscopic evaluation of adsorption through internal energy, entropy, and Gibbs free energy. Overall, this review highlights the potential of statistical physics as a powerful framework for bridging macroscopic adsorption measurements with molecular-level mechanisms and for providing a more comprehensive interpretation of pollutant removal at adsorbent interfaces.
المقدمة
Adsorption refers to the accumulation of a chemical species, the adsorbate, at an interface after transfer from a liquid or gaseous phase to a condensed phase, either solid or liquid1. In this review, the condensed phase is treated as a solid and is therefore termed the adsorbent1,2. The phenomenon begins when molecules, ions, or atoms present in the surrounding medium interact with atoms, surface functional groups, defects, or other active regions exposed by the adsorbent. These interfacial interactions stabilize the adsorbate at sites with favorable affinity. The magnitude and efficiency of adsorption are controlled by adsorbate-adsorbent compatibility, the properties of the solid, such as specific surface area, pore-size distribution, surface charge, and crystallinity, and operational variables such as initial pH, adsorbent loading, temperature, and initial solute concentration. Many studies have assessed adsorbents for wastewater purification1,2,3,4,5,6, indicating that concentration, dosage, pH, and temperature must be optimized to improve depollution performance2.
At a fixed temperature, an adsorption isotherm relates the amount of adsorbate retained by the adsorbent to the residual concentration of that species after equilibrium has been achieved7. Experimentally, these curves may be produced using several methodologies, which are commonly classified into three broad groups. The gravimetric, manometric, and hygrometric methods summarized in Figure 1 provide the equilibrium link between the solid-phase uptake, q, and the residual concentration in the liquid phase, C, under isothermal conditions. The resulting curve contains mechanistic information because its profile depends on the adsorption path, the adsorbent surface properties, and the adsorbate-adsorbent interaction pattern. Depending on both experimental conditions and the adsorbate/adsorbent pair, an isotherm may follow a simple saturation trend or a more complex multistep profile. Classification systems are therefore useful for interpreting these profiles and for selecting an appropriate mathematical representation. Among the available schemes, the Giles classification remains one of the most widely adopted.
Once obtained, the isotherm should be modeled to evaluate the role of physicochemical variables in adsorption. Giles8 classified isotherm curves by considering their overall shape and the slope at the beginning of adsorption. Limousin et al. subsequently summarized this classification into four main families: S, sigmoid; L, Langmuir-like; H, high-affinity; and C, constant-partition behavior9.
Classical isotherm equations have long been used to fit adsorption data and to obtain an initial description of adsorbate-adsorbent interactions. These equations include two-parameter models, such as Freundlich, Langmuir, and Radushkevich; three-parameter expressions, such as Sips, Khan, Tóth, Redlich-Peterson, and Liu; and other equations with four or more adjustable constants. They have been applied to numerous adsorbate/adsorbent systems10,11,12,13. More recently, statistical physics has expanded the interpretation of adsorption by assigning model parameters to the physical state of the adsorbed system. Accordingly, this review discusses the theoretical basis of statistical physics modeling and recent applications in adsorption systems, including gas adsorption and solute uptake from liquids. Bibliometric records from Scopus and Web of Science indicate an increasing use of these models in isotherm studies, supporting their growing relevance in adsorption science (Figure 2).
A literature search was performed on August 1, 2026, in the Scopus and Web of Science Core Collection databases, covering the period from 2010 to 2026. The research used a Boolean search term that combined key subject-related keywords and their synonyms to ensure an accurate selection within the relevant fields. The search included only original research articles in English, filtered by the fields "Adsorption" and "statistical physics models," and excluded studies that were not applicable. Using EndNote, we removed any duplicates and analyzed the unique publication groups to determine the annual number of publications. Figure 2A illustrates the number of publications in Scopus and Web of Science between 2010 and 2025, while Figure 2B presents the number of citations between 2016 and 2026, making it easy to verify consistency between the databases. The numbers extracted were normalized and visualized, with longitudinal curves in both figures.
This review provides a comprehensive critical synthesis of statistical-physics-derived models for describing liquid-phase adsorption isotherms, establishing a unified framework that links mathematical formulations to the molecular and thermodynamic significance of their parameters, thereby going beyond mere compilations of classical equations14,15,16,17,18. It systematically examines various adsorption configurations, including monolayer/multilayer arrangements, homogeneous/heterogeneous sites, and single-energy/multi-energy states, and translates these configurations into equations that are easily understood in terms of physics19,20,21,22,23,24. Special attention is given to the correlation between model parameters (adsorption capacity, receptor site density, number of molecules per site, site energies, and site occupation)25,26,27,28,29 and thermodynamic parameters such as configurational entropy, internal energy, Gibbs free energy, and enthalpy30,31,32,33,34. These statistical physics approaches are critically compared with classical empirical and semi-empirical models, highlighting the additional molecular-scale information that can be extracted from equilibrium isotherms35,36,37,38,39,40. This review also includes a bibliometric analysis aimed at identifying major research developments, new applications, and fields that have received little interest to date. The combination of theoretical foundations, parameter interpretation, thermodynamic analysis, new applications, and bibliometric analysis provides a coherent framework for evaluating the field's current status and suggests new avenues for its future development.
مراجعة ومنظور
The adsorption models developed from statistical physics face significant limitations that affect their practical applications. Many models are based on simplified assumptions about surface homogeneity, the accessibility of adsorption sites, and interactions between the adsorbent and the adsorbate, but real adsorbents exhibit complex characteristics, including varying pore sizes and heterogeneous surfaces. The fitted parameters, such as the aggregation number or adsorption energy, lack unambiguous physical interpretations and require validation through independent experiments. The majority of current research focuses on single-solute systems, thereby neglecting the complexity of real wastewater, which contains multiple pollutants and factors such as pH and temperature that influence adsorption behavior. The lack of validation under realistic steady-state flow conditions further undermines the reliability of the models. Refining these models can advance both fundamental science and environmental remediation, particularly when integrated with the design of advanced materials and molecular simulations. Future research should extend the models to multicomponent systems to better reflect complex pollutant mixtures and incorporate machine learning.
It is essential to strengthen the relationships among theoretical modeling, computational simulations, and process technology to translate statistical-physics-derived adsorption models into solutions for large-scale environmental treatment. The establishment of accurate predictive models requires systematic validation and their application in practical contexts.
Statistical physics modeling
Classical isotherms, including the Freundlich, Langmuir, and Redlich-Peterson equations, are routinely applied to equilibrium adsorption data but offer limited mechanistic insight and fail to clarify phenomena at the molecular scale due to their specific assumptions17. They provide only qualitative indications of surface uniformity or adsorbate interactions and cannot determine essential parameters such as site occupancy, adsorption energies, or layer numbers. To address these shortcomings, statistical physics has been introduced as a powerful theoretical framework that provides physically meaningful parameters18. This formalism relies on key assumptions: adsorbate-adsorbate interactions are initially neglected via an ideal-gas approximation valid at low concentrations19,20, while a real-gas model becomes necessary at higher concentrations to account for lateral interactions21. Interactions with water and most rotational, vibrational, and electronic degrees of freedom are typically omitted, making translation the dominant contribution22,23,24,25,26. In this context, adsorbent sites with characteristic energy ε accommodate variable particle numbers, and adsorption is viewed as particle transfer from the liquid reservoir to the surface, justifying the use of the grand canonical ensemble20,27. The partition function depends critically on adsorption energy (−ε) and chemical potential (μ)28,29,30. The complete mathematical derivation of these statistical physics models is thoroughly presented in Supplementary File 1. Furthermore, Figure 3 provides a visual roadmap, illustrating the progression from foundational system assumptions through the grand canonical ensemble and partition function to the development of specific models for monolayer, multilayer, single-solute, and multicomponent adsorption. Finally, the adjusted parameters from these models provide molecular-level and thermodynamic information, enabling a comprehensive interpretation of the adsorption mechanisms and surface heterogeneity.
Models for single adsorption systems
The single-energy monolayer model describes adsorption with one layer and energy (−ε), allowing variable adsorbate particle numbers n18,35. The partition function for one site is:
 (1)
(1)
Two site states contribute to this partition function. The term 1 denotes an empty adsorption site, while eβ(ε+μ) denotes a site occupied by adsorbed species. The mean number of occupied adsorption sites, N0, is calculated as26:
 (2)
(2)
The uptake as a function of concentration is given by:
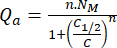 (3)
(3)
C1/2 is the half-saturation concentration, C is the equilibrium concentration, and NM is the site density. For n=1, it resembles Langmuir; at low concentration, it approaches Freundlich26. At saturation, the amount retained is37:
 (4)
(4)
The surface configuration expected for this model is shown in Figure 4A.
Single-layer model with dual energies
The two-energy monolayer model describes adsorption on two distinct site categories. Each category has its own adsorption energy, (−ε1) or (−ε2), and its own density of equivalent sites, NM1 or NM2. The number of ions or molecules hosted by each site category may differ and is represented by n1 and n218,22,35. The corresponding grand canonical partition functions are26:
 (5)
(5)
 (6)
(6)
The mean number of occupied adsorption sites is then written as:
 (7)
(7)
The equilibrium uptake is related to concentration by17:
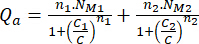 (8)
(8)
where C1 and C2 denote the half-saturation concentrations corresponding to the first and second site categories. The arrangement associated with this two-energy monolayer model is illustrated in Figure 4B.
Model with two layers and a single energy
In the single-energy double-layer model, the adsorbate is distributed over two adsorbed layers, both represented by the same adsorption energy ((−εi)22,35 (Figure 4C). For this arrangement, the grand canonical partition function is 17:
 (9)
(9)
The total mean number of occupied adsorption sites is obtained from:
 (10)
(10)
The amount adsorbed as a concentration-dependent quantity is given by38:
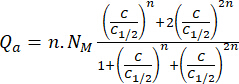 (11)
(11)
Two-energy double-layer model
The two-energy double-layer model represents ion or molecule adsorption over two layers, with different adsorption energies assigned to the first and second layers, (−ε1) and (−ε2), respectively, where |ε1| > |ε2|18,22,35. Under this assumption, the grand canonical partition function is:
 (12)
(12)
The mean number of occupied adsorption sites, N0, is obtained from:
 (13)
(13)
The adsorbed quantity can therefore be expressed as:
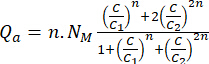 (14)
(14)
where C1 and C2 are the half-saturation concentrations for the first and second layers, respectively. Figure 4D shows the adsorbate distribution predicted by this model.
Three-layer model with a single energy
In the three-layer model with a single energy, adsorption produces three layers on the adsorbent surface, all described by a single adsorption energy (−εi) (Figure 4E). The associated grand canonical partition function is27:
 (15)
(15)
The average number of occupied adsorption sites is obtained from:
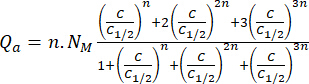
 (16)
(16)
The adsorbed amount is determined using39:
 (17)
(17)
Multi-layer model with two energies
In the two-energy multilayer model, the first layer, L1, arises from direct interactions between adsorbate species and the adsorbent surface and is associated with the adsorption energy (−ε1). The following layers, L2, are associated with adsorption energy (−ε2), with |ε1| > |ε2| > 017,18,40. With this assumption, the grand canonical partition function is19,41:
 (18)
(18)
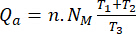
The amount retained in the solid phase is calculated from41:
 (19)
(19)
With 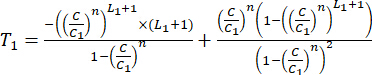 (20)
(20)
 (21)
(21)
 (22)
(22)
where C1 and C2 denote the half-saturation concentrations associated with layers L1 and L2, respectively. The overall number of layers is LT = L1 + L2. Under saturation conditions, the amount adsorbed on the adsorbent surface is42:
 (23)
(23)
The generation of L1 and L2 layers in this multilayer model is represented schematically in Figure 4F.
Infinite multilayer framework with three energy levels
The three-energy infinite multilayer model assumes that the first fraction of adsorbate is fixed directly on adsorption sites, generating layer L1 with adsorption energy (−ε1). A second layer, L2, is then formed with adsorption energy (−ε2), whereas the remaining adsorbate contributes to an unlimited set of L3 layers described by energy (−ε3). The energy sequence follows |ε1| > |ε2| > |ε3| 43. The corresponding grand canonical partition function is43:
 (24)
(24)
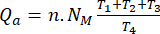
The equilibrium uptake as a function of concentration is43:
 (25)
(25)
With  (26)
(26)
 (27)
(27)
 (28)
(28)
 (29)
(29)
where C1, C2, and C3 are the half-saturation concentrations for L1, L2, and L3, respectively. Figure 4G shows the infinite multilayer arrangement produced through the intermediate L2 layer.
Finite multilayer model
The finite multilayer model assumes that the first adsorbate layer forms through interaction with the adsorbent surface with adsorption energy (−ε1). The second layer interacts with the first layer through adsorption energy (−ε2). Further layers are represented by the adsorption energy assigned to La, where La is the average number of layers35,44,45. Under these assumptions, the grand canonical partition function is:
 (30)
(30)
For this model, the adsorbed amount as a function of equilibrium concentration is obtained from44:
 (31)
(31)
where C1 and C2 are the half-saturation concentrations for layers L1 and La, respectively. The distribution of adsorbed species predicted by this model is presented in Figure 4H.
Models for binary adsorption systems
Competing single-layer model
The competitive monolayer model describes two solutes, A and B, competing for the same adsorption site27, where each filled site holds either A or B.
 (32)
(32)
where the occupancy variables describe adsorption sites filled by A and B, while μ1 and μ2 are the chemical potentials of A and B, respectively. The mean number of occupied sites associated with A ( ) and B (
 ) are27:
 (33)
(33)
 (34)
(34)
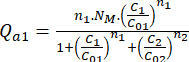
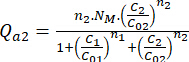
At equilibrium, the adsorbed amounts of A and B are27,45,46:
 (35)
(35)
 (36)
(36)
n1 and n2 are adsorbed A and B molecules; C1, C2 are their equilibrium concentrations, with C01 and C02 as half-saturation concentrations. The arrangement of the two adsorbates on the solid surface is depicted in Figure 5A.
Expanded Hill model
The extended Hill model represents an adsorbent surface containing two different site classes. Their densities are NM1 and NM2, and their adsorption energies are (−ε1) and (−ε2), respectively. The grand canonical partition functions for these site classes are17,22:
 (37)
(37)
 (38)
(38)
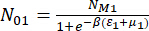
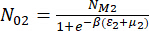
The mean number of occupied sites in each class is calculated as:
 (39)
(39)
 (40)
(40)
For each adsorption-site class, equilibrium uptake as a function of concentration is therefore:
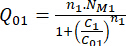 (41)
(41)
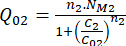 (42)
(42)
Figure 5B shows the distribution of adsorbate species on the solid surface according to the extended Hill model.
Models for ternary adsorption systems
Ternary adsorption model for identical adsorption sites
A ternary model includes identical adsorption sites in a liquid phase with three species and an NM adsorbent density47,48:
 (43)
(43)
The average amount for each occupied-site class is written as47,48:
 (44)
(44)
 (45)
(45)
 (46)
(46)
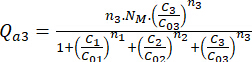
At equilibrium, the amount retained by each species as a function of concentration is48:
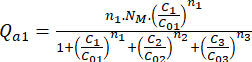 (47)
(47)
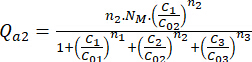 (48)
(48)
 (49)
(49)
n1, n2, n3 are adsorbed A, B, C molecules; C1, C2, C3 are equilibrium concentrations; C01, C02, C03 are half-saturation concentrations. The arrangement predicted by the ternary model with identical adsorption sites is shown in Figure 5C.
Ternary adsorption model for specific adsorption sites.
The ternary model includes three adsorbed species, A, B, and C, at specific sites, allowing for independent or competitive retention during adsorption48.
(50)
(51)
 (52)
(52)
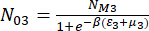
For each site class, the mean number of occupied sites is:
(53)
(54)
 (55)
(55)
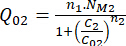
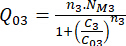
At equilibrium, the concentration-dependent amount retained by each species on its corresponding site class i 48:
(56)
 (57)
(57)
 (58)
(58)
Models for Quaternary adsorption systems
Quaternary adsorption model for identical adsorption sites
The quaternary model can be applied in cases when there are four species in the liquid, all with identical adsorption sites and the same density NM at the adsorbent (Figure 5E). The formulation uses one adsorption energy and is written as49:
 (59)
(59)
The average amount associated with each class of occupied site is49:
 (60)
(60)
 (61)
(61)
 (62)
(62)
 (63)
(63)
At equilibrium, the concentration-dependent amount of each species fixed at the adsorption sites is49:
 (64)
(64)
 (65)
(65)
 (66)
(66)
 (67)
(67)
Where n1, n2, n3, and n4 are the numbers of A, B, C, and D molecules adsorbed on one site, respectively. C1, C2, C3, and C4 are their equilibrium concentrations. C01, C02, C03, and C04 denote the half-saturation concentrations of A, B, C, and D. Figure 5E shows the adsorbate arrangement expected for the quaternary model with identical adsorption sites.
Quaternary adsorption model for specific adsorption sites.
The quaternary model considers four adsorbed species (A, B, C, D), which interact with each other independently or competitively at various adsorption site types49.
(68)
(69)
(70)
 (71)
(71)
For each site class, the mean number of occupied sites is:
(72)
(73)
(74)
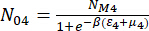 (75)
(75)
At equilibrium, the concentration-dependent amount retained by each species on its corresponding site class is48:
(76)
(77)
(78)
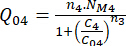 (79)
(79)
Advanced Statistical Physics Frameworks
The advanced statistical physics approach includes the real-gas chemical potential in the adsorption equations, accounting for adsorbate interactions and improving adsorption modeling by incorporating lateral effects.
Advanced monolayer model with one energy49,50:
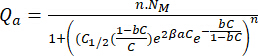 (80)
(80)
Advanced monolayer model with two energy states50:
 (81)
(81)
Advanced double-layer model49:
 (82)
(82)
Advanced multilayer model with two energies49:
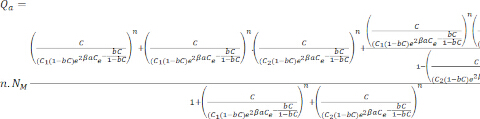 (83)
(83)
Advanced finite multilayer model51:
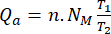 (84)
(84)
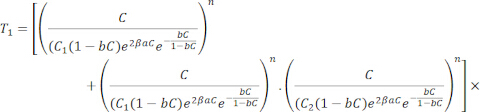 (85)
(85)
 (86)
(86)
Numerical fitting methods
The significance of an adsorption-at-equilibrium model is evaluated by comparing it with experimental adsorption values and those predicted by a fitted equation, which requires parameter optimization to minimize deviations. A good fit is indicated by a coefficient of determination close to one (R2 ≈ 1) and by low residual error measures (SSE, ARE, SAE, RMSE)52,53,54,55,56,57,58,59,60,61,62,63,64,65,66 (Table 1). Two optimization methods are used: the sum of normalized errors (SNE) with Excel Solver, and nonlinear least-squares regression using the Levenberg-Marquardt algorithm, usually in Origin software61,62,63,64,65,66.
 (87)
(87)
The aim of this work is to minimize the gap between experimental and calculated adsorption capacities, often by minimizing SSE. The LM algorithm is useful for nonlinear equations because it combines the Gauss-Newton and gradient descent methods. The selection of an optimization algorithm requires consideration of the model's form, the number of parameters, and the initial values. The important parameters include parameter bounds and convergence checks. The evaluation of a model's reliability requires consideration of R2, residual errors, complexity, behavior, and feasibility, not just R2.
Thermodynamic properties
The adsorption process is characterized using thermodynamic functions related to disorder and spontaneity, derived from the grand-canonical partition function at the molecular scale. These functions provide a more complete description of microscopic states and allow calculation of free enthalpy, internal energy, and entropy17,22,63,67,68,69,70,71,72,73. Specifically, the single-layer, double-layer, and multilayer models define the configuration entropy (Sad), Gibbs free energy (Gad), and internal energy (Eint), thereby revealing the interactions between adsorbates and receptor sites. The corresponding analytical expressions are given in the equations of Supplementary Table 1.
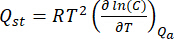
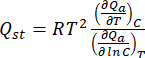
Isosteric enthalpy
The isosteric heat of adsorption highlights the heterogeneities in surface energy and allows the interactions between adsorbates to be measured; a fixed quantity of material adsorbed at two temperatures facilitates calculation using the Clausius-Clapeyron equation57,67.
 (88)
(88)
In this expression, C denotes the equilibrium adsorbate concentration at temperature T (K) for a specified adsorbed loading Qa, and R is the universal gas constant, 8.3144598 m2.kg.s−2.K−1.mol−1. Sips 68 also proposed the following expression for determining the isosteric heat:
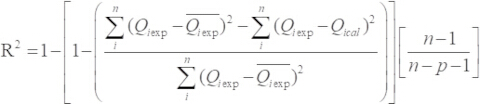 (89)
(89)
The value of Qst can be derived from the slope of the ln(C) versus 1/T curve at a constant charge or from the best-fitting adsorption isotherm67. Therefore, the detailed thermodynamic functions are available in the Supplementary Table 1.
Entropy
The entropy measures the configurational disorder in an adsorption system. It can be calculated using equations from statistical physics based on the model parameters63,72,74:
 (90)
(90)
 (91)
(91)
Combining these relationships gives the entropy in the form:
 (92)
(92)
At low adsorbate concentrations, entropy increases prior to half-saturation due to the available configurations31. Close to C1/2, a high site occupation rate maximizes entropy, but after this value, the decrease in the number of vacant sites reduces the number of possible molecular configurations, leading to a decrease in entropy toward zero at saturation70.
Gibbs free energy
The free enthalpy, used to evaluate whether adsorption is spontaneous and feasible, is generally expressed as74,75,76,77,78,79:
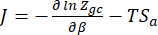 (93)
(93)
The corresponding chemical potential is written as:
 (94)
(94)
At a fixed temperature, negative values of free enthalpy indicate a thermodynamically favorable removal of the adsorbed species.
Internal energy
Internal energy accounts for the energetic contributions associated with uptake of the transferred species and is expressed as72,73,74,75,76,78,79,80:
 (95)
(95)
Negative internal energy is consistent with spontaneous retention of the species by the adsorbent surface. From the grand canonical partition function, the thermodynamic functions considered in this section are therefore obtained as follows:
Site energy distribution
The energy distribution per site (SED) provides a correlation between equilibrium parameters and the energy heterogeneity of adsorbents, indicating variations in energy per site F(ε) and interactions with solutes θt(ε,C)81:
 (96)
(96)
Here, ε represents the energetic difference between the adsorption of the solute and the adsorption of the solvent at a given site. The direct solution of this integral is not straightforward. For this reason, Cerofolini introduced the condensation approximation82, in which adsorption on low-energy sites is considered negligible (θt(ε,C) = 0), whereas adsorption on high-energy sites is considered complete (θt(ε,C) = 1). Under this assumption, the lower limit of integration is replaced by a concentration-dependent threshold energy ε*81,83,84,85:
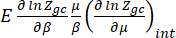 (97)
(97)
In this equation, Cs is the adsorbate maximum solubility in the solvent, εs denotes the minimum accessible adsorption energy associated with Ce = Cs, R is the ideal gas constant, T is the absolute temperature, and C is the standard adsorbate concentration in the liquid phase. The exponent m describes surface heterogeneity and is obtained from the Freundlich model, which is frequently used to construct the SED for heterogeneous adsorbents82,83,84,85.
 (98)
(98)
The integral in Eq. 93 corresponds to the area below the SED curve and is equal to the saturation adsorption capacity, Qsat36,86:
 (99)
(99)
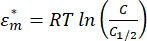
When the SED profile contains a maximum, defined by ε*m and F(ε*m), the surface can be interpreted as containing sites of different energetic classes. Sites with ε* > ε*m are considered high-energy sites, whereas those with ε* < ε*m are considered low-energy sites. The energy associated with the maximum is given by:
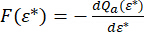 (100)
(100)
The SED profile also provides the relative abundance of adsorption sites at a given energy. The spread of this profile, referred to as the site-energy variability of the adsorbent, σe*, represents the distribution width and is calculated as:
 (101)
(101)
With
 (102)
(102)
 (103)
(103)
In these expressions, EP(ε*) is the expectation value of ε* and corresponds to the mean adsorption-site energy for a specific adsorbate87, whereas EP(ε*2) is the expectation value of ε*2. The critical energies ε*1 and ε*2 delimit the interval over which the SED is evaluated. When the distribution is Gaussian, σe* is equivalent to the standard deviation. Joint analysis of σe* and EP(ε*) therefore supports evaluation of surface energetic heterogeneity and identification of the energy domain most favorable for adsorbate retention.
The mean SED, EP(ε*), also reflects the strength of adsorbate-surface association. Larger EP(ε*) values indicate stronger adsorbent-adsorbate affinity and, consequently, a more favorable uptake process. After adsorption, variations in EP(ε*) describe how adsorbate molecules are redistributed among sites of different energies and help delimit the energy interval responsible for the most efficient retention.
Utilization of statistical mechanics in the adsorption phenomenon
The field of statistical physics supports research on adsorption by establishing a relation between the equilibrium isotherms and the microscopic properties, which makes it possible to obtain steric and energetic parameters that describe the adsorption mechanism at the molecular level, the site density, the number of adsorbed species, the layers, and the adsorption energy19,22.
Steric characteristics
The steric parameters highlight the interactions and arrangement of species adsorbed on surfaces, which affect the interpretation of the adsorption equilibrium.
Parameter n
The parameter n denotes the number of adsorbed species bound by an adsorption site at the equilibrium state. It indicates the molecular orientation and the mode of attachment, and is also termed the aggregation parameter. Below 1: A single adsorbate is distributed over more than one adsorption site, with no clustering. This situation is assigned to a multi-anchorage mechanism88,89,90. The functional groups of the adsorbates are attached to distinct sites, making both horizontal and parallel adsorption possible91. Equal to 1: One adsorbate species is associated with one adsorption site. This configuration is generally interpreted as non-parallel orientation, mono-adsorbate retention, and monomer formation92,93. Greater than 1: Several adsorbate species are retained by the same site, usually in inclined or perpendicular arrangements. This condition may generate 2-aggregated (n = 2), 3-aggregated (n = 3), or 4-aggregated (n = 4) species 17, indicating that adsorption proceeds through a multi-adsorbate mechanism22,93.
Parameter NM
NM denotes the density of occupied adsorption sites per unit mass of adsorbent91. It is inverse to n; values of n that are high reduce the number of accessible sites due to aggregation, while values of n that are low increase the availability of sites, which affects adsorption capacity92.
Number of layers formed
The number of adsorbed molecules is a steric parameter governed by steric hindrance and adsorbate-adsorbent/adsorbate-adsorbate interactions. Sellaoui et al.17 attributed the limited number of ibuprofen layers to pore-related constraints, while Yazidi et al.19 attributed the differences in the number of layers to intermolecular interactions. Atrous et al.17 reported 2.349 layers for Acid Red 1 on clay, applying the equation 2.349 = 2×y + 3×(1−y) to obtain the following fractions: 65.1% double layers and 32.9% triple layers. The concept of "layer-by-layer" (LBL) describes adsorption driven by electrostatic charge compensation, with alternating layers of cations and anions (double layer, finite or infinite multilayer), as shown in Figure 663,94,95. Ben Yahia et al.62 demonstrated the formation of such an alternating Mg2+/NO3- multilayer on porphyrin, although higher temperatures and reduced surface effects limited its growth.
Parameter Qsat
The Qsat, a steric parameter governed by several steric factors, is related to the number of species per site, the site density, and/or the number of layers in the best-fit model, making it useful for comparing adsorbent performance. In binary adsorption, the interactions between species A and B are inferred by comparing the binary Qsat to the value associated with a single solution, with three extreme cases taken into calculation27. If Qsat is lower in the binary system than in the single-solute system, species A and B compete and mutually reduce adsorption. If Qsat is higher in the binary system, the presence of B enhances retention of A, and the reciprocal effect may also occur. If Qsat is unchanged, no significant interaction between A and B is detected.
Energetic parameter
The adsorption energy is the primary characteristic used to describe interactions, affinity, and mechanism65. The values below 40 kJ·mol-1 indicate physisorption (van der Waals, hydrophobic, electrostatic, etc.), while values above 80 kJ·mol-1 indicate chemisorption91,96. The negative and positive signs denote exothermic and endothermic processes, respectively91. The first layer has a stronger binding than the other layers, so that |the first layer's energy| exceeds that of the subsequent layers19,28,88,96,97.
Van der Waals coefficients
In advanced statistical physics models that describe solutions as real gases, the Van der Waals coefficients (cohesion pressure and co-volume b) reflect lateral interactions between adsorbates and help explain the reductions in adsorption after saturation98,99,100. A higher value of a indicates a stronger attraction, which weakens the bond between the adsorbate and the site and promotes solution retention, thereby reducing adsorption52. In contrast, a higher value of b increases the distance between particles, thereby promoting adsorption101. The effects of temperature depend on the system: Souissi et al.23 found that higher temperatures reduced a (weaker attraction) and increased b (increased repulsion), thereby favoring the adsorption of silver ions onto hexahelicene (an endothermic process). In comparison, Alyousef et al.15 observed a higher value of a at high temperatures, suggesting stronger lateral interactions that hindered water vapor adsorption on date pits (an exothermic process).
Recent studies on adsorption isotherm calculations using statistical physics models.
Organic pollutants: Dyes and pharmaceuticals
Statistical physics models have become essential for interpreting equilibrium adsorption data, with Table 2, the result of maximum adsorption capacities and fitted parameters for dye/adsorbent systems.
An important study of dyes has shown that temperature increases site density and saturation capacity (Qsat) while confirming physisorption mechanisms64,97,102. The inverse relationship between molecules per site (n) and site density (NM) revealed that higher n increases steric hindrance, reducing accessible sites64. Real-gas monolayer models enabled isosteric heat analysis, identifying three concentration regions that reflect molecular interactions51.
For pharmaceuticals, single-solute systems followed the two-energy double-layer model, while ternary systems required designated-site models (Table 3)103,104. Diclofenac showed dimer formation (n varies from 1.13 to 2.06), while acetaminophen aggregation decreased with temperature103. Norfloxacin on graphene oxide revealed two site classes: 59% monomers/41% dimers at primary sites and 88% monomers/11% dimers at secondary sites105. Binary systems showed competitive exothermic physisorption106 and antagonistic effects from site competition107. Additional studies on activated carbons, modified clays, and biochars confirmed multimolecular physisorption108,109,110,111,112,113,114,115,116,117,118,119,120,121,122,123,124,125, with energies below 40 kJ·mol-1 confirming physisorption91,96. Negative values indicated exothermic processes while positive values indicated endothermic behavior. First-layer energies consistently exceeded subsequent layers due to stronger direct site binding19,28,88,96,97. For pharmaceutical systems, adsorption energies of ΔE1 = 12.73 kJ·mol-1 and ΔE2=18.85 kJ·mol-1 confirmed physical adsorption, suggesting feasible adsorbent regeneration. Statistical physics has proven essential for interpreting molecular orientations, aggregation states, interaction energies, and thermodynamic parameters across diverse adsorbate-adsorbent systems.
Inorganic pollutants and heavy metals
Pollution from heavy metals in industrial activities (such as tanning, mineral extraction, galvanoplasty, paint, and heating element production) releases toxic metal ions into water, harming ecosystems and organisms. Adsorption modeling using isotherms is an essential tool for evaluating removal performance126 (Table 4).
The entropy profiles of Ni(II) on four biosorbents showed two maxima at C1 and C2, corresponding to the first and second adsorbed layers, respectively. Three regimes were identified for each layer: (i) C < Ci: entropy increased due to the abundance of vacant sites allowing greater ion mobility; (ii) C = Ci: entropy reached a maximum, indicating the highest probability of adsorption; (iii) C > Ci: entropy decreased as the progressive occupation of sites restricted movement and reduced disorder. Ben Yahia et al.103 studied Ag+ species (silver chloride, silver nitrate, silver sulfide) on hexahelicene using QCM isotherms. The type of adsorbate governed the interactions, with higher temperatures favoring binding (endothermic adsorption). The silver chloride exhibited the strongest adsorption with stable saturation, which could be successfully fitted using the advanced single-layer model based on the ideal gas approach127,128,129,130.
Multicomponent and competitive adsorption systems
For AgNO3, descending isotherms indicated unstable saturation due to strong lateral interactions in solution competing with surface binding (Table 4). Dotto et al.130 studied Ni(II) on four biosorbents using the two-energy double-layer model; temperature increased aggregation (n) but decreased capacity, confirming exothermic physisorption, with surface interactions stronger than Ni(II)-Ni(II) interactions. Ben Yahia et al.103 found Ag2S showed the lowest n values due to sulfur-layer interference.
Selim et al.22 examined Cu2+/Zn2+ on cancrinite; in binary systems, both capacities decreased with nCu2+>nZn2+ and higher adsorption energy for Cu2+, confirming antagonism with spontaneous endothermic behavior. Sellaoui et al.48 evaluated ternary Cu2+, Cd2+, and Zn2+ on bone char; Cu2+ uptake was highest and unaffected by the other ions, whereas Cd2+ and Zn2+ showed parallel orientations, with Cu2+ showing non-parallel alignment. Quaternary adsorption on sludge-derived adsorbent49 showed endothermic behavior for Cu2+, Co2+, Ni2+, but exothermic for Ag+.
الاستنتاجات
This review demonstrates that statistical physics modeling has become an important methodological advance in adsorption science, as it provides molecular-level information that classical isotherm equations cannot provide. Analysis of more than fifteen model configurations applied to different adsorbate-adsorbent systems shows that these models quantify descriptors such as aggregation number, n: 0.2-5.3, receptor-site density, NM: 4.7-1421 mg.g−1, and adsorption energy, ΔE: -30.6 to +82.7 kJ.mol−1. These quantities are essential for interpreting adsorption at the molecular scale. The practical relevance of the approach is clear because more than 90% of the surveyed studies reported R2 values above 0.95 and obtained parameters with physical meaning, thereby improving the explanatory capacity of the Langmuir and Freundlich formulations. In dye and pharmaceutical adsorption, statistical physics models differentiated endothermic from exothermic mechanisms and supported process optimization. Competitive models further predicted multicomponent adsorption behavior from single-solute data, overcoming a major limitation of conventional isotherm analysis. Important gaps nevertheless remain. Natural adsorbents account for less than 15% of the reviewed literature; systems more complex than binary mixtures account for less than 5%; and industrial-scale validation remains scarce. Combining statistical physics with machine learning may accelerate parameter estimation, while coupling with real-time sensors may support adaptive control. Emerging contaminants, including PFAS, microplastics, and pharmaceutical residues, particularly require the molecular-scale insight provided by these models. Overall, statistical physics adsorption modeling should progress from a specialized academic approach to a routine tool for adsorption studies and industrial practice. This transition will require accessible software, standardized protocols, and systematic validation. As computational resources and interdisciplinary collaborations continue to expand, these models are well-positioned to address major environmental challenges in water treatment and related fields.
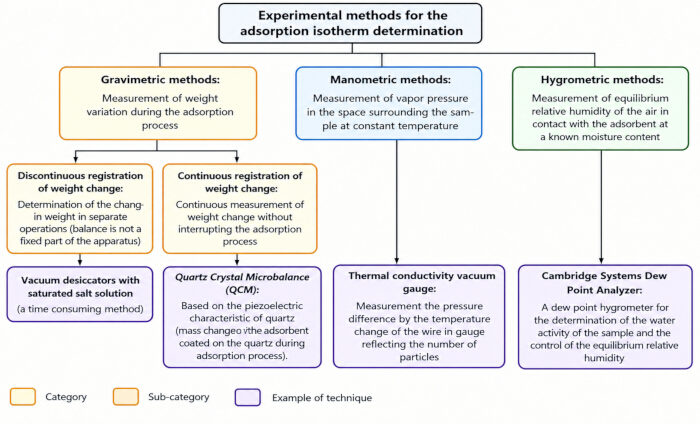
Figure 1: Principal experimental approaches used to obtain adsorption isotherms14,15. This figure provides a schematic illustration of the experimental methods utilized to measure and realize the adsorption isotherms. Please click here to view a larger version of this figure.
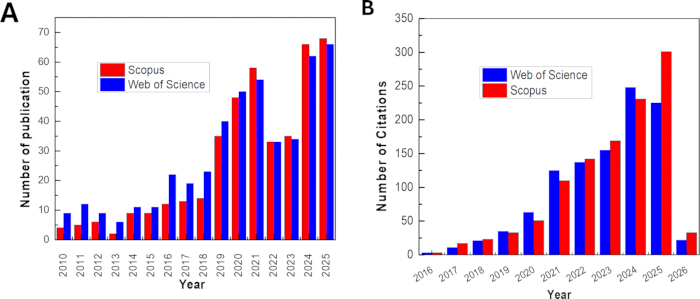
Figure 2: Evolution of the publications and citations related to the application of statistical physics models to adsorption isotherms. The annual numbers of publications (A) and citations (B) listed in Scopus and Web of Science, showing researchers' interest in using statistical physics models to explain adsorption isotherms. The red and blue bars represent data from Scopus and Web of Science, respectively. Please click here to view a larger version of this figure.
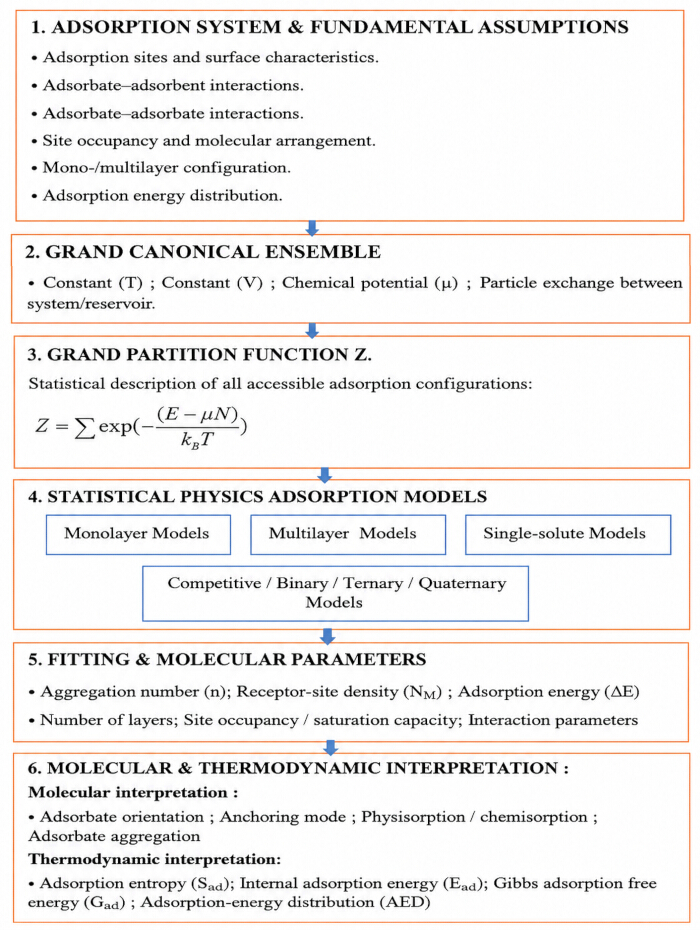
Figure 3. Schematic representation of the statistical physics framework for adsorption isotherm modeling. This figure shows the different stages of adsorption equilibrium as described in statistical physics: the definition of the system, the formation of the grand canonical ensemble, and the development of models. It emphasizes the extraction of molecular parameters (n, NM, ΔE) and their thermodynamic interpretation, including adsorbate orientation, Gibbs adsorption free energy (Gad), adsorption entropy (Sad), and adsorption-energy distribution (AED). Please click here to view a larger version of this figure.
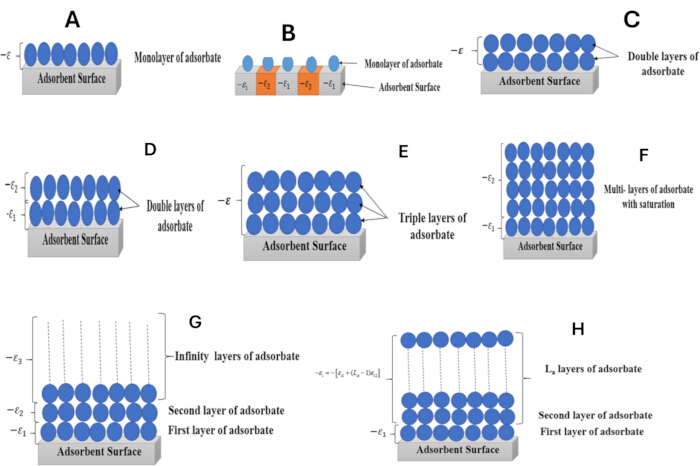
Figure 4: Schematic representation of adsorbate organization on the adsorbent surface for: (A) The single-layer model with one energy. (B) The single-layer model with two energy levels. (C) The double-layer model with one energy. (D) The double-layer model with two energy sources. (E) The triple-layer model with one energy, (F) The multilayer model with two energies (G) The infinite multilayer model with three energies, (H) The limited multilayer model. Please click here to view a larger version of this figure.
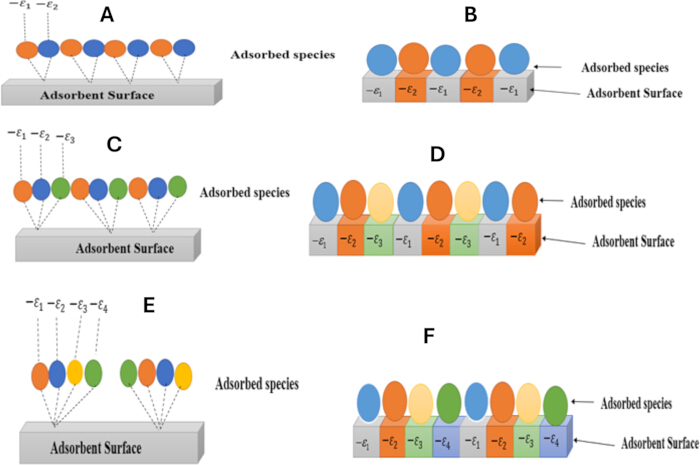
Figure 5: Schematic representation of adsorbate species on the adsorbent surface for: (A) The competitive monolayer model. (B) The general Hill model. (C) The ternary model with identical adsorption sites, (D) The ternary model with specific adsorption sites, (E) The quaternary model with identical adsorption sites, and (F) The quaternary model with specific adsorption sites. Please click here to view a larger version of this figure.
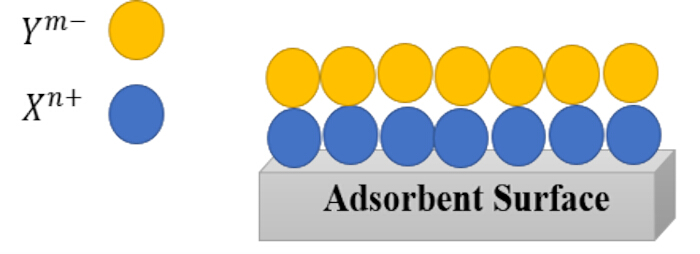
Figure 6: Schematic representation of the layer-by-layer arrangement of cations and anions according to the advanced double-layer model. A simplified representation of the alternating arrangement of anions (Ym−) and cations (Xn+) on the surface of the adsorbent, illustrating the layer-by-layer organization described by the advanced double-layer model. Please click here to view a larger version of this figure.
| Error function | Expression | Ref |
| Sum of the Squares of the Errors (SSE) | ∑i=1n (Qe,exp − Qe,cal)i2 | 55 |
| Average relative error (ARE) | (100/n) ∑i=1n |Qe,cal − Qe,exp| / Qe,exp | 55 |
| Sum of the absolute errors (EABS) | ∑i=1n |Qe,cal − Qe,exp| | 55 |
| Nonlinear Chi-square (χ2) | ∑i=1n (Qe,exp − Qe,cal)2 / Qe,cal | 53 |
| Hybrid fractional error function (HYBRID) | [100/(n − p)] ∑i=1n [(Qe,exp − Qe,cal)2 / Qe,cal] | 55 |
| Akaike information criterion (AIC) | n ln(SSE/n) + 2p | 41 |
| Residual root mean square error (RMSE) | √[∑ (Qe,cal − Qe,exp)2 / (n − p)] | 19 |
Table 1: Error functions frequently used in numerical adjustment procedures. The following table summarizes the error functions frequently used in numerical fitting methods and their main characteristics.
| Adsorbent | Adsorbate | Equilibrium model | Temperature range | n range | NM range (mg·g⁻¹) | Qsat range (mg·g⁻¹) | Energies range (kJ·mol⁻¹) | Ref |
| Ashitaba Waste-Activated Carbon (AWAC) | Methylene Blue (MB) | 298–318 | 1.25; 0.22 | 115.78; 867.9 | 289.25; 381.88 | ΔE₁: 10.27; 13.89; | 76 | |
| Multilayer model with two energies | ΔE₂: 8.44; 10.88 | |||||||
| Congo Red (CR) | 298–318 | 1.12; 0.44 | 154.09; 718.32 | 345.17; 632.13 | ΔE₁: 14.97; 20.43 ;ΔE₂: 13.82; 17.09 | |||
| Walnut Shell-Activated Carbon (WSAC) | Methylene Blue (MB) | 298–318 | 0.30. 0.61 | 523.65; 327.86 | 314.19; 400.11 | ΔE₁: 17.75; 15.08 | 76 | |
| Multilayer model with two energies | ΔE₂: 9.80; 11.15 | |||||||
| Congo Red (CR) | 298–318 | 0.62; 0.43 | 226.97; 514.6 | 281.45; 442.56 | ΔE₁: 11.14; 13.23 ; ΔE₂: 7.25; 9.23 | |||
| Natural Pine-Fruit Shells (NPFS) | 298–323 | 0.83; 1.89 | 41.54; 149.85 | 49.85; 58.65 | ΔE₁: 8.74; 11.9 | 79 | ||
| Remazol Black B (RB) | Multilayer model with two energies | |||||||
| Carbonized Pine-Fruit Shells (CPFS) | 298–323 | 1.10; 2.88 | 78.05; 21.42 | 177.19; 192.88 | ΔE₁: 12.55; 15.55 | |||
| ΔE₂: 17.19; 19.28 | ||||||||
| Raw Chitosan (CTN) | Sunset Yellow (SY) | 298–328 | 0.34; 2.12 | 44.76; 21.77 | 30.44; 90.55 | ΔE₁: 9.77; 16.17 | 84 | |
| Double-layer model with two energies | ||||||||
| Functionalized Chitosan (CTN-F) | 298–328 | 0.36; 2.16 | 42.43; 21.75 | 30.55; 94.18 | ΔE₁: 10.55; 17.77 | |||
| ΔE₂: 9.18; 13.13 | ||||||||
| WS₂/WO₃ Nanocomposite | Rhodamine B (RhB) | Monolayer model with one energy | 303–323 | 1.840;2.922 | 136.3;114.8 | 250.8; 335.4 | ΔE₁: 5.901; 8.575 | 85 |
| Chitosan/Polyamide Nanofibers (CPN) | Reactive Black 5 (RB5) | Double-layer model with two energies | 298–328 | 1.2; 0.3 | 82; 391 | 198.6; 352.5 | ΔE₁: 11.51; 21.12 | 131 |
| ΔE₂: 7.17; 16.19 | ||||||||
| Ponceau 4R (P4R) | Multilayer model with two energies | 298–328 | 1.6; 0.42 | 69; 573 | 222.4; 482.2 | ΔE₁: 14.52; 25.19 | 88 | |
| Grafted Clay | ΔE₂: 8.11; 16.10 | |||||||
| Acid Red 1 (AR-1) | 298–328 | 0.505; 0.789 | 363.844; 196.017 | 321.363; 363.290 | ΔE₁: 20.121; 29.974 | |||
| ΔE₂: 22.401; 24.968 | ||||||||
| Acid Green 25 (AG-25) | 298–328 | 0.546; 0.741 | 314.25; 263.293 | 340.758; 397.418 | ΔE₁: 29.445; 27.149 | 42 | ||
| ΔE₂: 22.399; 23.058 | ||||||||
| Multilayer model with two energies | ||||||||
| Grafted Clay | ||||||||
| Brilliant Blue (BB) | 298–328 | 0.55; 0.23 | 590.05; 1160.11 | 814.27; 406.19 | ΔE₁: –20.98; –7.88 | |||
| ΔE₂: –17.88; –6.22 | ||||||||
| Sunset Yellow (SY) | 298–328 | 0.98; 0.31 | 467.97; 1421.53 | 1432.98; 924.88 | ΔE₁: –25.11; –14.12 | |||
| ΔE₂: –22.30; –14.12 | ||||||||
| Chitosan | Tartrazine (TT) | 298–328 | 0.77; 0.29 | 481.90; 1157.33 | 1065.55; 611.27 | ΔE₁: –22.22; –10.18 | ||
| ΔE₂: –19.19; –8.85 | ||||||||
| Amphoteric Adsorbent Coating (AAC) | Brilliant Green (BG) | Multilayer model with two energies | 303–343 | 2.12; 3.97 | ΔE₁: 45.051; 82.67 | 96 | ||
| ΔE₂: 30.138; 72.086 | ||||||||
| Acid Red 1 (AR-1) | 303–343 | 0.52; 0.83 | ΔE₁: –14.558; –14.498 ΔE₂: –8.195; –8.256 | |||||
| Brazilian Berries Seeds (BBS) | Methylene Blue (MB) | Monolayer model with two energies | 298–328 K | n₁: 0.34; 2.27 n₂: 0.51; 2.44 | NM₁: 206.24; 38.70 | Qsat₁: 70.14; 94.44 ; | ΔE₁: 12.224; 17.119 | 101 |
| NM₂: 163.09; 42.43 | Qsat₂: 83.18; 103.55 | ΔE₂: 14.080; 19.088 | ||||||
| Cyanoguanidine Crosslinked Chitosan (CC–chitosan) | Food Yellow 4 (FY4) | Monolayer model with two energies | 298–328 K | n₁: 0.67; 1.16 n₂: 0.69; 1.12 | NM₁: 709; 314 | Qi(i=1,2): 758; 597 | ΔE₁: (–16.44);(–19.55) | 91 |
| NM₂ : 329; 208 | ΔE₂: (–12.12);(–15.66) | |||||||
| Cyanoguanidine Crosslinked Chitosan (CC–chitosan) | Food Blue 2 (FB2) | Monolayer model with two energies | 298–328 K | n₁: 0.62; 0.82 n₂: 0.65; 0.88 | NM₁ : 784; 514 NM₂ : 322; 175 | Qi(i=1,2): 695; 575 | ΔE₁: (–8.55); (–14.31) ΔE₂: (–6.54); (–14.44) | 91 |
| Metal–organic framework (MOF) MIL-101 | Reactive red 2 (RR2) | Double-layer model with two energies | 25;45°C | 0.64;0.86 | 684.25; 582.98 | 875.84;1002.72 | - | 105 |
| Reactive blue 19 (RB19) | 0.74 ;1.55 | 656.66 ;370.36 | 971.85 ;1148.11 | - | ||||
| Cyanoguanidine Crosslinked Chitosan (CC–chitosan) | Food Yellow 4 (FY4/FB2) | Extended monolayer model with two energies | 298–328 K | n₁: 0.75; 0.91 n₂: 0.85; 0.80 | NM₁ : 535; 388 NM₂ : 418; 416 | Qi(i=1,2): 756; 714 | ΔE₁: (–10.44); (–14.88) ΔE₂: (–11.16); (–12.25) | 91 |
| Raw Posidonia (RP) biomass | Basic Blue 41 (BB41) | Finite multi-layer model | 30–80 °C | 1.481; 1.073 | 30.535; 419.136 | – | – | 33 |
| Pecan Nutshell (PN) biomass | Crystal Violet (CV) | Monolayer model with one energy | 298–328 K | 1.12; 1.14 | 84.08; 82.65 | 94.17; 94.23 | ΔE₁: 13.18; 13.22 | 133 |
| Calcined Ca4Nd6O | Methylene blue (MB) | Multilayer model | 298-333 | 1.05 ;0.80 | 94.88 ;169.99 | 319.31 ;354.93 | - | 134 |
| Milled Ca4Nd6O | 1.09 ;0.81 | 148.80 ;210.01 | 470.35 ;506.92 | - | ||||
| Natural Muscovite Clay (NMC) | Methylene Blue (MB) | Monolayer model with one energy | 298 K | 1.055 | 56.35 | 59.47 | ΔE₁: –30.60 | 135 |
Table 2: Use of statistical physics models for dye adsorption. This table presents statistical physics models applied to dye adsorption, including the associated adsorption models and their main parameters.
| Adsorbent | Adsorbate | Equilibrium Model | Temperature Range | n Range | NM Range (mg·g⁻¹) | Qsat Range (mg·g⁻¹) | Energies Range (kJ·mol⁻¹) | Ref |
| Durian Shell Activated Carbon (AC) | Amoxicillin (AMX) | Monolayer model with one energy | 30–50 °C | 1.017; 1.077 | 140.328; 110.608 | 142.714; 119.125 | ΔE₁: (–14.235);(–12.742) | 18 |
| Durian Shell Activated Carbon (AC) | Tetracycline (TCN) | 30–50 °C | 0.858; 0.928 | 146.944; 114.319 | 126.078; 106.088 | ΔE₁: (–3.799); (–2.825) | ||
| Durian Shell Activated Carbon (AC) | Amoxicillin (AMX) / Tetracycline (TCN) | Competitive monolayer model | 30–50 °C | n₁: 0.583; 0.681 ; | NM₁: 253.546;141.742 | Qsat₁: 147.820; 96.460 | ΔE₁: (–12.720);(–14.258) | 18 |
| n₂: 0.634; 0.719 | NM₂: 135.358; 90.287 | Qsat₂: 85.857; 64.970 | ΔE₂: (–5.302); (–7.256) | |||||
| Activated Carbon (AC) | Ibuprofen (IBP) | Multi-layer model with two energies | 298–323 K | 1.16 ± 0.06; 1.28 ± 0.07 | 43.15 ± 2.15; 95.41 ± 4.75 | 147.77 ± 7.38; 190.98 ± 9.50 | ΔE₁: 5.87 ± 0.30; 5.08 ± 0.26 ; | 17 |
| ΔE₂: 4.21 ± 0.22; 5.06 ± 0.26 | ||||||||
| Activated Carbon Oxidized in H₂O₂ (AC(H₂O₂)) | Ibuprofen (IBP) | Multi-layer model with two energies | 298–323 K | 1.61 ± 0.08; | 56.27 ± 2.80; 33.55 ± 1.65 | 164.14 ± 8.20; 233.25 ± 11.65 | ΔE₁: 14.08 ± 0.74; 12.82 ± 0.67 | 17 |
| 3.60 ± 0.18 | ΔE₂: 7.22 ± 0.37; 7.51 ± 0.39 | |||||||
| Activated Carbon Heat-treated 700 °C (AC(700N2)) | Ibuprofen (IBP) | Multi-layer model with two energies | 298–323 K | 1.64 ± 0.08; 1.35 ± 0.06 | 34.16 ± 1.70; 68.11 ± 3.40 | 144.98 ± 7.21; 162.44 ± 8.10 | ΔE₁: 14.94 ± 0.78; 13.87 ± 0.73 | 17 |
| ΔE₂: 5.83 ± 0.30; 6.25 ± 0.32 | ||||||||
| Zeolite/Sepiolite Nanohybrid (Zeo-Sep) | Ibuprofen (IBP) | Double-layer model with two energies | 20–60 °C | 0.44; 1.95 | 25.19; 41.13 | 22.17; 16.14 | ΔE₁: (–17.22); (–12.88) | 136 |
| ΔE₂: (–13.13); (–7.87) | ||||||||
| Modified Organosepiolite (O-Sep) | Ibuprofen (IBP) | Double-layer model with two energies | 20–60 °C | 0.53; 2.10 | 60.61; 11.21 | 64.25; 47.11 | ΔE₁: (–24.18); (–15.29) | 136 |
| ΔE₂: (–17.25); (–10.28) | ||||||||
| Raw Activated Carbon (AC) | Ketoprofen (KTP) | Multi-layer model with two energies | 298–328 K | 1.711; 1.203 | 17.107; 28.850 | 59.435; 87.807 | ΔE₁: 10.423; 14.044 | 57 |
| ΔE₂: 2.152; 2.843 | ||||||||
| Raw Activated Carbon (AC) | Ibuprofen (IBP) | Monolayer model with one energy | 298–328 K | 0.490; 0.436 | 244.897; 344.972 | 120; 160 | ΔE₁: 3.399; 4.484 | 57 |
| Ultrasound Activated Carbon (UAC) | Ketoprofen (KTP) | Multi-layer model with two energies | 298–328 K | 1.093; 0.301 | 43.322; 108.802 | 80.383; 121.452 | ΔE₁: 11.711; 19.891 | 57 |
| ΔE₂: 1.660; 4.128 | ||||||||
| Ultrasound Activated Carbon (UAC) | Ibuprofen (IBP) | Monolayer model with one energy | 298–328 K | 0.454; 0.418 | 407.183; 568.672 | 184.861; 237.705 | ΔE₁: 2.005; 2.779 | 57 |
| perfluorooctanoic carboxylic acid (PFCA) | 298–328 K | 1.57 ;2.56 | 16.89 ;2.67 | 30.77 ;13.87 | ΔE₁: 30.57; 27.40 | 105 | ||
| Multilayer model | ΔE₂: 18.04; 23.92 | |||||||
| Magnetic chitosan | heptadecafluorooctane | 298–328 K | 1.34 ;2.16 | 27.38 ;3.06 | 50.26 ;18.70 | ΔE₁: 24.33; 21.63 | ||
| sulfonic acid (HFOSA) | ΔE₂: 13.63; 16.46 | |||||||
| Activated Carbon (AC) | Diclofenac (DFC) | Multi-layer model with two energies | 298–323 K | 1.49; 0.27 | 14.55; 49.99 | 58.22; 45.09 | ΔE₁: (–10.97); (–2.28) | 137 |
| ΔE₂: (–8.88);(–2.09) | ||||||||
| Avocado biomass waste (AC) | Acetaminophen | Multilayer model | 20-40°C | 2.06 ;4.07 | 12.46 ;10.66 | 52.71 ;116.53 | ΔE₁: 16.67; 17.64 | 138 |
| (ATP) | ΔE₂: 12.86; 13.27 | |||||||
| diclofenac (DFC) | 1.57 ;3.06 | 13.88 ;18.17 | 84.34 ;112.76 | ΔE₁: 19.72; 22.58 | ||||
| ΔE₂: 14.69; 17.16 |
Table 3: Utilization of statistical physics models in the adsorption of pharmaceutical compounds. This table summarizes the statistical physics models employed in the adsorption of pharmaceutical compounds, which includes the models and their main parameters.
| Adsorbent | Adsorbate | Equilibrium Model | Temperature Range | n Range | NM Range (mg·g⁻¹) | Qsat Range (mg·g⁻¹) | Energies Range (kJ·mol⁻¹) | Ref |
| Polysulfone/Zeolite Blend Sheet Membrane | Cu(II) | Monolayer model with two energies | 303–343 K | n₁: 4.05; | NM1: 4.70; 140.74 | Qsat1: 19.03; 78.81 | ΔE1: 12.36; 19 ; | 138 |
| n₂: 1.96; 0.12 | NM2: 30.35; 35.8 | Qsat2: 39.88; 20.04 | ΔE2: 8.55; 14.82 | |||||
| Spirulina biomass | Ni(II) | Monolayer model with two energies | 298–338 K | n₁: 1.09594; 0.65764 | NM1: 74.7534; 267.9309 | Qsat1: 81.92524; 176.2021 | ΔE1: 26.226; 27.506 | 28 |
| n₂: 2.41246; 5.3011 | NM2: 20.56503; 5.22889 | Qsat2: 49.61231; 27.71887 | ΔE2: 22.070; 27.023 | |||||
| Spirulina biomass | Cu(II) | Multi-layer model with two energies | – | 1.22392; 0.20181 | 35.90803; 119.6523 | 117.3668; 224.928 | ΔE1: 24.309; 21.372 | – |
| ΔE2: 19.004; 25.099 | ||||||||
| Bentonite–Chitosan Composite | Cd(II) | Monolayer model with one energy | 30–50 °C | 1.68; 1.94 | 64.42; 97.52 | 108.22; 189.19 | ΔE1: 24.18; 14.6 | 46 |
| Bentonite–Chitosan Composite | Pb(II) | Monolayer model with one energy | 30–50 °C | 1.51; 1.80 | 66.96; 93.76 | 101.11; 168.77 | ΔE1: 16.22; 32.78 | – |
| Bentonite–Chitosan Composite | Cd(II)/Pb(II) | Competitive monolayer model | – | n₁: 0.66; 0.97 ; | 116.91; 97.34 121.58; 258.31 | 77.16; 94.42 63.22; 82.66 | ΔE1: 18.25; 29.29 | – |
| n₂: 0.52; 0.32 | ΔE2: 11.11; 21.22 | |||||||
| Activated Carbon | Cd(II) | Monolayer model with one energy | – | 0.98 | 0.070 | 0.069 | ΔE1: 7.12 | 37 |
| Activated Carbon | Zn(II) | Monolayer model with one energy | – | 2.12 | 0.041 | 0.088 | ΔE1: 12.12 | – |
| Activated Carbon | Cd(II)/Zn(II) | Competitive monolayer model | – | n₁: 0.50 ; | 0.022; 0.042 | Qsat1: 0.011 | ΔE1: 2.19 ; | – |
| n₂: 2.05 | Qsat2: 0.087 | ΔE2: 11.92 | ||||||
| Treated Sea Mango Shell | Pb(II) | Monolayer model with one energy | 30–50 °C | 1.02; 1.98 | 56.97; 33.83 | 58.11; 67.12 | ΔE1: 8.67; 37.08 | 91 |
| Treated Sea Mango Shell | Cu(II) | Monolayer model with one energy | 30–50 °C | 1.01; 1.74 | 39.18; 29.88 | 39.25; 52.17 | ΔE1: 6.56; 30.97 | – |
| Treated Sea Mango Shell | Pb(II)/Cu(II) | Competitive monolayer model | – | n₁: 0.50; 0.38 n₂: 0.37; 0.33 | 52.12; 110.81 46.27; 81.23 | 26.11; 42.11 17.12; 27.21 | ΔE1: 4.07; 15.97 ΔE2: 3.77; 11.20 | – |
| Activated Carbon | Pb(II)/Zn(II) | Extended Hill model | 298–313 K | n₁: 0.55; 0.40 ; | NM1: 28.20; 42.77 ; | Qsat1: 15.51; 17.11 | ΔE1: (-7.55); (-18.25) | 32 |
| n₂: 0.48; 0.37 | NM2: 16.97; 27.16 | Qsat2: 8.51; 10.05 | ΔE2: (-9.19); (-27.75) | |||||
| Bentonite–Alginate Composite (BAC) | Pb(II) | Monolayer model with one energy | 30–50 °C | 0.83; 1.55 | 164.07; 109.60 | 136.18; 169.88 | ΔE1: 11.09; 20.25 | 129 |
| Bentonite–Alginate Composite (BAC) | Hg(II) | Monolayer model with one energy | 30–50 °C | 0.73; 1.44 | 116.68; 86.03 | 85.18; 123.88 | ΔE1: 7.96; 17.01 | – |
| Bentonite–Alginate Composite (BAC) | Pb(II)/Hg(II) | Competitive monolayer model | – | n1: 0.58; 0.55, n2: 0.49; 0.54 | NM1: 152.03; 181.91, NM2: 119.55; 140.26 | Qsat1: 88.18; 105.00, Qsat2: 58.58; 75.74 | ΔE1: 8.97; 16.02, ΔE2: 5.96; 12.99 | – |
| Activated Carbon | Zn²⁺ | Monolayer model with one energy | – | 2.12 | 0.041 | 0.088 | ΔE1: 12.12 | 37 |
| Activated Carbon | Cd²⁺ | Monolayer model with one energy | – | 0.98 | 0.070 | 0.069 | ΔE1: 7.12 | – |
| Activated Carbon | Zn²⁺/Cd²⁺ | Competitive monolayer model | – | n1: 2.05, n2: 0.50 | 0.042, 0.022 | Qsat1: 0.087, Qsat2: 0.011 | ΔE1: 11.92, ΔE2: 2.19 | – |
| Bone Char | Cu(II) | Ternary adsorption model for same adsorption sites | 30–50 °C | 0.55; 0.97 | 0.38; 0.29 | 0.21; 0.28 | ΔE1: 11.50; 18.75 | 48 |
| Bone Char | Cd(II) | Ternary adsorption model for same adsorption sites | 30–50 °C | 0.23; 0.22 | 0.43; 0.59 | 0.10; 0.13 | ΔE1: 5.49; 10.15 | – |
| Bone Char | Zn(II) | Ternary adsorption model for same adsorption sites | 30–50 °C | 0.21; 0.21 | 0.43; 0.57 | 0.09; 0.12 | ΔE1: 5.03; 9.90 | – |
Table 4: Utilization of statistical physics models in the adsorption of heavy metals. This table presents a list of statistical physics models applied to heavy metal adsorption, and describes their main parameters.
Supplementary File 1. Basic development of statistical physics adsorption models. The file presents the fundamental statistical-physics framework used to derive adsorption isotherm models, including the grand canonical partition function, mean site occupation, the relationship between adsorbed quantity and equilibrium concentration, ideal- and real-gas chemical potentials, the translational partition function, and the half-saturation concentration (Equations S1–S9). Please click here to download this file.
Supplementary Table 1. Thermodynamic expressions for statistical physics adsorption models. The table summarizes the mathematical expressions used to calculate entropy, free enthalpy, and internal energy for representative statistical-physics adsorption models, including monolayer, double-layer, triple-layer, multilayer, and extended Hill models. Please click here to download this file.
الإفصاحات
The authors have no conflicts of interest to declare.
شكر وتقدير
The authors extend their appreciation to the Deanship of Scientific Research and Libraries in Princess Nourah bint Abdulrahman University for funding this research work through the Supporting Publication in Review Article Program, Grant No. (RAP-2026-158).
المراجع
- Gupta VK, Carrott PJM, Ribeiro Carrott MML, Suhas. Low-cost adsorbents: growing approach to wastewater treatment—a review. Crit Rev Environ Sci Technol. 2009;39(10):783-842.
- Yagub MT, Sen TK, Afroze S, Ang HM. Dye and its removal from aqueous solution by adsorption: a review. Adv Colloid Interface Sci. 2014;209:172-84.
- Gupta VK. Application of low-cost adsorbents for dye removal—a review. J Environ Manage. 2009;90(8):2313-42.
- Crini G, Lichtfouse E, Wilson LD, Morin-Crini N. Conventional and non-conventional adsorbents for wastewater treatment. Environ Chem Lett. 2019;17(1):195-213.
- Krstić V, Urošević T, Pešovski B. A review on adsorbents for treatment of water and wastewaters containing copper ions. Chem Eng Sci. 2018;192:273-87.
- Singh NB, Nagpal G, Agrawal S. Water purification by using adsorbents: a review. Environ Technol Innov. 2018;11:187-240.
- Al Mardini F. Etude de l'adsorption du pesticide Bromacil sur charbon actif en poudre en milieu aqueux: effet competiteur des matieres organiques naturelles [PhD thesis]. Université de Poitiers; France; 2008.
- Giles CH, Smith D, Huitson A. A general treatment and classification of the solute adsorption isotherm. I. Theoretical. J Colloid Interface Sci. 1974;47(3):755-65.
- Limousin G, et al. Sorption isotherms: a review on physical bases, modeling and measurement. Appl Geochem. 2007;22:249-75.
- Al-Ghouti MA, Da'ana DA. Guidelines for the use and interpretation of adsorption isotherm models: a review. J Hazard Mater. 2020;393:122383.
- Foo KY, Hameed BH. Insights into the modeling of adsorption isotherm systems. Chem Eng J. 2010;156:2-10.
- Rangabhashiyam S, Anu N, Giri Nandagopal MS, Selvaraju N. Relevance of isotherm models in biosorption of pollutants by agricultural byproducts. J Environ Chem Eng. 2014;2:398-414.
- Briki C, et al. Experimental and theoretical study of hydrogen absorption by LaNi3.6Mn0.3Al0.4Co0.7 alloy using statistical physics modeling. Int J Hydrogen Energy. 2018;43:9722-32.
- Jedli H, et al. Experimental and theoretical study of CO2 adsorption by activated clay using statistical physics modeling. RSC Adv. 2019;9:38454-63.
- Alyousef H, Ben Yahia M, Aouaini F. Statistical physics modeling of water vapor adsorption isotherm into kernels of dates: experiments, microscopic interpretation and thermodynamic functions evaluation. Arab J Chem. 2020;13:4691-702.
- Gal S. Recent advances in techniques for the determination of sorption isotherms. In: Duckworth RB, editor. Water relations of foods. 1974. p. 139-54.
- Sellaoui L, et al. Application of statistical physics formalism to the modeling of adsorption isotherms of ibuprofen on activated carbon. Fluid Phase Equilib. 2015;387:103-10.
- Yazidi A, et al. Adsorption of amoxicillin and tetracycline on activated carbon prepared from durian shell in single and binary systems: experimental study and modeling analysis. Chem Eng J. 2020;379:122320.
- Ayachi F, et al. Application of statistical physics formalism for the modeling of adsorption isotherms of water molecules on the microalgae Spirulina platensis. Food Bioprod Process. 2019;114:103-12.
- Knani S, Mathlouthi M, Ben Lamine A. Modeling of the psychophysical response curves using the grand canonical ensemble in statistical physics. Food Biophys. 2007;2:183-92.
- Yahia MB, Manel BY. New insights in the physicochemical investigation of the vitamin B12 nucleus using statistical physics treatment: interpretation of experiments and surface properties. RSC Adv. 2020;10:21724-35.
- Selim AQ, Sellaoui L, Mobarak M. Statistical physics modeling of phosphate adsorption onto chemically modified carbonaceous clay. J Mol Liq. 2019;279:94-107.
- Souissi H, Ben Yahia M. Application of innovative analytical modeling for the physicochemical analysis of adsorption isotherms of silver nitrate on helicenes: phenomenological study of the complexation process. Adsorpt Sci Technol. 2021;2021:1-14.
- Alyousef AH, Ben Yahia M, Aouaini F. New insights on microscopic interpretation of adsorption isotherms of ionophores (manganese-porphyrin complexes) using statistical physics formalism. AIP Adv. 2020;10:065210.
- Yahia MB, et al. Statistical studies of adsorption isotherms of iron nitrate and iron chloride on a thin layer of porphyrin. J Mol Liq. 2017;248:235-45.
- Marwa BM, et al. Modeling of adsorption isotherms of dye N719 on titanium oxide using the grand canonical ensemble in statistical physics for dye sensitized solar cells. Sol Energy. 2016;135:177-87.
- Alyousef Y, Dotto GL, Ben Lamine A. Statistical physics modeling of synthetic dyes adsorption onto Spirulina platensis nanoparticles. Environ Sci Pollut Res. 2018;25:28973-84.
- Ayachi FZ, et al. Evaluating the adsorption of Ni(II) and Cu(II) on spirulina biomass by statistical physics formalism. J Ind Eng Chem. 2019;80:461-70.
- Rouquerol F, Rouquerol J, Sing K. General conclusions and recommendations. In: Adsorption by powders and porous solids. Elsevier; 1999. p. 439-47.
- Diu B, Guthmann C, Lederer D, Roulet B. Elements de physique statistique. Hermann; 2001.
- Ben Yahia M, et al. Modeling and interpretations by the statistical physics formalism of hydrogen adsorption isotherm on LaNi4.75Fe0.25. Int J Hydrogen Energy. 2013;38:11536-42.
- Sellaoui L, et al. A new statistical physics model to interpret the binary adsorption isotherms of lead and zinc on activated carbon. J Mol Liq. 2016;214:220-30.
- Nakhli A, et al. Adsorption thermodynamics in the framework of the statistical physics formalism: basic blue 41 adsorption onto Posidonia biomass. Desalin Water Treat. 2016;57:12730-42.
- Lamine AB, Bouazra Y. Application of statistical thermodynamics to the olfaction mechanism. Chem Senses. 1997;22:67-75.
- Mobarak M, et al. Statistical physics modeling and interpretation of methyl orange adsorption on high-order mesoporous composite of MCM-48 silica with treated rice husk. J Mol Liq. 2019;285:678-87.
- Duan S, Gu M, Tao M, Xian X. Adsorption of methane on shale: statistical physics model and site energy distribution studies. Energy Fuels. 2020;34:304-18.
- Sellaoui L, Dotto GL, Lamine AB, Erto A. Interpretation of single and competitive adsorption of cadmium and zinc on activated carbon using monolayer and exclusive extended monolayer models. Environ Sci Pollut Res. 2017;24:19902-8.
- Ben Manaa M, et al. Adsorption isotherms of N3 dye on TiO2 mesoporous for dye sensitized solar cells: their realization, their modeling and consequent interpretations using a statistical physics treatment. J Alloys Compd. 2018;765:385-95.
- Mobarak M, et al. Experimental results and theoretical statistical modeling of malachite green adsorption onto MCM-41 silica/rice husk composite modified by beta radiation. J Mol Liq. 2019;273:68-82.
- Ayachi H, Aouaini F, Ben Yahia M. New insights on physicochemical investigation of water adsorption isotherm into seed of dates using statistical physics treatment: pore size and energy distributions. J Mol Liq. 2020;298:112041.
- Yahia MB, et al. Adsorption of sodium and lithium ions onto helicenes molecules: experiments and phenomenological modeling. J Mol Liq. 2019;288:110998.
- Zhang L, et al. Adsorption of dyes brilliant blue, sunset yellow and tartrazine from aqueous solution on chitosan: analytical interpretation via multilayer statistical physics model. Chem Eng J. 2020;382:122952.
- Wjihi S, Peres EC, Dotto GL, Lamine AB. Physicochemical assessment of crystal violet adsorption on nanosilica through the infinity multilayer model and sites energy distribution. J Mol Liq. 2019;280:58-63.
- Nakhli A, et al. Statistical physics studies of multilayer adsorption on solid surface: adsorption of basic blue 41 dye onto functionalized Posidonia biomass. Sep Sci Technol. 2014;49:2525-33.
- Sellaoui AQ, et al. Statistical physics-based analysis of the adsorption of Cu2+ and Zn2+ onto synthetic cancrinite in single-compound and binary systems. J Environ Chem Eng. 2019;7:103217.
- Sellaoui L, et al. Insights on the statistical physics modeling of the adsorption of Cd2+ and Pb2+ ions on bentonite-chitosan composite in single and binary systems. Chem Eng J. 2018;354:569-76.
- Sellaoui L, et al. Understanding the adsorption of Pb2+, Hg2+ and Zn2+ from aqueous solution on a lignocellulosic biomass char using advanced statistical physics models and density functional theory simulations. Chem Eng J. 2019;365:305-16.
- Sellaoui L, et al. A new statistical physics model for the ternary adsorption of Cu2+, Cd2+ and Zn2+ ions on bone char: experimental investigation and simulations. Chem Eng J. 2018;343:544-53.
- Sellaoui L, et al. A study of single and quaternary adsorption of Cu2+, Co2+, Ni2+ and Ag+ on sludge modified by alkaline fusion. Chem Eng J. 2022;433:133674.
- Yahia MB, AlZahrani HYS, Yahia MB. Application of advanced statistical physics modeling for the physicochemical analysis of adsorption isotherms of manganese (II) on porphyrins H2TPP and H2TTP. Braz J Chem Eng. 2021;38:373-88.
- Bergaoui M, et al. Novel insights into the adsorption mechanism of methylene blue onto organo-bentonite: adsorption isotherms modeling and molecular simulation. J Mol Liq. 2018;272:697-707.
- Yahia MB, et al. Theoretical investigation of the chlorophyll nucleus adsorption monitored with Quartz Crystal Microbalance technique: new insights on physicochemical properties. J Mol Liq. 2019;289:111188.
- Ho YS, Porter JF, McKay G. Equilibrium isotherm studies for the sorption of divalent metal ions onto peat: copper, nickel and lead single component systems. Water Air Soil Pollut. 2002;141:1-33.
- Sivarajasekar N, Baskar R. Adsorption of basic red 9 onto activated carbon derived from immature cotton seeds: isotherm studies and error analysis. Desalin Water Treat. 2014;52:7743-65.
- Ng JCY, Cheung WH, McKay G. Equilibrium studies of the sorption of Cu(II) ions onto chitosan. J Colloid Interface Sci. 2002;255:64-74.
- Ho YS. Selection of optimum sorption isotherm. Carbon. 2004;42:2115-6.
- Yazidi A, et al. Monolayer and multilayer adsorption of pharmaceuticals on activated carbon: application of advanced statistical physics models. J Mol Liq. 2019;283:276-86.
- Amrhar O, Nassali H, Elyoubi SM. Application of nonlinear regression analysis to select the optimum absorption isotherm for Methylene Blue adsorption onto Natural Illitic Clay. Bull Soc Roy Sci Liege. 2015;84:116-30.
- Brown AM. A step-by-step guide to non-linear regression analysis of experimental data using a Microsoft Excel spreadsheet. Comput Methods Programs Biomed. 2001;65:191-200.
- Nakhli A, et al. Non-linear analysis in estimating model parameters for thymol adsorption onto hydroxyiron-clays. J Mol Liq. 2017;244:201-10.
- Nakhli A, et al. Modeling of essential oils adsorption onto clays towards a better understanding of their interactions. J Mol Liq. 2018;249:132-43.
- Yahia MB, et al. A statistical physics study of the interaction of [7]-helicene with alkali cations (K+ and Cs+): new insights on microscopic adsorption behavior. RSC Adv. 2017;7:44712-23.
- Knani S, et al. Statistical physics study of the interaction of the 5, 10, 15, 20-tetrakis (4-tolylphenyl) porphyrin (H2TTPP) with magnesium ion: new microscopic interpretations. Arab J Chem. 2020;13:4374-85.
- Lima DR, et al. Physicochemical and thermodynamic study of malachite green adsorption on raw and modified corn straw. Can J Chem Eng. 2018;96:779-87.
- Bergaoui M, Nakhli A, Al-Muhtaseb S, Khalfaoui M. Adsorption process of n-alkanes onto BAX-1100 activated carbon: theoretical estimation of isosteric heat of adsorption and energy distribution of heterogeneous surfaces. J Mol Liq. 2018;252:399-407.
- Sircar S. Isosteric heats of multicomponent gas adsorption on heterogeneous adsorbents. Langmuir. 1991;7:3065-9.
- Chowdhury S, Mishra R, Saha P, Kushwaha P. Adsorption thermodynamics, kinetics and isosteric heat of adsorption of malachite green onto chemically modified rice husk. Desalination. 2011;265:159-68.
- Li Z, et al. Interpretation of diclofenac adsorption onto ZnFe2O4/chitosan magnetic composite via BET modified model by using statistical physics formalism. J Mol Liq. 2021;327:114858.
- Ben Torkia Y, et al. Stereographic and energetic studies of acid blue 9 adsorption onto Spirulina platensis (strain LEB-52) based on statistical physics approach. Chem Eng Commun. 2020;207(4):445-57.
- Pang X, et al. Theoretical study of indigotine blue dye adsorption on CoFe2O4/chitosan magnetic composite via analytical model. Colloids Surf A Physicochem Eng Asp. 2020;589:124467.
- Mohamed B, Qingyu Z, Moggridge GD, Abdelmottaleb BL. New insight in adsorption of pyridine on the two modified adsorbents types MN200 and MN500 by means of grand canonical ensemble. J Mol Liq. 2018;263:413-21.
- Nakbi A, et al. Investigation of caffeine taste mechanism through a statistical physics modeling of caffeine dose-taste response curve by a biological putative caffeine adsorption process in electrophysiological response. Prog Biophys Mol Biol. 2019;149:70-85.
- Nakbi A, et al. Quantitative characterization of sucrose taste by statistical physics modeling parameters using an analogy between an experimental physicochemical isotherm of sucrose adsorption on β-cyclodextrin and a putative biological sucrose adsorption from sucrose dose-taste response curve (psychophysics and electrophysiology). J Mol Liq. 2020;298:111950.
- Bel Haj Mohamed N, et al. Synthesis and preparation of acid capped CdSe nanocrystals as successful adsorbent and photocatalyst for the removal of dyes from water and its statistical physics analysis. Environ Sci Pollut Res. 2022;29(48):72747-63.
- Sakly A, et al. Steric and energetic investigations of adsorption isotherms of methylene blue on new polymeric multi-layered material-based k-carrageenan and alginate. Desalin Water Treat. 2024;320:100635.
- Naifar A, Bouzid M, Ben Torkia Y. Physics statistical analysis of crystal violet adsorption onto activated bamboo fiber powder: insights from thermodynamic functions. Mater Chem Phys. 2025;329:130110.
- Knani S, et al. Experimental characterization and advanced modeling of the adsorption of Rhodamine B and Crystal Violet on new cobalt metalloporphyrin adsorbent. Polyhedron. 2025;277:117584.
- Bouzid M, Naifar A, Ben Torkia Y. Statistical physics investigation and DFT insights into antibacterial drug removal from simulated aquatic systems. J Mol Liq. 2025;437:128380.
- Sakly A, et al. Advanced investigation of the elimination of methylene blue from wastewater using activated carbon-copper oxide nanowires: new perspectives with statistical physical modeling. Asia Pac J Chem Eng. 2026:e70219.
- Sakly A, et al. Investigation of adsorption isotherms of methylene blue dye on the newly fabricated composite of nanofibers sericin/β-cyclodextrin/PVA (PVA-SS-CD): steric and energetic interpretation. Appl Mater Today. 2025;45:102843.
- He J, Guo J, Zhou Q, Fang F. Adsorption characteristics of nitrite on natural filter medium: kinetic, equilibrium, and site energy distribution studies. Ecotoxicol Environ Saf. 2019;169:435-41.
- Carter MC, Kilduff JE, Weber WJ. Site energy distribution analysis of preloaded adsorbents. Environ Sci Technol. 1995;29:1773-80.
- Cerofolini GF. Localized adsorption on heterogeneous surfaces. Thin Solid Films. 1974;23:129-52.
- Kumar KV, et al. A site energy distribution function from Toth isotherm for adsorption of gases on heterogeneous surfaces. Phys Chem Chem Phys. 2011;13:5753.
- Jin Q, Yang Y, Dong X, Fang J. Site energy distribution analysis of Cu(II) adsorption on sediments and residues by sequential extraction method. Environ Pollut. 2016;208:450-7.
- Yan B, Niu CH. Modeling and site energy distribution analysis of levofloxacin sorption by biosorbents. Chem Eng J. 2017;307:631-42.
- Shen X, et al. Sorption mechanisms of organic compounds by carbonaceous materials: site energy distribution consideration. Environ Sci Technol. 2015;49:4894-902.
- Atrous M, et al. Adsorption of dyes acid red 1 and acid green 25 on grafted clay: modeling and statistical physics interpretation. J Mol Liq. 2019;294:111610.
- Dotto GL, Pinto LAA, Hachicha MA, Knani S. New physicochemical interpretations for the adsorption of food dyes on chitosan films using statistical physics treatment. Food Chem. 2015;171:1-7.
- Li Z, et al. Adsorption of congo red and methylene blue dyes on an ashitaba waste and a walnut shell-based activated carbon from aqueous solutions: experiments, characterization and physical interpretations. Chem Eng J. 2020;388:124263.
- Sellaoui L, et al. Equilibrium modeling of single and binary adsorption of Food Yellow 4 and Food Blue 2 on modified chitosan using a statistical physics theory: new microscopic interpretations. J Mol Liq. 2016;222:151-8.
- Sellaoui L, et al. Experimental and theoretical studies of adsorption of ibuprofen on raw and two chemically modified activated carbons: new physicochemical interpretations. RSC Adv. 2016;6:12363-73.
- Hanafy H, et al. Statistical physics modeling and interpretation of the adsorption of dye remazol black B on natural and carbonized biomasses. J Mol Liq. 2020;299:112099.
- Ariga K, Lvov Y, Kunitake T. Assembling alternate dye-polyion molecular films by electrostatic layer-by-layer adsorption. J Am Chem Soc. 1997;119:2224-31.
- Lvov Y, Ariga K, Ichinose I, Kunitake T. Assembly of multicomponent protein films by means of electrostatic layer-by-layer adsorption. J Am Chem Soc. 1995;117:6117-23.
- Azha SF, et al. Synthesis and characterization of a novel amphoteric adsorbent coating for anionic and cationic dyes adsorption: experimental investigation and statistical physics modelling. Chem Eng J. 2018;351:221-9.
- Khalfaoui M, et al. Statistical thermodynamics of adsorption of dye DR75 onto natural materials and its modifications: double-layer model with two adsorption energies. Environ Sci Pollut Res. 2014;21:3134-44.
- Yahia MB, Sellaoui L. Adsorptive removal of sunset yellow dye by biopolymers functionalized with (3-aminopropyltriethoxysilane): analytical investigation via advanced model. J Mol Liq. 2020;312:113395.
- Li G, et al. Partial oxidation strategy to synthesize WS2/WO3 heterostructure with enhanced adsorption performance for organic dyes: synthesis, modelling, and mechanism. Nanomaterials. 2020;10:278.
- Naifar A, et al. Molecular insights into crystal violet removal using natural clay: a statistical physics and PSD/AED analysis within the grand canonical ensemble framework. Chemistry Africa. 2025;8(4):1611-25.
- Yahia MB, Manel BY. Physico-chemical study of complexation of silver ion (Ag+) by macrocyclic molecules (hexa-Helicenes) based on statistical physics theory: new description of a cancer drug. Sci Rep. 2020;10:10328.
- Sellaoui L, Sghaier N, Erto A. Outstanding adsorption of Reactive Red 2 and Reactive Blue 19 dyes on MIL-101(Cr): novel physicochemical analysis of underlying mechanism through statistical physics modeling. Water. 2025;17(11):1665.
- Yahia MB, et al. Modeling of adsorption isotherms of zinc nitrate on a thin layer of porphyrin. J Mol Liq. 2016;222:576-85.
- Sousa D, et al. Reuse of drinking water treatment sludge for the removal of antibiotics: the case study of sulfamethoxazole and trimethoprim based on advanced statistical physics models. J Hazard Mater Adv. 2025;18:100737.
- Dotto GL, et al. Adsorption of perfluorooctanoic carboxylic and heptadecafluorooctane sulfonic acids via magnetic chitosan: isotherms and modeling. Environ Sci Pollut Res. 2023;30(56):118410-7.
- Sellaoui L, et al. A novel application of HKUST-1 for textile dyes removal in single and binary solutions: experimental investigation combined with physical modelling. Chem Eng J. 2024;480:147958.
- Edi-Soetaredjo F, et al. Highlighting the single and binary adsorption mechanism of amoxicillin and doripenem on copper benzene-1,3,5-tricarboxylate MOF via experiments, characterization, statistical physics modelling and DFT simulation. Chem Eng J. 2023;474:145633.
- Sellaoui L, et al. A multilayer adsorption of perfluorohexanesulfonic and perfluorobutanesulfonic acids on bio-based polyurethane/chitosan foam: advanced interpretation of the adsorption mechanism. Chem Eng J. 2024;489:151173.
- Ghorbali R, et al. Adsorption of phenolic compounds on polymeric ionic liquids: adsorption isotherms interpretation and thermodynamic study. J Mol Liq. 2024;414:126155.
- Mabrouki N, et al. Adsorption of Eriochrome Black T on apatite silicates: steric and energetic interpretations via theoretical modelling. Chemistry Africa. 2025:1-9.
- Alzahrani E, et al. Isotherm modeling and statistical physics interpretation of dye and pesticide adsorption on activated carbons for environmental remediation. ACS Omega. 2025;10(43):51524-30.
- Nasri K, et al. Adsorption of phenolic pollutants on graphene oxide: steric and energetic interpretations via advanced approach. Chem Pap. 2025:1-11.
- Sellaoui L, et al. Adsorption of pharmaceutical pollutants on activated carbon: physicochemical assessment of the adsorption mechanism via advanced modelling. J Mol Liq. 2023;389:122929.
- Sellaoui L, et al. Adsorptive properties of the pesticides 2,4-D, mecoprop, and dicamba on a pinus-based biochar: conventional and statistical physics evaluation. Chem Eng J. 2023;474:145564.
- Shamsudin MS, et al. Characterization, evaluation, and mechanism analysis of the functionalization of kaolin with a surfactant for the removal of diclofenac from aqueous solution. Chem Eng J. 2023;465:142833.
- Bouzidi M, et al. A comprehensive study on paracetamol and ibuprofen adsorption onto biomass-derived activated carbon through experimental and theoretical assessments. J Mol Liq. 2023;376:121457.
- Yanan C, et al. Adsorption of paracetamol and ketoprofen on activated charcoal prepared from the residue of the fruit of Butia capitata: experiments and theoretical interpretations. Chem Eng J. 2023;454:139943.
- Yanan C, et al. Explaining the adsorption mechanism of the herbicide 2,4-D and the drug ketoprofen onto heat husks Fagopyrum esculentum treated with H2SO4. Chemosphere. 2023;313:137355.
- Sellaoui L, et al. Adsorption of sulfamethoxazole and ciprofloxacin on chitosan foam: isotherms modeling and binding mechanisms. J Phys Chem Solids. 2024;195:112267.
- Matias PM, et al. Efficient removal of sulfonamide and tetracycline antibiotics using triazine-based porous organic polymers. Sep Purif Technol. 2025;355:129731.
- Bouzidi M, et al. Triclosan removal using high-silica zeolites: a novel insight via statistical physics modelling. Sep Purif Technol. 2025;359:130547.
- Bouzidi M, et al. Safety and cytotoxicity study of tetracycline/carbon-based magnetic nanomaterials on cancer treatment. J Drug Deliv Sci Technol. 2025;113:107311.
- Shamsudin MS, et al. Mechanistic insights of diclofenac adsorption on functionalized clay-based adsorptive film: bridging experimental and molecular dynamics findings. Sep Purif Technol. 2025;377:134119.
- Naifar A, et al. In-depth study of captopril adsorption on a biosourced adsorbent: statistical physics approach and pore characterization, with modeling of adsorption isotherms, energetic and steric analysis. Langmuir. 2025;41(25):16115-27.
- Naifar A, et al. Exploring statistical physics principles for superior Pefloxacin extraction from water via halloysite nanotubes: stereographic and topographic evaluation. Microporous Mesoporous Mater. 2025;383:113427.
- Lebron YAR, et al. Statistical physics modeling and optimization of norfloxacin adsorption onto graphene oxide. Colloids Surf A Physicochem Eng Asp. 2020;606:125534.
- Hamid SA, et al. Adsorption of copper (II) cation on polysulfone/zeolite blend sheet membrane: synthesis, characterization, experiments and adsorption modelling. Colloids Surf A Physicochem Eng Asp. 2020;601:124980.
- Sellaoui L, et al. New insights into single-compound and binary adsorption of copper and lead ions on a treated sea mango shell: experimental and theoretical studies. Phys Chem Chem Phys. 2017;19:25927-37.
- Sellaoui L, et al. Equilibrium study of single and binary adsorption of lead and mercury on bentonite-alginate composite: experiments and application of two theoretical approaches. J Mol Liq. 2018;253:160-8.
- Dotto GL, Sellaoui L, Lima EC, Lamine AB. Physicochemical and thermodynamic investigation of Ni(II) biosorption on various materials using the statistical physics modeling. J Mol Liq. 2016;220:129-35.
- Li Z, et al. Interpretation of the adsorption mechanism of Reactive Black 5 and Ponceau 4R dyes on chitosan/polyamide nanofibers via advanced statistical physics model. J Mol Liq. 2019;285:165-70.
- Sellaoui L, et al. Insights of the adsorption mechanism of methylene blue on Brazilian berries seeds: experiments, phenomenological modelling and DFT calculations. Chem Eng J. 2020;394:125011.
- Pang X, et al. Adsorption of crystal violet on biomasses from pecan nutshell, para chestnut husk, araucaria bark and palm cactus: experimental study and theoretical modeling via monolayer and double-layer statistical physics models. Chem Eng J. 2019;378:122101.
- Sboui N, et al. Advanced analysis of the adsorption mechanism of textile pollutant on britholites: modelling via statistical physics. Chemistry Africa. 2024;7(8):4411-24.
- Amrhar O, et al. Removal of methylene blue dye by adsorption onto natural muscovite clay: experimental, theoretical and computational investigation. Int J Environ Anal Chem. 2021:1-26.
- Li Z, et al. Adsorption of ibuprofen on organo-sepiolite and on zeolite/sepiolite heterostructure: synthesis, characterization and statistical physics modeling. Chem Eng J. 2019;371:868-75.
- Sellaoui L, et al. Adsorption of diclofenac and nimesulide on activated carbon: statistical physics modeling and effect of adsorbate size. J Phys Chem Solids. 2017;109:117-23.
- Ghorbali R, et al. In-depth study of adsorption mechanisms and interactions in the removal of pharmaceutical contaminants via activated carbon: a physicochemical analysis. Environ Sci Pollut Res. 2024;31(27):39208-16.