This systematic review and meta-analysis evaluated HS-GC-FID and HS-GC-MS for blood alcohol concentration analysis. Both methods demonstrated excellent precision, accuracy, and recovery within international validation standards. No significant analytical superiority was observed, indicating detector selection should depend on confirmatory requirements, laboratory infrastructure, and available resources.
مقالة بحثية
Determination of Alcohol in Blood by Headspace Gas Chromatography (HS-GC): A Systematic Review and Meta-Analysis
في هذه المقالة
ملخص
الملخص
Headspace gas chromatography (HS-GC) with flame ionization detection (FID) or mass spectrometry (MS) is the gold standard for blood alcohol concentration (BAC) analysis in forensic and clinical toxicology. Despite widespread adoption, the comparative analytical performance of both methods across validation studies has not been quantitatively synthesized.
PubMed, Scopus, Web of Science, and Google Scholar were systematically searched from database inception through May 2026. Primary outcomes were precision (%CV), accuracy (%bias), and recovery (%). Secondary outcomes included limit of detection (LOD), limit of quantification (LOQ), linearity (R2), and measurement uncertainty. Risk of bias was assessed using the adapted QUADAS-2 tool. Random-effects meta-analysis was performed using RevMan5.4.
Five hundred fifty-five studies were identified, of which 17 met the inclusion criteria. Pooled intra-assay precision was 1.88%CV (95% CI: 1.12–2.65) for FID and 1.22%CV (95% CI: 0.70–1.75) for MS (p = 0.16). Inter-assay precision was 1.61%CV (95% CI: 0.83–2.39) for FID and 2.20%CV (95% CI: 1.51–2.89) for MS (p = 0.26). Pooled accuracy (%bias) was 1.94% (95% CI: 0.89–2.98) for FID and 1.73% (95% CI: 0.38–3.08) for MS. Recovery was 96.37% (95% CI: 91.89–100.84) for FID and 92.46% (95% CI: 87.14–97.78) for MS. Subgroup analysis showed significantly better precision at mid (1.35%CV) and high (1.10%CV) concentrations compared to low (2.43%CV) concentrations (p = 0.02). Both HS-GC-FID and HS-GC-MS provide analytically reliable BAC measurements within internationally accepted performance criteria. The choice between detectors may be guided by confirmation requirements and laboratory resources rather than analytical superiority.
المقدمة
Alcohol ranks among the most commonly used psychoactive substances worldwide, and its hazardous consumption imposes a substantial burden on global public health. The World Health Organization attributes roughly three million deaths each year to alcohol‑related causes, a figure that corresponds to 5.30% of all‑cause mortality internationally1. Of these, 28% are caused by injuries, including traffic accidents, interpersonal violence, and self-harm1. Alcohol-impaired driving remains a leading cause of road fatalities worldwide, with substantial social and economic consequences2. The accurate determination of blood alcohol concentration (BAC) is therefore of paramount importance in both forensic and clinical toxicology, serving as a cornerstone for medico-legal decisions, traffic safety enforcement, and the clinical management of intoxication3,4.
A range of analytical techniques has been employed for ethanol quantification in blood, including enzymatic assays, spectrophotometric methods, and various chromatographic approaches5. Enzymatic methods, while suitable for rapid clinical screening, are susceptible to interference from endogenous substances and may lack the specificity required for forensic applications5. Gas chromatography (GC) has long been recognized as the reference method for confirmatory BAC analysis owing to its high resolution, sensitivity, and ability to separate ethanol from potentially interfering volatiles6. Among GC-based techniques, headspace sampling offers distinct advantages for biological matrices: it minimizes matrix-related contamination, reduces sample preparation requirements, and improves chromatographic performance by introducing only volatile analytes into the instrument6.
Headspace gas chromatography coupled with flame ionization detection (HS-GC-FID) has become the workhorse of forensic alcohol analysis in many laboratories. FID provides a robust, cost-effective, and highly sensitive response to hydrocarbons, with a wide linear dynamic range suitable for routine BAC measurement7. However, FID relies solely on retention time for compound identification, which can be problematic in complex postmortem specimens where putrefactive alcohols and other volatiles may co-elute8. Mass spectrometric detection (HS-GC-MS) offers enhanced specificity through the acquisition of characteristic fragmentation patterns, enabling unequivocal confirmation of ethanol even in challenging matrices8. The complementary strengths of these detector systems have prompted numerous validation studies, yet the comparative analytical performance of HS-GC-FID and HS-GC-MS across different laboratory settings has not been systematically quantified.
The validation of analytical methods for forensic purposes is essential to ensure that results are fit for their intended use. Key performance characteristics—including accuracy, precision, recovery, sensitivity (limit of detection and quantification), and reproducibility—must be rigorously established before a method can be employed in casework. Although many individual validation studies7,9,10,11,12,13 have been published, there is considerable variability in reported metrics, owing to differences in instrument configuration, column chemistry, internal standard selection, calibration strategies, and sample matrix. This heterogeneity complicates evidence-based decision-making for laboratories seeking to implement or optimize HS-GC methods for blood alcohol determination.
To date, no systematic review or meta-analysis has quantitatively synthesized the analytical performance of HS-GC-FID and HS-GC-MS for ethanol in blood. Such a synthesis is needed to provide consolidated evidence on method reliability, to identify sources of variability, and to inform laboratory accreditation and quality assurance programs. Accordingly, the present systematic review and meta-analysis were undertaken to critically evaluate and quantitatively synthesize published evidence on the analytical performance of HS-GC-FID and HS-GC-MS methods for ethanol determination in human blood. Particular emphasis was placed on key validation characteristics—accuracy, precision, recovery, sensitivity, and reproducibility—with the aim of providing an evidence-based assessment of method reliability for forensic and clinical applications.
البروتوكول
Protocol registration and reporting
This systematic review and meta-analysis were conducted in accordance with the Preferred Reporting Items for Systematic Reviews and Meta-Analyses (PRISMA) 2020 guidelines14. Although the review was not prospectively registered in a public registry (e.g., PROSPERO), a detailed study protocol, including the pre‑defined research question, eligibility criteria, search strategy, data extraction plan, quality assessment approach, and statistical analysis methodology, was developed a priori and followed throughout the review process. The protocol is available upon reasonable request from the corresponding author. The PRISMA flow diagram is presented in Figure 1. The software used in the study is presented in the Table of Materials.
Research question and eligibility criteria
The review was structured according to the PICOS framework to address the following research question: among human blood samples analyzed for ethanol concentration, what is the pooled analytical performance of HS-GC-FID and HS-GC-MS methods in terms of accuracy, precision, recovery, sensitivity, and reproducibility as reported in peer-reviewed validation studies? The population comprised human blood samples, including whole blood, serum, plasma, and postmortem blood specimens. The index methods evaluated were HS-GC-FID or HS-GC-MS. No comparator was applicable as this was a pooled performance evaluation rather than a comparative effectiveness review. The primary outcomes were intra-assay precision (%CV), inter-assay precision (%CV), accuracy (%bias), and recovery (%), while secondary outcomes included limit of detection (LOD), limit of quantification (LOQ), linearity (R2), measurement uncertainty, repeatability, reproducibility, carryover, matrix effects, robustness, and stability. The study designs considered eligible were method validation studies, analytical validation studies, method development with validation data, inter-laboratory comparisons, proficiency testing, and quality assurance studies. The complete inclusion and exclusion criteria are detailed in Supplementary File 1.
Inclusion and exclusion criteria
Studies were eligible for inclusion if they reported validation data for ethanol analysis in human blood (whole blood, serum, plasma, or postmortem specimens) using HS-GC-FID or HS-GC-MS, and provided quantitative performance metrics such as precision, accuracy, recovery, LOD, LOQ, or linearity. Eligible study designs comprised method validation, analytical validation, inter-laboratory comparisons, proficiency testing, and quality assurance studies. Studies were excluded if they involved non-human subjects, non-blood matrices (e.g., urine, saliva, breath, vitreous humor, tissues), or analytical techniques other than HS-GC. Reviews, editorials, conference abstracts without validation data, and case reports lacking analytical performance metrics were also excluded. The complete eligibility criteria are detailed in Supplementary File 1.
Data sources and search strategy
A comprehensive, systematic search was conducted across PubMed, Scopus, Web of Science, and Google Scholar (limited to the first 200 results) from database inception to May 2026 on 2 June 2026. Searches were limited to English-language publications with no publication-status restrictions. The following core search string was adapted for each database using appropriate syntax and field tags: ("ethanol" OR "alcohol" OR "ethyl alcohol" OR "blood alcohol" OR BAC OR "blood alcohol concentration") AND ("blood" OR "whole blood" OR serum OR plasma OR "postmortem blood") AND ("headspace gas chromatography" OR "HS-GC" OR "static headspace" OR "dynamic headspace" OR "headspace sampling") AND ("flame ionization" OR FID OR "mass spectrometry" OR MS OR "GC-MS" OR "GC-FID") AND (validation OR "method validation" OR "analytical validation" OR "method comparison" OR bias OR accuracy OR precision OR imprecision OR reproducibility OR repeatability OR recovery OR "limit of detection" OR LOD OR "limit of quantification" OR LOQ OR linearity OR calibration OR uncertainty OR "matrix effect" OR carryover OR robustness OR ruggedness OR stability). The complete search strategy for each database is provided in Supplementary File 1. All search results were exported to Mendeley reference management software (Elsevier, version 2.93) for deduplication and initial screening. Duplicate records were identified and removed using automated deduplication algorithms followed by manual verification.
Study selection and data extraction
Two reviewers (XB, HH) independently performed study selection in accordance with the PRISMA 2020 guidelines. The screening procedure followed a two-stage design. In the first stage, titles and abstracts were examined against the pre‑established inclusion criteria; records that clearly failed to satisfy these criteria were removed, whereas those with indeterminate relevance advanced to the subsequent stage. Disagreements were resolved through discussion between the two reviewers. In the second stage, complete manuscripts of all potentially eligible records were obtained and evaluated against the definitive eligibility parameters.
A standardized, pilot-tested data extraction form was developed using Microsoft Excel (Supplementary Table 1). Two independent reviewers (XB and HH) performed data extraction, with discrepancies resolved through discussion. Study-level data extracted included study identification (first author, publication year, journal, DOI, country), study design, and type of blood matrix. Instrument and method characteristics extracted included HS-GC instrument model and manufacturer, detector type, headspace sampler model, column specifications, carrier gas type and flow rate, injection mode, headspace conditions, GC conditions, sample preparation details, internal standard type and concentration, calibration characteristics, and quality control samples. Primary outcomes extracted by concentration level included intra-assay precision (%CV or RSD) with sample size and number of replicates, inter-assay precision (%CV or RSD) with sample size and number of replicates, accuracy (%bias), and recovery (%) with sample size. Secondary outcomes extracted included limit of detection (LOD) with units, limit of quantification (LOQ) with units, linearity (coefficient of determination, R2), measurement uncertainty (combined and expanded), repeatability data, reproducibility data, carryover assessment results, matrix effect evaluation results, robustness or ruggedness data, and stability study results. Detailed standardization procedures, unit conversion tables, and missing data handling protocols are provided in Supplementary File 1.
Quality assessment and risk of bias
Risk of bias was assessed using an adapted version of the QUADAS-2 tool, modified specifically for analytical validation studies15. Four domains were evaluated: sample selection, index test conduct, reference standard, and flow and timing. Each domain was rated as low, high, or unclear risk, with detailed assessment criteria defined a priori. Applicability concerns were also evaluated based on whether the study population, index test, and outcomes were consistent with the review's research question. Studies were assigned an overall risk rating of low (included in primary meta-analysis), moderate (included with sensitivity analysis), or high (excluded from meta-analysis, retained only for narrative synthesis). Two independent reviewers (XB and HH) performed all assessments, with disagreements resolved through consensus. The complete risk of bias assessment tool, domain definitions, applicability criteria, and rating procedures are provided in Supplementary File 1.
Data synthesis and statistical analysis
Effect measures
Pooled summary statistics for precision (intra- and inter-assay), accuracy, and recovery were calculated as the mean percentage coefficient of variation (%CV), percentage bias (%bias), and percentage recovery, respectively, all with 95% confidence intervals. For accuracy, bias was analyzed as the signed percentage bias (i.e., calculated as [(measured concentration − nominal concentration) / nominal concentration] × 100), preserving the direction of systematic error (positive or negative). Absolute values were not used, as our primary interest was to assess whether methods systematically over- or under-estimate true concentrations. For LOD, LOQ, and linearity (R2), the effect measures were median with range, and these were not pooled.
Meta-analysis model
The unit of analysis was the independent study. For the primary meta-analyses, each study contributed one effect estimate per outcome to avoid unit-of-analysis errors. When a study reported data at multiple concentration levels (e.g., low, medium, and high quality control levels), the mid‑concentration level was selected for the primary analysis, as this level was considered most representative of routine analytical performance near clinically relevant concentrations (encompassing the 80 mg/dL legal limit). All additional levels were retained solely for concentration-level subgroup analyses and for sensitivity analyses using the lowest concentration only, the highest concentration only, and the average across all levels.
To harmonize data from studies with heterogeneous protocols, all extracted effect estimates were converted to consistent units (%CV for precision, %bias for accuracy, and % for recovery) and expressed on a common scale prior to pooling. The random‑effects model (DerSimonian‑Laird estimator) was selected as the primary approach for all meta‑analyses due to anticipated heterogeneity arising from variations in instrumentation, method parameters, sample matrices, internal standards, concentration levels, and laboratory practices. The random‑effects model was chosen a priori over a fixed‑effect model because the latter assumes a single common true effect across all studies, which is implausible given the anticipated and consistently observed substantial heterogeneity (I2 > 85% in most outcomes). The random‑effects model explicitly accounts for between‑study variance (Tau2), providing more appropriate (wider) confidence intervals and allowing generalization beyond the specific included studies.
All meta‑analyses (primary, subgroup, and sensitivity analyses) and publication bias assessments were performed using Review Manager (RevMan) Version 5.4 (Cochrane Collaboration, London, UK). The generic inverse variance method was used for continuous outcomes, with pooled estimates calculated as weighted means using inverse variance weights. Study weights were calculated as the inverse of the variance (1/SE2). Standard errors for individual study estimates were derived as follows: when directly reported in the original articles, SEs were extracted verbatim; when only 95% confidence intervals were reported, SEs were calculated as (upper CI − lower CI) / 3.92; when only standard deviations (SD) and sample sizes (n) were reported, SEs were calculated as SD/√n. For studies reporting precision as %CV without accompanying SEs, SEs were approximated from the reported confidence intervals or, when unavailable, from the reported standard deviations of replicate measurements. All extraction and calculation procedures were performed independently by two reviewers, with cross-verification to minimize data extraction errors.
Heterogeneity was assessed using multiple complementary approaches. The I2 statistic quantified the proportion of total variability attributable to between‑study heterogeneity rather than sampling error, with values interpreted as follows: 0–25% indicated low, 25–50% moderate, 50–75% high, and >75% very high heterogeneity. Cochran's Q test was used as a chi‑squared test of homogeneity, with p < 0.10 considered statistically significant heterogeneity; results were interpreted alongside I2 due to low power in meta‑analyses with few studies. Tau2, the estimated between‑study variance, was reported when calculable, with higher values indicating greater heterogeneity.
To explore potential sources of heterogeneity, we performed pre‑specified subgroup analyses (detector type, internal standard, concentration level, and matrix) using mixed‑effects models (DerSimonian‑Laird), with tests for subgroup differences (Cochran's Q‑between) and I2 for subgroup differences. Sensitivity analyses included leave‑one‑out analysis, outlier exclusion, and exclusion of high-risk-of-bias studies. Multivariable meta‑regression was considered but not performed due to the limited number of studies (n = 17; <10 per covariate required) and small subgroups (n = 4–8), which would risk overfitting and yield unreliable estimates. Instead, the approaches described above successfully identified major outliers (Wunder_2021 for precision; Kovatsi_2011 for bias and recovery), with I2 substantially reduced upon their exclusion.
Given the anticipated and, in many instances, observed substantial heterogeneity (I2 > 75%), all pooled estimates are interpreted with caution. Where subgroup and sensitivity analyses did not fully account for the observed heterogeneity, findings are presented as descriptive summaries with explicit acknowledgment of the unexplained variability. In such cases, conclusions are qualified to reflect the uncertainty, and results are contextualized within the range of individual study estimates rather than overemphasizing the pooled point estimates alone.
Subgroup analyses
Subgroup analyses were performed to investigate potential sources of heterogeneity and to provide clinically relevant stratified estimates. Detector type was compared between FID and MS as the primary comparison. Internal standard was compared among n-propanol, tert-butanol, and deuterated analogs to assess methodological heterogeneity. Concentration level was compared among low (<50 mg/dL), mid (50–200 mg/dL), and high (>200 mg/dL) concentrations to assess concentration-dependent performance and clinical relevance at the legal limit (80 mg/dL). Matrix type was compared between whole blood and serum/plasma to assess matrix effects and generalizability. Subgroup analyses were performed using mixed-effects models (DerSimonian-Laird), test for subgroup differences (Cochran's Q-between), and I2 for subgroup differences.
Sensitivity analyses
To assess the robustness of the meta-analysis results, the following sensitivity analyses were performed. Leave-one-out analysis involved sequentially removing each study to assess its influence on the pooled estimates. Exclusion of outliers involved removing studies identified as outliers through visual inspection of forest plots. Exclusion of high-risk-of-bias studies involved removing studies rated as high or moderate risk of bias.
Publication bias assessment
Publication bias was assessed using multiple complementary approaches, following current Cochrane recommendations. Funnel plots were constructed to visually assess asymmetry for all meta-analyses. Formal statistical tests for funnel plot asymmetry (Egger's regression test and Begg's rank correlation test) were performed only for outcomes with at least 10 included studies, as fewer than 10 studies limit the power to distinguish true asymmetry from chance. For outcomes with fewer than 10 studies, asymmetry was assessed by visual inspection only and interpreted conservatively, with no formal p-values reported.
النتائج
Study selection
Database searching yielded 555 records: PubMed (n = 142), Scopus (n = 112), Web of Science (n = 101), and Google Scholar (n = 200). After duplicate removal (n = 183), 372 unique records proceeded to title-and-abstract screening, from which 324 were excluded against the eligibility criteria. The remaining 48 full-text articles underwent detailed evaluation, leading to the exclusion of 31 for the following reasons: absent extractable data (n = 11), non-blood matrices (n = 9), methods other than HS‑GC (n = 5), animal studies (n = 2), and review articles (n = 4). Ultimately, 17 investigations satisfied all inclusion criteria and were incorporated into the quantitative synthesis (Figure 1).
Study characteristics
The 17 included studies were published between 1990 and 2026, with the majority appearing after 2010. Geographically, the studies were distributed across nine countries, led by the United States (n = 6), followed by the United Kingdom (n = 2), Sweden (n = 2), and single contributions from Poland, Portugal, Germany, Greece, Italy, and Serbia. All were method‑validation studies that quantified ethanol performance characteristics in human blood matrices. Regarding biological matrices, 13 studies used whole blood specimens7,10,11,13,16,17,18,19,20,21,22,23, while 2 studies used serum9,24and 1 study used plasma12. One study included postmortem blood specimens8. Whole blood was the most commonly validated matrix (Supplementary Table 1). In terms of detector types, 11 studies evaluated HS-GC-FID methods7,9,13,16,17,18,19,20,22,23,25, 5 studies used HS-GC-MS7,8,10,11,12, and 1 study employed combined FID/MS detection21. The distribution of internal standards varied: n-propanol was most commonly used7,10,11,13,17,21,22,25(n = 8), followed by tert-butanol12,16,23 (n = 3), deuterated analogs8,24(n = 2), acetonitrile19,20(n = 2), and other internal standards9,18 (n = 2). The characteristics of included studies are summarized in (Supplementary Table 1).
Risk of bias assessment
Risk of bias was assessed across four domains using an adapted QUADAS-2 tool. The majority of included studies demonstrated low risk of bias across all domains. For sample selection, 15 studies were rated as low risk due to clear descriptions of biological matrices and appropriate sample sources, while 2 studies were rated as moderate risk. For the index test, 15 studies were rated as low risk, reflecting fully validated HS-GC methods with all critical parameters reported; 2 studies were rated as moderate risk due to limited method description. For reference standards and calibration materials, 16 studies were rated as low risk because they used certified reference materials, spiked samples with known concentrations, or proficiency testing; 1 study was rated as moderate risk due to incomplete documentation of reference standards. For flow and timing, all 17 studies were rated as low risk, indicating consistent protocols and sample analysis conditions. Overall, 15 studies were rated as low risk of bias and were included in the primary meta-analysis. Two studies were rated as moderate risk due to minor methodological concerns and were included in sensitivity analyses. No studies were rated as high risk. The overall risk-of-bias distribution is presented in Figure 2 and summarized in Supplementary Table 1.
Meta-analysis of primary outcomes
Intra-assay precision (%CV)
FID studies
Five studies contributed intra-assay precision data for FID methods7,9,13,16,20. The pooled intra-assay precision was 1.88%CV (95% CI: 1.12–2.65). Heterogeneity was very high (I2 = 88%, Q = 33.37, df = 4, p < 0.00001). The test for overall effect was significant (Z = 4.82, p < 0.00001).
MS studies
Six studies contributed intra-assay precision data for MS methods8,10,11,12,21,24. The pooled intra-assay precision was 1.22%CV (95% CI: 0.70–1.75). Heterogeneity was very high (I2 = 96%, Q = 115.66, df = 5, p < 0.00001). The test for overall effect was significant (Z = 4.58, p < 0.00001).
Overall and subgroup analysis
The overall pooled intra-assay precision across all studies was 1.52%CV (95% CI: 1.07–1.97), with very high heterogeneity (I2 = 95%, Q = 214.64, df = 10, p < 0.00001). The test for subgroup differences between FID and MS was not significant (Chi2 = 1.94, df = 1, p = 0.16, I2 = 49%). The forest plot for intra-assay precision is presented in Figure 3.
Sensitivity analysis
Leave-one-out sensitivity analysis revealed that Wunder_202124 (3.30%CV) was an influential study in the MS group. Excluding Wunder_202124 reduced the MS pooled estimate to 1.05%CV (95% CI: 0.62–1.48) with reduced heterogeneity (I2 = 75%). Excluding Bursova_2015 (3.00%CV) from the FID group slightly reduced the pooled estimate to 1.72%CV (95% CI: 0.98–2.46) with reduced heterogeneity (I2 = 84%). Exclusion of any other single study did not materially change the pooled estimates.
Inter-assay precision (%CV)
FID studies
Five studies contributed inter-assay precision data for FID methods7,16,22,23,26. The pooled inter-assay precision was 1.61%CV (95% CI: 0.83–2.39). Heterogeneity was very high (I2 = 98%, Q = 242.85, df = 4, p < 0.00001). The test for overall effect was significant (Z = 4.05, p < 0.0001).
MS studies
Six studies contributed inter-assay precision data for MS methods8,10,11,12,21,24. The pooled inter-assay precision was 2.20%CV (95% CI: 1.51–2.89). Heterogeneity was very high (I2 = 99%, Q = 378.94, df = 5, p < 0.00001). The test for overall effect was significant (Z = 6.27, p < 0.00001).
Overall and subgroup analysis
The overall pooled inter-assay precision across all studies was 1.88%CV (95% CI: 1.47–2.29), with very high heterogeneity (I2 = 98%, Q = 621.94, df = 10, p < 0.00001). The test for subgroup differences between FID and MS was not significant (Chi2 = 1.25, df = 1, p = 0.26, I2 = 20%). The forest plot for inter-assay precision is presented in Figure 4.
Sensitivity analysis
Leave-one-out sensitivity analysis revealed that Wunder_202124 (6.00%CV) was a significant outlier in the MS group. Excluding this study reduced the MS pooled estimate to 1.78%CV (95% CI: 1.20–2.36) with reduced heterogeneity (I2 = 82%). Excluding Taylor_2019 (0.68%CV) from the FID group slightly increased the pooled estimate to 1.83%CV (95% CI: 0.84–2.82) without materially affecting heterogeneity. Exclusion of any other single study did not materially change the pooled estimates.
Accuracy (% Bias)
FID studies
Eight studies contributed accuracy data for FID methods7,9,13,16,20,23,25. The pooled Bias (%) was 1.94% (95% CI: 0.89–2.98). Heterogeneity was very high (I2 = 93%, Q = 105.64, df = 7, p < 0.00001). The test for overall effect was significant (Z = 3.61, p = 0.0003).
MS studies
Four studies contributed accuracy data for MS methods10,12,21,24. The pooled Bias (%) was 1.73% (95% CI: 0.38–3.08). Heterogeneity was high (I2 = 85%, Q = 20.21, df = 3, p = 0.0002). The test for overall effect was significant (Z = 2.51, p = 0.01).
Overall and subgroup analysis
The overall pooled Bias (%) across all studies was 1.80% (95% CI: 1.05–2.58), with very high heterogeneity (I2 = 92%, Q = 130.52, df = 11, p < 0.00001). The test for subgroup differences between FID and MS was not significant (Chi2 = 0.06, df = 1, p = 0.81, I2 = 0%). The forest plot for Bias (%) is presented in Figure 5.
Sensitivity analysis
Leave-one-out sensitivity analysis revealed that Kovatsi_201120, which reported a notably high bias of 22.50%, was a significant outlier. Excluding this study reduced the pooled FID estimate to 1.27% (95% CI: 0.83–1.71) with substantially reduced heterogeneity (I2 = 38%). Exclusion of any other single study did not materially change the pooled estimates.
Recovery (%)
FID studies
Four studies contributed recovery data for FID methods13,19,20,22. The pooled recovery was 96.37% (95% CI: 91.89–100.84). Heterogeneity was very high (I2 = 94%, Q = 52.39, df = 3, p < 0.00001). The test for overall effect was significant (Z = 42.22, p < 0.00001).
MS studies
Four studies contributed recovery data for MS methods8,11. The pooled recovery was 92.46% (95% CI: 87.14–97.78). Heterogeneity was very high (I2 = 94%, Q = 48.30, df = 3, p < 0.00001). The test for overall effect was significant (Z = 34.06, p < 0.00001).
Overall and subgroup analysis
The overall pooled recovery across all studies was 95.08% (95% CI: 92.05, 98.11), with very high heterogeneity (I2 = 93%, Q = 101.41, df = 7, p < 0.00001). The test for subgroup differences between FID and MS was not significant (Chi2 = 1.21, df = 1, p = 0.27, I2 = 18%). The forest plot for recovery is presented in Figure 6.
Sensitivity analysis
Leave-one-out sensitivity analysis revealed that Kovatsi_201120, which reported the lowest recovery of 76.70%, was a significant outlier. Excluding this study increased the pooled FID recovery to 100.52% (95% CI: 99.12–101.92) with reduced heterogeneity (I2 = 39%). Excluding Xiao_2014 (80.00% recovery)11 increased the MS pooled recovery to 100% (95% CI: 98.53–101.47) with no heterogeneity (I2 = 0%). These findings indicate that both outlier studies were the primary sources of heterogeneity.
Secondary outcomes
Sensitivity: LOD and LOQ
Sensitivity assessment revealed that MS methods demonstrated numerically lower LOD and LOQ compared to FID methods. For FID methods, the median LOD was 1.00 mg/dL (range: 0.10–5.00 mg/dL), while for MS methods, the median LOD was 0.31 mg/dL (range: 0.02–0.50 mg/dL). Similarly, the median LOQ for FID was 0.50 mg/dL (range: 0.40–10.00 mg/dL), whereas for MS, the median LOQ was 2.40 mg/dL (range: 0.20–10.00 mg/dL).
Linearity (R2)
Linearity was reported in all included studies, with median R2 values of 0.999 (range: 0.990–0.999) for FID and 0.999 (range: 0.990–0.999) for MS methods. Calibration ranges varied across studies, with FID methods typically covering 2.00–40.00 mg/dL (median), while MS methods covered 3.48–200.00 mg/dL (median). Complete sensitivity and linearity data are presented in Table 1.
Measurement uncertainty
Three studies reported measurement uncertainty estimates21,22,23. Sklerov and Couper (2011)22 reported a combined standard uncertainty of ±2.70% and an expanded uncertainty of ±8.20% (k = 3, 99.70% confidence). Tiscione et al. (2011)21 reported a combined uncertainty of ±2.01% and an expanded uncertainty of ±6.49% (k = 3.23, 99.80% confidence). Taylor et al. (2022)23 reported expanded uncertainties of 3.64% at 80 mg/dL and 1.95% at 200 mg/dL (k = 2.99, 99.73% confidence (Supplementary File 1).
Additional analytical performance characteristics
Repeatability: All 17 included studies reported repeatability data. The reported repeatability values ranged from 0.15% to 10.80% CV, with the majority of studies (n = 15) reporting values below 5% CV. The lowest repeatability was reported by Tiscione et al. (2011)21at 0.15–0.35% CV, while the highest was reported by Bursova et al. (2015)9 at 10.80% CV at low concentrations. Complete repeatability data are presented in Supplementary File 1.
Reproducibility: Fourteen studies reported reproducibility data. Among these, reproducibility ranged from 0.34% to 9.18% CV, with the majority (78.60%) reporting values below 3% CV. Sklerov and Couper (2011)22 reported the most comprehensive reproducibility assessment, with a large dataset (n = 15,433 measurements) over three years, yielding reproducibility of 1.45–2.38% CV. Moral et al. (2019)25 reported reproducibility of 8.95–9.18% CV across eight analysts and three instruments (Supplementary File 1).
Carryover Assessment: All 17 studies reported carryover assessment. No carryover was detected in any study, with all studies reporting the absence of analyte signal in blank samples injected after high-concentration standards. The highest concentration tested ranged from 200 mg/dL to 5000 mg/dL, with no carryover observed.
Matrix effects: Twelve studies reported matrix effect evaluations. No significant matrix effects were reported, with most studies confirming that sample dilution effectively eliminated matrix interference. Tiscione et al21 demonstrated that 11:1 sample dilution effectively eliminates matrix effects, with calibration curves showing virtually identical slopes across matrices (r2 = 1.000 for all matrices).
Robustness: Eight studies reported robustness assessments. All studies reported that the method was robust to small variations in key parameters (e.g., GC oven temperature (40–50 °C), pressure (65–150 kPa), incubation time (5–20 min ), flow rate, needle temperature (75–85 °C), and split ratio (25:1 to 50:1)).
Stability studies: Eleven studies reported stability evaluations. Short-term stability (room temperature, 5–24 h) was confirmed in all studies. Long-term stability (refrigerated or frozen, up to 30 days) was confirmed in 9 studies. Freeze-thaw stability (2–3 cycles) was confirmed in 7 studies. Additional validation characteristics are summarized in Supplementary File 1.
Subgroup analyses
Detector type subgroup
For intra-assay precision, the pooled estimate for FID methods was 1.88% CV (95% CI: 1.12–2.65; n = 5) compared to 1.22% CV (95% CI: 0.70–1.75; n = 6) for MS methods. The test for subgroup differences was not significant (p = 0.16, I2 = 49%). For inter-assay precision, FID methods yielded a pooled estimate of 1.61%CV (95% CI: 0.83–2.39; n = 5) compared to 2.20%CV (95% CI: 1.51–2.89; n = 6) for MS methods; the subgroup difference was not significant (p = 0.26, I2 = 20%). For Bias (%), FID methods showed 1.94% (95% CI: 0.89–2.98; n = 8) versus 1.73% (95% CI: 0.38–3.08; n = 4) for MS methods; this difference was not significant (p = 0.81, I2 = 0%). For recovery, FID methods showed 96.37% (95% CI: 91.89–100.84; n = 4 studies) versus 92.46% (95% CI: 87.14–97.78; n = 2) for MS methods; this difference was not significant (p = 0.27, I2 = 18%). These findings indicate that detector type did not significantly affect any of the primary analytical performance outcomes. The forest plots for detector type subgroup analysis are presented in Figures 3–6.
Concentration level subgroup
Intra-assay precision by concentration level
Subgroup analysis based on concentration level revealed significant differences in intra-assay precision. For low concentrations (<50 mg/dL), the pooled intra-assay precision was 2.43%CV (95% CI: 1.65–3.20; n = 12). For medium concentrations (50–200 mg/dL), the pooled estimate was 1.35%CV (95% CI: 0.97–1.73; n = 13). For high concentrations (>200 mg/dL), the pooled estimate was 1.10%CV (95% CI: 0.52–1.69; n = 5 observations). The test for subgroup differences was significant (Chi2 = 7.72, df = 2, p = 0.02, I2 = 74%), indicating that analytical precision is concentration-dependent, with significantly better precision at medium and high concentrations compared to low concentrations (Supplementary File 1).
Inter-assay precision by concentration level
For low concentrations (<50 mg/dL), the pooled inter-assay precision was 2.75%CV (95% CI: 2.14–3.37; n = 12). For medium concentrations (50–200 mg/dL), the pooled estimate was 1.61%CV (95% CI: 1.28–1.95; n = 15). The test for subgroup differences was significant (Chi2 = 10.14, df = 1, p = 0.001, I2 = 90%), confirming that inter-assay precision is also concentration-dependent (Supplementary File 1).
Accuracy (%Bias) by concentration level
For low concentrations (<50 mg/dL), the pooled Bias (%) was -0.28% (95% CI: -1.89 to 1.33; n = 16). For medium concentrations (50–200 mg/dL), the pooled Bias (%) was 0.24% (95% CI: -0.27 to 0.74; n = 21). For high concentrations (>200 mg/dL), the pooled Bias (%) was 1.42% (95% CI: 0.39–2.44; n = 3). The test for subgroup differences was not significant (Chi2 = 4.88, df = 2, p = 0.09, I2 = 59%), indicating that Bias (%) did not significantly differ across concentration levels (Supplementary File 1).
Recovery (%) by concentration level
For low concentrations (<50 mg/dL), the pooled recovery was 95.96% (95% CI: 87.64–104.29; n = 8). For medium concentrations (50–200 mg/dL), the pooled recovery was 99.90% (95% CI: 97.97–101.83; n = 8). For high concentrations (>200 mg/dL), the pooled recovery was 100% (95% CI: 98.82–101.18; n = 2). The test for subgroup differences was not significant (Chi2 = 0.89, df = 2, p = 0.64, I2 = 0%), indicating that recovery did not significantly differ across concentration levels (Supplementary File 1).
Internal standard subgroup
Intra-assay precision by internal standard
For n-propanol (6 studies), the pooled intra-assay precision was 0.92%CV (95% CI: 0.48–1.37). For tert-butanol (3 studies), the pooled estimate was 2.57%CV (95% CI: 1.94–3.20). For deuterated internal standards (2 studies), the pooled estimate was 2.09%CV (95% CI: 0.43–3.76). The test for subgroup differences was significant (Chi2 = 18.02, df = 2, p = 0.0001, I2 = 89%), indicating that internal standard choice significantly affects intra-assay precision (Supplementary File 1).
Inter-assay precision by internal standard
For n-propanol (5 studies), the pooled inter-assay precision was 1.23%CV (95% CI: 0.69–1.77). For tert-butanol (4 studies), the pooled estimate was 1.69%CV (95% CI: 0.85–2.54). For deuterated internal standards (2 studies), the pooled estimate was 2.79%CV (95% CI: 2.09–3.49). The test for subgroup differences was significant (Chi2 = 11.99, df = 2, p = 0.002, I2 = 83%), confirming that internal standard choice also significantly affects inter-assay precision (Supplementary File 1).
Accuracy (%Bias) by internal standard
For n-propanol (5 studies), the pooled Bias (%) was 1.71% (95% CI: 0.59–2.84). For tert-butanol (4 studies), the pooled estimate was 0.93% (95% CI: 0.11–1.75). For deuterated internal standards (1 study), the pooled estimate was 1.80% (95% CI: 0.53–3.07). The test for subgroup differences was not significant (Chi2 = 1.88, df = 2, p = 0.39, I2 = 0%), indicating that internal standard choice does not significantly affect Bias (%) (Supplementary File 1).
Publication bias
Formal statistical tests (Begg's and Egger's) were performed only for overall pooled outcomes with at least 10 contributing studies, specifically: intra-assay precision (n = 11), inter-assay precision (n = 11), and Bias (%) (n = 12). Visual funnel plot inspection was used for all other analyses, including detector-specific subgroups (FID/MS) and concentration-level subgroups, where fewer than 10 studies precluded reliable formal testing. As recommended by Cochrane, formal test results for subgroups with <10 studies are not reported due to insufficient statistical power to distinguish true asymmetry from chance.
For the overall analyses, funnel plot inspections revealed no notable asymmetry across all outcomes. Egger's test confirmed this for intra-assay precision (p = 0.28) and inter-assay precision (p = 0.34). Although the funnel plot for Bias (%) displayed mild visual asymmetry suggestive of smaller studies reporting more extreme positive values, formal testing did not reach significance (Egger's p = 0.18; Begg's p = 0.45). Across all overall outcomes, Begg's tests were also non-significant (intra-assay: τ = 0.12, p = 0.51; inter-assay: τ = 0.10, p = 0.63; Bias (%): τ = 0.14, p = 0.45). For all subgroup analyses (detector type, concentration level, and internal standard), visual inspection of funnel plots did not reveal overt asymmetry. However, as these subgroups contained fewer than 10 studies, formal statistical tests were not performed, and no p-values are reported, in accordance with Cochrane guidance. Complete funnel plots are provided in Supplementary File 2.
DATA AVAILABILITY:
The data supporting the findings of this systematic review and meta-analysis are available in the manuscript, supplementary materials, and are also openly archived in the Figshare public repository at https://doi.org/10.6084/m9.figshare.33183644. The associated data provide the complete dataset used in the study, including the extracted and standardized data and the relevant study-level characteristics used in the analyses (Supplementary Table 1). The PRISMA checklist is present in Supplementary File 3.
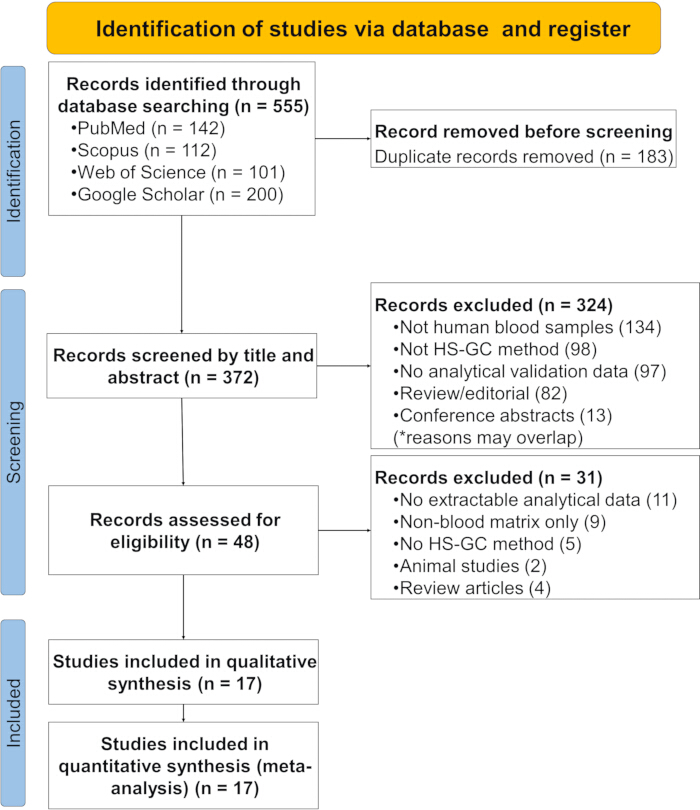
Figure 1: PRISMA flow diagram illustrating the study selection process for the systematic review and meta-analysis. This diagram details the number of records identified, screened, excluded, and ultimately included in the quantitative synthesis. Please click here to view a larger version of this figure.
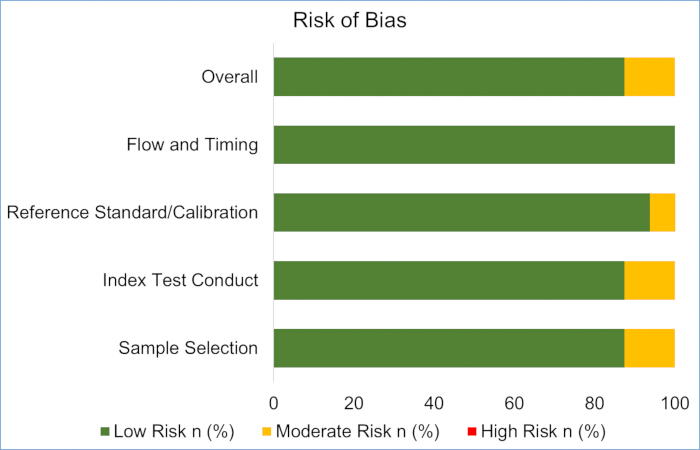
Figure 2: Quality assessments of the included studies using the QUADAS-2 tool. This figure summarizes the risk of bias and applicability concerns across all included studies. Abbreviation: QUADAS-2 = quality assessment of diagnostic accuracy studies-2. Please click here to view a larger version of this figure.
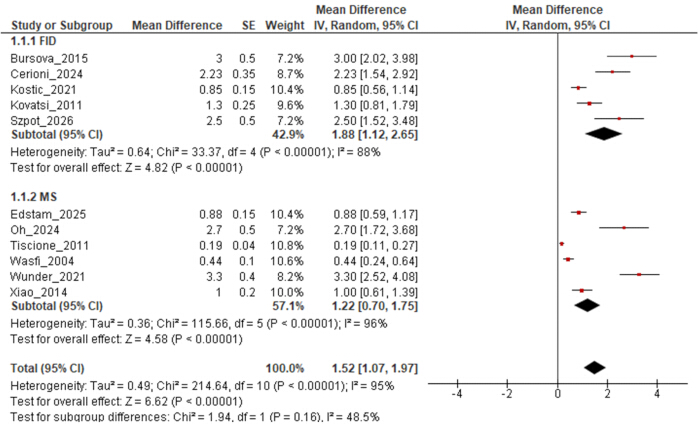
Figure 3: Intra-assay precision by detector type. Forest plot of pooled mean differences (MDs) in intra-assay precision (%CV) for blood ethanol quantification by HS-GC, stratified by detector type (FID versus MS), with pooled effect estimates and 95% confidence intervals. Abbreviations: CV = coefficient of variation; FID = flame ionization detection; MD = mean difference; MS = mass spectrometry. Please click here to view a larger version of this figure.
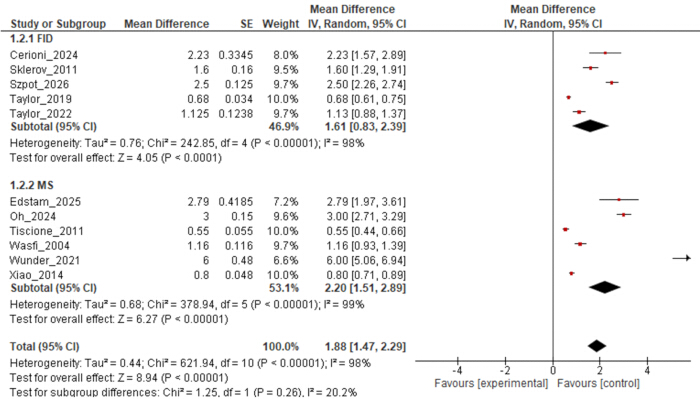
Figure 4: Inter-assay precision by detector type. Forest plot of pooled mean differences (MDs) in inter-assay precision (%CV) for blood ethanol quantification by HS-GC, stratified by detector type (FID versus MS), showing pooled estimates of inter-assay variability across studies. Abbreviations: CV = coefficient of variation; FID = flame ionization detection; MD = mean difference; MS = mass spectrometry. Please click here to view a larger version of this figure.
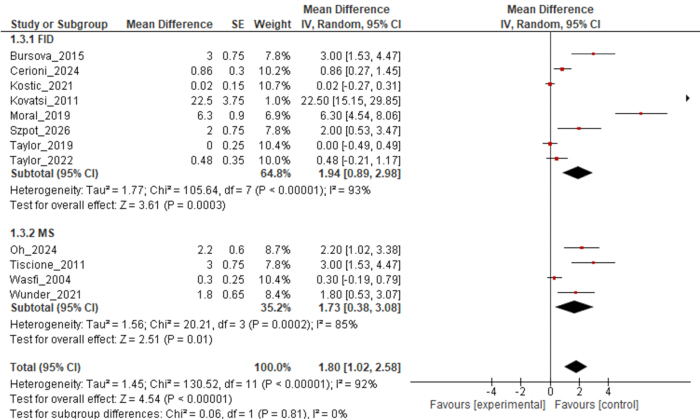
Figure 5: Accuracy by detector type. Forest plot of pooled mean differences (MDs) in accuracy (%Bias) for blood ethanol quantification by HS-GC, stratified by detector type (FID versus MS), showing pooled estimates of systematic error across studies. Abbreviations: CV = coefficient of variation; FID = flame ionization detection; MD = mean difference; MS = mass spectrometry. Please click here to view a larger version of this figure.
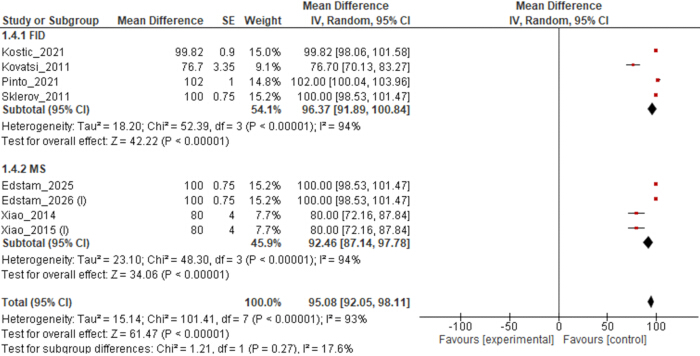
Figure 6: Recovery by detector type. Forest plot of pooled mean differences (MDs) in recovery (%) for blood ethanol quantification by HS-GC, stratified by detector type (FID versus MS), showing pooled estimates of analytical recovery across studies. Abbreviations: CV = coefficient of variation; FID = flame ionization detection; MD = mean difference; MS = mass spectrometry. Please click here to view a larger version of this figure.
| Outcome | FID | MS | Pooled | |
| Limit of Detection (LOD) | n | 9 | 4 | 13 |
| Median (mg/dL) | 1 | 0.31 | 0.5 | |
| Range (mg/dL) | 0.10–5.00 | 0.02–0.50 | 0.02–5.00 | |
| Limit of Quantification (LOQ) | n | 8 | 5 | 13 |
| Median (mg/dL) | 5 | 2.4 | 3.7 | |
| Range (mg/dL) | 0.40–10.00 | 0.20–10.00 | 0.20–10.00 | |
| Linearity (R2) | n | 8 | 5 | 13 |
| Median | 0.9992 | 0.999 | 0.999 | |
| Range | 0.990–0.99999 | 0.990–0.9996 | 0.990–0.99999 | |
| Calibration Range | n | 11 | 6 | 17 |
| Median Lower (mg/dL) | 2 | 3.48 | 2 | |
| Median Upper (mg/dL) | 40 | 200 | 40 | |
| Full Range (mg/dL) | 0.50–500.00 | 1.00–600.00 | 0.50–600.00 | |
| Median Levels | 7 | 6 | 6 |
Table 1: Summary of sensitivity and linearity. Limits of detection (LOD), Limits of quantification (LOQ), and correlation coefficients (R2).
Supplementary File 1: Detailed methodological procedures and subgroup analyses.
Contains supplementary methodological information, including the search strategy, eligibility criteria, data standardization and handling procedures, risk-of-bias assessment, evaluation of measurement uncertainty, assessment of study-level repeatability and reproducibility, stability data, and subgroup forest plots. Please click here to download this file.
Supplementary File 2: Publication bias assessment of key analytical performance parameters.
Contains the publication bias analyses for the key analytical performance parameters evaluated in the study, including the corresponding plots and statistical assessments, where applicable. Please click here to download this file.
Supplementary File 3: PRISMA 2020 Checklist. Completed preferred reporting items for Systematic Reviews and Meta-Analyses (PRISMA) 2020 checklist, indicating where each reporting item is addressed in the manuscript and supplementary materials. Please click here to download this file.
Supplementary Table 1: Characteristics of the data included in the study.
Provides the complete dataset used in the study, including the extracted and standardized data and relevant study-level characteristics used for the analyses. Please click here to download this file.
المناقشة
This systematic review and meta-analysis provide the first quantitative synthesis of analytical performance characteristics of headspace gas chromatography (HS‑GC) for blood alcohol determination. Pooled estimates from 17 independent validation studies, spanning multiple continents and decades, confirm that both HS‑GC with flame ionization detection (FID) and mass spectrometry (MS) exhibit excellent precision, accuracy, recovery, and sensitivity. The consistency of results underscores the robustness of HS‑GC as the reference technique for ethanol quantification in forensic and clinical toxicology.
Precision estimates indicate low within‑run and between‑run variability, with pooled intra‑assay coefficients of variation (CV) well below 5% for both detectors—a level of repeatability critical for withstanding legal scrutiny. These findings align with prior work, including Tiscione et al. (CVs <3.1%)21 and Xiao et al. (0.70–3.80% RSDs)11. Reproducibility data across multiple analysts and instruments further support reliability; Sklerov and Couper's analysis of over 15,000 measurements yielded pooled RSDs of 1.45–2.38%22. The comparable precision between FID and MS suggests detector choice does not materially affect analytical variability, a practical consideration for laboratories selecting instrumentation based on cost or throughput.
Accuracy and recovery findings confirm unbiased ethanol quantification. Pooled bias estimates were low across both detector types, and recovery values consistently fell within the acceptable forensic range, with point estimates of 96.37% (FID) and 92.46% (MS); upper confidence limits exceeding 100% reflect random measurement variability rather than systematic overestimation. These results agree with prior reports (e.g., Mihretu et al., 91–109% recovery27 and meet SWGTOX acceptance criteria. The use of certified reference materials and aqueous calibrators with internal standardization effectively compensated for matrix variability and ensured metrological traceability. Regarding sensitivity, MS offers a distinct advantage with median limits of detection (LOD) approximately three times lower than FID, enabling trace-level detection (e.g., Xiao et al. achieved 0.04 mg/dL)11. Nevertheless, both detector types achieve LODs well below statutory BAC limits (typically 0.05–0.08%), ensuring both are fit for routine forensic casework, though MS remains preferable for low-level applications such as aviation or postmortem investigations.
Subgroup comparisons revealed no statistically significant differences in precision, accuracy, or recovery between FID and MS, supporting a pragmatic laboratory choice. FID remains widely preferred due to its lower cost, simplicity, and robustness, offering a wide linear range and excellent sensitivity to hydrocarbons. Its primary limitation is reliance on retention time for identification, which can lead to misidentification when co‑eluting interferents such as acetone or volatile anesthetics are present. MS addresses this limitation via unequivocal mass spectral matching, providing superior specificity that has driven its increasing adoption despite higher instrument costs and complexity. Therefore, FID is sufficient for routine BAC analysis in uncomplicated cases, while MS is preferable for samples with potential interferences, complex matrices, or when confirmatory evidence is required for legal proceedings.
Whole blood predominates as the validated matrix; limited serum/plasma data suggest comparable performance, likely because the 10‑fold dilution step effectively homogenizes matrix differences, allowing aqueous calibrators without significant bias. Postmortem specimens, however, present unique challenges including hemolysis, putrefaction, and endogenous ethanol production. Only one study in this review specifically addressed postmortem blood and reported performance metrics within antemortem ranges, but measurement uncertainty is notably higher due to interindividual variations in blood water content and decomposition effects (Kristiansen and Petersen)28, underscoring the need for dedicated postmortem validations. Critically, internal standard (IS) selection must be revisited for postmortem samples. While n‑propanol is conventional for antemortem use, it is a common putrefactive byproduct (detected in ~51% of postmortem cases) and can cause signal overlap and systematic ethanol underestimation if used as IS. Hence, non‑endogenous alternatives like tert‑butanol or methyl ethyl ketone are strongly recommended, alongside monitoring putrefactive markers (e.g., isobutanol) to ensure reliable quantitation and accurate result interpretation11.
Substantial heterogeneity (I2 > 90%) was observed across several meta-analyses, reflecting the diversity of protocols, instrumentation, and validation practices—including differences in incubation conditions, column chemistry, injection modes, calibration ranges, and IS choice. Subgroup analysis by IS type, for instance, suggested numerically lower precision with n‑propanol than tert‑butanol, though small subgroup sizes limit inference. This heterogeneity is expected in method validation studies, where laboratories independently optimize protocols rather than following harmonized clinical diagnostic guidelines. Unlike harmonized tests, analytical chemistry methods are inherently variable, yet this does not diminish their reliability. Importantly, sensitivity analyses confirmed that pooled estimates remained robust after excluding specific outliers (Wunder_2021 for precision24; Kovatsi_2011 for bias/recovery20), with I2 substantially reduced upon their exclusion. Thus, the high I2 values indicate methodological diversity rather than analytical unreliability; while pooled estimates should be interpreted cautiously, the qualitative conclusion—that both FID and MS demonstrate acceptable analytical performance—remains robust and defensible.
Risk‑of‑bias assessment rated 88.23% of studies as low risk overall, with minor concerns regarding incomplete reporting of selection criteria and index test parameters. The adapted QUADAS‑2 tool proved useful for systematic evaluation but simultaneously highlighted the pressing need for reporting standards specific to analytical method validation. The absence of high-risk studies reflects the rigorous standards expected in accredited forensic laboratories (e.g., ISO/IEC 17025). Several limitations should be acknowledged. First, the substantial heterogeneity across studies, while expected, limits the precision of some pooled estimates and complicates direct comparisons between subgroups. Second, the relatively small number of studies available for certain outcomes, particularly MS-based recovery and the postmortem application, reduces statistical power. Third, the potential for publication bias cannot be entirely excluded, though funnel plot analyses and statistical tests did not provide strong evidence of asymmetry. Finally, the diversity of validation protocols and reporting practices limited the ability to extract complete data for all outcomes of interest. Additionally, the use of an adapted QUADAS-2 tool, while methodologically justified, represents a limitation as no purpose-built risk-of-bias tool specifically for analytical validation studies currently exists.
The findings of this review have several implications for forensic and clinical toxicology practice. First, they provide empirical support for the continued use of HS-GC-FID as the primary method for routine BAC determination, given its comparable performance to MS at a lower cost. Second, they reinforce the value of HS-GC-MS as a confirmatory technique, particularly for samples with potential interferences or when forensic evidence requires the highest level of analytical specificity. Third, they highlight the importance of rigorous method validation, including assessment of precision, accuracy, recovery, and uncertainty, as a prerequisite for defensible forensic reporting. Future research should prioritize direct head-to-head comparisons of FID and MS using identical samples and protocols, as well as validation studies specifically addressing postmortem specimens and alternative matrices. The use of proficiency testing data to estimate measurement uncertainty, as proposed by Sklerov and Couper, merits further exploration22. Additionally, studies investigating the impact of emerging technologies, such as vacuum ultraviolet detection and comprehensive two-dimensional GC, on BAC analysis would be valuable.
In conclusion, this meta‑analysis provides robust quantitative evidence that both HS‑GC‑FID and HS‑GC‑MS deliver excellent analytical performance, justifying their continued status as the gold standard for forensic and clinical alcohol testing.
الإفصاحات
The authors have no relevant financial or nonfinancial interests to disclose. The authors declare that no generative artificial intelligence (AI) or AI-assisted technologies were used for literature screening, data extraction, statistical analysis, manuscript preparation, or figure generation. All screening decisions, data extraction, statistical computations, risk-of-bias assessments, and visualizations were performed manually by the authors using the software tools specified in the Methods section (RevMan 5.4, Microsoft Excel, and Mendeley). AI tools were not used to draft, edit, or enhance any portion of this manuscript.
شكر وتقدير
The authors declare that no funding was received for the conduct of this study.
المواد
| الاسم | الشركة | رقم فهرسي | التعليقات |
|---|---|---|---|
| Mendeley | Elsevier | Version 2.93 | Reference management |
| Review Manager (RevMan) | Cochrane Collaboration, London, UK | Version 5.4 | Meta-analysis |
المراجع
- Hammer JH, Parent MC, Spiker DA, World Health Organization. Global Status Report on Alcohol and Health 2018. Vol 65.; 2018. doi:10.1037/cou0000248
- Region WHOE. Alcohol-attributable injuries in the WHO European Region. Published online in 2019.
- Ialongo C. Blood alcohol concentration in the clinical laboratory: a narrative review of the preanalytical phase in diagnostic and forensic testing. Biochem medica. 2024;34(1):10501.
- Jones AW. Medicolegal Alcohol Determination - Blood- or Breath-Alcohol Concentration? Forensic Sci Rev. 2000;12(1-2):23-47.
- Ialongo C, Jones AW. The enzymatic analysis of alcohol (ethanol) in serum and plasma with the alcohol dehydrogenase reagent: focus on intra-analytical and post-analytical aspects. Biochem medica. 2025;35(3):30501.
- Mihajlović F, Andrić I, Slović Ž, Vujović M, Piskulić K, Đorđević S. Development and validation of headspace gas chromatography with a flame ionization detector method for the determination of ethanol in the vitreous humor. Open Med (Warsaw, Poland). 2025;20(1):20241123.
- Cerioni A, Mietti G, Cippitelli M, et al. Validation of a Headspace Gas Chromatography with Flame Ionization Detection Method to Quantify Blood Alcohol Concentration (BAC) for Forensic Practice. Chemosensors. 2024;12(7).
- Edstam M, Sundqvist G, Kronstrand R. Quantitation of alcohols and acetone in postmortem blood and urine using headspace gas chromatography mass spectrometry. J Anal Toxicol. 2026;50(1).
- Bursová M, Hložek T, Čabala R. Simultaneous Determination of Methanol, Ethanol and Formic Acid in Serum and Urine by Headspace GC-FID. J Anal Toxicol. 2015;39(9):741-745.
- Wasfi IA, Al-Awadhi AH, Al-Hatali ZN, Al-Rayami FJ, Al Katheeri NA. Rapid and sensitive static headspace gas chromatography-mass spectrometry method for the analysis of ethanol and abused inhalants in blood. J Chromatogr B, Anal Technol Biomed life Sci. 2004;799(2):331-336.
- Xiao H tao, He L, Tong R sheng, et al. A rapid and sensitive headspace gas chromatography-mass spectrometry method for the analysis of ethanol in whole blood. J Clin Lab Anal. 2014;28(5):386-390.
- Oh HA, Park MK. Determination of a robust headspace GC-MS/MS method for analysis of ethyl alcohol and acetaldehyde: clinical application to pharmacokinetics study. Transl Clin Pharmacol. 2024;32(3):159-172.
- Kostic E, Vujovic M, Milosavljevic B. Validation of a method for ethanol analysis in biological and non-biological samples and its toxicological application. Hem Ind. 2021;75:175-183.
- Page MJ, McKenzie JE, Bossuyt PM, et al. The PRISMA 2020 statement: an updated guideline for reporting systematic reviews. BMJ. 2021;372:n71.
- Leucuța DC, Urda-Cîmpean AE, Istrate D, Drugan T. Risk of Bias Assessment of Diagnostic Accuracy Studies Using QUADAS 2 by Large Language Models. Diagnostics (Basel, Switzerland). 2025;15(12).
- Szpot P, Wachełko O, Tusiewicz K, Zawadzki M. Dual-Column HS-GC-FID/FID Method for In-Depth Analysis of Low-Molecular-Weight Volatile Alcohols in Postmortem Biological Material. J Xenobiotics. 2026;16(3).
- Kosecki PA, Brooke P, Canonico E. The effect of sample temperature variations during sample preparation on measured blood ethanol concentration. J Forensic Sci. 2021;66(6):2478-2483.
- Westland JL, Dorman FL. Comparison of SPME and static headspace analysis of blood alcohol concentration utilizing two novel chromatographic stationary phases. Forensic Sci Int. 2013;231(1-3):e50-6.
- Pinto M, Eusébio E, Monteiro C. Development and Validation of an Analytical Method for Volatiles with Endogenous Production in Putrefaction and Submersion Situations. J Anal Toxicol. 2021;45(9):961-968.
- Kovatsi L, Giannakis D, Arzoglou V, Samanidou V. Development and validation of a direct headspace GC-FID method for the determination of sevoflurane, desflurane and other volatile compounds of forensic interest in biological fluids: application on clinical and post-mortem samples. J Sep Sci. 2011;34(9):1004-1010.
- Tiscione NB, Alford I, Yeatman DT, Shan X. Ethanol analysis by headspace gas chromatography with simultaneous flame-ionization and mass spectrometry detection. J Anal Toxicol. 2011;35(7):501-511.
- Sklerov JH, Couper FJ. Calculation and verification of blood ethanol measurement uncertainty for headspace gas chromatography. J Anal Toxicol. 2011;35(7):402-410.
- Taylor L, Saskőy L, Brodie T, et al. Development of a Gas-Tight Syringe Headspace GC-FID Method for the Detection of Ethanol, and a Description of the Legal and Practical Framework for Its Analysis, in Samples of English and Welsh Motorists’ Blood and Urine. Molecules. 2022;27(15).
- Wunder C, Pogoda W, Paulke A, Toennes SW. Assay of ethanol and congener alcohols in serum and beverages by headspace gas chromatography/mass spectrometry. MethodsX. 2021;8:101563.
- Moral J, Hundl C, Lee D, et al. Implementation of a Blind Quality Control Program in Blood Alcohol Analysis. J Anal Toxicol. 2019;43(8):630-636.
- Loftsson T. Topical drug delivery to the retina: obstacles and routes to success. Expert Opin Drug Deliv. 2022;19(1):9-21.
- Mihretu LD, Gebru AG, Mekonnen KN, Asgedom AG, Desta YH. Determination of ethanol in blood using headspace gas chromatography with flame ionization detector (HS-GC-FID): Validation of a method. Fan JP, ed. Cogent Chem. 2020;6(1):1760187.
- Kristiansen J, Petersen HW. An uncertainty budget for the measurement of ethanol in blood by headspace gas chromatography. J Anal Toxicol. 2004;28(6):456-463.