This protocol describes a two-season pot experiment that evaluates peat moss, biochar and foliar ascorbic acid, applied alone and in combination, for improving photosynthetic pigments, antioxidant enzymes, osmolytes, leaf water status and yield attributes of maize grown at three field-capacity-based water stress levels.
مقالة بحثية
Optimizing Climate Smart Soil Amendments Using Peat Moss, Biochar, and Ascorbic Acid to Improve Maize Yield under Drought
في هذه المقالة
ملخص
الملخص
Climate change has severely affected agricultural water availability. In this two-year pot experiment, maize (Zea mays L. cv. Pioneer 4040) was grown at 85% (I-1), 65% (I-2), or 45% (I-3; severe drought) of field capacity. Eight treatments were applied at each water-stress level: peat moss (T1), foliar ascorbic acid (T2), biochar (T3), peat moss + ascorbic acid (T4), peat moss + biochar (T5), ascorbic acid + biochar (T6), all three amendments (T7), and an untreated control (T8). Peat moss and biochar were each applied at 15% of soil weight, and ascorbic acid was applied at 40 mg/L. Each treatment × water-stress combination had three replicate pots per season. Measurements included chlorophyll fluorescence, photosynthetic pigments, catalase (CAT), superoxide dismutase (SOD), ascorbate peroxidase (APX), proline, soluble sugars, sucrose, leaf water content, plant height, ear length, ear diameter, grain weight per ear, and 100-grain weight. Data from each season were analyzed separately by two-way factorial analysis of variance (ANOVA) under a completely randomized design (CRD), with the pot as the experimental unit (n = 3). Treatment and water-stress effects were significant for the measured crop parameters in both seasons (p ≤ 0.05). Increasing water stress reduced chlorophyll fluorescence, chlorophyll content, and yield parameters. Combined treatments generally performed better than single treatments at all water-stress levels, including severe drought, with T7 generally producing the best results. Although CAT, SOD, and APX activities and soluble sugar and sucrose contents increased with water stress, proline content and yield parameters decreased. These pot-scale findings support further evaluation of combined amendments for improving maize performance under water deficit.
المقدمة
Climate change has adversely affected the availability of fresh water worldwide. The agricultural sector alone consumes nearly 80% of the world’s fresh water. According to the International Water Management Institute (IWMI), one-third of the population of developing countries has no access to adequate water for agricultural and domestic use1. If an adequate amount of water is not available, it will be difficult to produce food for an increasing population. To mitigate this situation, there is a need to improve water use efficiency, practice high-efficiency irrigation systems, develop genomes that resist drought stress and prevent water loss to increase yields with decreasing water application. Unfortunately, water productivity in Pakistan is only about 130 g of crop output per m3 of water, compared with 390 g in India, 800 g in China and 1,560 g in the USA, and the economic productivity of agricultural water use in Pakistan is among the lowest 10% of countries globally2.
Maize is the third most important crop after wheat and rice. In Pakistan, maize production increased by 6.9% during 2022–23 compared with the previous year (2021–2022). It contributes 3% of the value added in agriculture and 0.7% of the gross domestic product (GDP) of Pakistan. The increase in production was due to better yields and an increase in production area3. An increase in the production area means that more water is required to produce more maize. Climate change has caused drought stress in many regions worldwide and in Pakistan, which is among the top adversely affected countries. On the other hand, maize is not drought tolerant compared to barley and wheat4.
Drought stress adversely affects biochemical, morphological and physiological processes in maize, which leads to poor crop growth and hence low yields. Although plants also develop defensive mechanisms against drought stress, the process through which micro- and macromolecules such as proteins, polyunsaturated acid, carbohydrates, lipids, free radicals and chlorophyll are involved is complex5. Drought stress has negative effects on chlorophyll contents, maize yield parameters and carotenoids6. Anjum et al.5 also reported that complex non-enzymatic and enzymatic antioxidant systems, such as peroxidase (POD), SOD, APX, CAT, and low-molecular-mass antioxidants (glutathione, ascorbate and carotenoids), have evolved in maize plants to minimize the damaging effects of oxidative stress. Under drought, plants also accumulate compatible solutes such as proline, soluble sugars and sucrose, which help to maintain cell turgor, stabilize membranes and proteins and limit oxidative damage7,8,9.
Peat moss has high water-holding capacity, porosity, and consistency. Therefore, it is used as a carrier of commercial bacterial inoculants and as a component of growing substrates10. Peat resources are declining, reducing peat moss availability and increasing the need for substitutes. Biochar, a substitute for peat moss, has been reported in recent studies for improved soil health and increased crop productivity through nutrient availability and soil moisture retention10,11. Organic soil amendments can improve plant physiological performance by enhancing soil water-holding capacity and maintaining plant water status under limiting conditions12. Biochar is a carbon-rich product produced by the pyrolysis of cellulose-containing biomass materials. It is characterized by a high specific surface area, pH and ash content13. Vitamin C (ascorbic acid) is an antioxidant molecule. It is a key substrate for detoxification. The application level influences growth responses, hormonal balance, and antioxidant enzyme and mitogen-activated protein kinase (MAPK) signaling cascades and activities. Ascorbic acid (AsA) plays a vital role in stress perception, redox homeostasis and the subsequent regulation of oxidative stress and plant physio-biochemical responses under normal conditions as well as under different abiotic stresses14.
Considering the water availability, importance of maize crops and characteristics of peat moss, biochar and ascorbic acid, a study was planned to investigate the effects of different drought (water stress) levels with single and combined treatments of peat moss, ascorbic acid and biochar. The main objective was to determine the most suitable combination of treatments for plant growth under drought stress.
البروتوكول
Experimental site, design and treatments
The pot experiment was conducted at the Research Laboratory of the Faculty of Agriculture, University of Layyah, Layyah, Punjab, Pakistan (31.020016, 70.958359), during two consecutive growing seasons (2022 and 2023). The pots were arranged as a two-factor factorial experiment in a CRD, with 8 soil amendment/foliar treatments and 3 water-stress levels and three replicate pots per combination (72 pots per season). Three plants were grown in each pot. Three water stress levels were applied: I-1, irrigation to 85% of field capacity (FC: well-watered), I-2, irrigation to 65% FC (moderate stress), and I-3, irrigation to 45% FC (severe stress). Eight treatments were applied: T1: 15% peat moss of pot soil, T2: foliar application of 40 mg/L AsA, T3: 15% biochar of pot soil, T4: 15% peat moss + foliar 40 mg/L AsA, T5: 15% peat moss + 15% biochar, T6: foliar 40 mg/L AsA + 15% biochar, T7: 15% peat moss + foliar 40 mg/L AsA + 15% biochar, and T8: untreated control. Peat moss and biochar rates are expressed on a weight/weight (w/w) basis. Each pot contained 10 kg of air-dried soil; 15% corresponds to 1,500 g of peat moss and/or 1,500 g of biochar per pot. In T5 (15% peat moss + 15% biochar) and T7 (15% peat moss + foliar 40 mg/L ascorbic acid + 15% biochar), peat moss and biochar were each added at 15% of the pot soil, giving a total amendment load of 30% (w/w) in those two treatments. All local, national or international guidelines and legislation were adhered to for the use of plants in this study. All materials used in the current study are listed in the Table of Materials.
Plant material, growth conditions and application of treatments
Certified seed of maize (Zea mays L., cv. Pioneer 4040) was obtained. Each pot was filled with 10 kg of air-dried soil, which was mixed thoroughly with the assigned amendment. The field capacity of each soil amendment mixture was determined gravimetrically before sowing. Three seeds per pot were sown on 15 July 2022 and the seedlings were thinned to three uniform plants per pot at the two-leaf stage (7 days after sowing). The plants were grown under open-air (wire-house) conditions (mean day/night temperature 32/22 °C, relative humidity 60%, and natural photoperiod of 12–13 h). Fertilizer was applied at 120–60–60 (N-P-K kg/ha) at sowing and again at the V6 stage (30 days after sowing) equally to all pots, and weeds and insect pests were controlled manually as required. The plants were grown for 100 days until physiological maturity. The water stress treatments were started at the V6 stage (30 days after sowing) and maintained until physiological maturity (100 days after sowing), for a total of 70 days. Each pot was weighed every 2 days, and water was added to restore the target pot weight corresponding to 85%, 65% or 45% FC. A fresh 40 mg/L AsA solution (40 mg of L-ascorbic acid in 1 L of distilled water) containing 0.1% (v/v) polysorbate 20 as a surfactant was prepared before each application. The foliage was sprayed (50 mL per pot) 3 times at the V6, V10 and VT (tasseling) stages, at 10-day intervals. Plants of the treatments without AsA (T1, T3, T5 and T8) were sprayed with an equal volume of distilled water.
Photosynthetic attributes
Leaf chlorophyll fluorescence (ChlF) was recorded just before pollination15 with a handheld chlorophyll fluorometer between 11:30 and 14:00 h. Three leaves per plant (the youngest fully expanded leaf, i.e., the ear leaf) were dark-adapted with leaf clips for 20 min. The fluorometer was placed on each clip, and the maximum quantum yield of photosystem II (PSII; Fv/Fm) was recorded. For photosynthetic pigments, fresh leaf tissue was collected at 40 days after sowing (10 days after initiation of the water-stress treatments at the V6 stage). Fresh tissue (200 mg) was ground in 10 mL of 80% acetone with a mortar and pestle to obtain a slurry. The slurry was centrifuged at 4000 rpm for 10 min, and the supernatant was filtered through grade 2 filter paper. The absorbance was measured at 645, 663 and 470 nm with a spectrophotometer, and the chlorophyll and carotenoid contents were calculated with the following equations16,17:
 (1)
 (2)
 (3)
 (4)
Here, V, W, A663, A645 and A470 are the purified solution volume, fresh leaf weight, and optical absorption at 663, 645 and 470 nm, respectively.
Enzymatic antioxidant attributes
Fresh leaf samples were collected for enzyme assays at 40 days after sowing (the same stage as pigment sampling; 10 days after initiation of the water-stress treatments at the V6 stage). Leaf tissue (0.5 g) was homogenized in ice-cold 50 mM potassium phosphate buffer (pH 7.0) containing 1 mM ethylenediaminetetraacetic acid (EDTA) and 1% (w/v) polyvinylpyrrolidone (PVP) and centrifuged at 12,000 × g (or 10,000 rpm) for 15 min at 4 °C. The supernatant was used as the enzyme extract. CAT activity was determined by monitoring the disappearance of H2O2 at 240 nm18. The enzyme extract was mixed with potassium phosphate buffer (50 mM, pH 7.0) containing 15 mM H2O2, and the decrease in absorbance was recorded with a spectrophotometer. SOD activity was determined from the inhibition of the photochemical reduction of nitroblue tetrazolium (NBT)19. A reaction mixture was prepared containing NBT (75 µM), phosphate buffer (50 mM, pH 7.8), methionine (13 mM), riboflavin (2 µM), EDTA (0.1 mM), and 0.1 mL of enzyme extract; it was exposed to light, and the absorbance was measured at 560 nm. APX activity was determined20 in a reaction mixture of L-ascorbic acid (0.25 mM), H2O2 (1 mM), phosphate buffer (50 mM, pH 7.0) and 0.1 mL of enzyme extract; the change in absorbance at 290 nm caused by ascorbate oxidation was recorded with a spectrophotometer. The CAT, SOD and APX activities were expressed as U mg−1 protein (where one unit of CAT is defined as the amount of enzyme that decomposes 1 µmol H2O2 per minute, one unit of SOD as the amount of enzyme causing 50% inhibition of NBT reduction, and one unit of APX as the amount of enzyme that oxidizes 1 µmol ascorbate per minute).
Osmolytes, sucrose and leaf water content
The leaf proline content was determined by the acid-ninhydrin method of Bates et al.21. The absorbance of the supernatant was measured at 520 nm; proline standards were prepared at 0, 2, 4, 16 and 32 mg/L, and the proline concentration was calculated from the standard curve15. The leaf sucrose (SUC) and soluble sugar (SS) contents were determined by the methods of van Handel22 and Irigoyen et al.23, respectively. Sucrose was quantified against glucose and sucrose standard curves. For leaf relative water content (LWC), fresh leaves were excised, sealed immediately in plastic bags, and taken to the laboratory, where the fresh weight (FW) was recorded. The leaves were floated in distilled water for 6–8 h at 25 °C, blotted dry with tissue paper, and weighed to record the turgid weight (TW). The leaves were oven-dried at 72 °C for 48 h; the dry weight (DW) was recorded, and LWC was calculated as follows:
 (5)
Growth and yield attributes
At physiological maturity (100 days after sowing), the plant height (cm) of 3 randomly selected plants per pot was measured from the soil surface to the tip of the tassel (base of the tassel). The ears of the selected plants were harvested, and ear length (cm) and ear diameter (cm) were measured. The ears were threshed, and grain weight per ear (g) and 100-grain weight (g) were recorded.
Statistical analysis
The pot was used as the experimental unit, and the values of the plants within each pot were averaged before analysis, giving n = 3 pots per treatment × water-stress combination in each season. The data of each season were analyzed separately by two-way factorial ANOVA under a CRD, with treatment (8 levels), water-stress level (3 levels) and their interaction as fixed factors (Yijk = μ + Ti + Wj + (T × W)ij + εijk), using statistical software. The two seasons were analyzed separately because the growing conditions differed between years. The means of the 24 treatment × water-stress combinations were compared by the least significant difference (LSD) test at p ≤ 0.0524. Principal component analysis (PCA) was performed separately for each season using the mean values of the 24 treatment × water-stress combinations for the 17 measured traits (chlorophyll fluorescence, chlorophyll a, chlorophyll b, total chlorophyll, carotenoids, CAT, SOD, APX, proline, soluble sugar, sucrose, leaf water content, plant height, ear length, ear diameter, grain weight per ear, and 100-grain weight). Each trait was standardized as a z-score before PCA and hierarchical cluster heatmap analysis with statistical software, and the graphs were prepared with graphing software.
النتائج
Photosynthetic attributes
The effects of the treatments, water stress levels and interactions on the chlorophyll fluorescence of the maize plants were significant during both seasons. Figure 1 shows the effects of the different treatments and water stress levels on the photosynthetic attributes, viz., chlorophyll fluorescence, chlorophyll a, chlorophyll b, total chlorophyll and carotenoid contents. Figure 1A–E shows that with increasing water stress, the photosynthetic parameters of the maize plants generally decreased during both seasons. The data further showed that the combined application of peat moss + ascorbic acid (T4), peat moss + biochar (T5), and ascorbic acid + biochar (T6) generally had better results than peat moss (T1), ascorbic acid (T2) and biochar (T3). The combined application of peat moss + ascorbic acid + biochar (T7) generally resulted in greater photosynthetic attributes than did T4, T5 and T6. However, the control treatment (T8) had the lowest values of the measured parameters for all water stress levels during both seasons. During both seasons, the highest values for chlorophyll fluorescence (0.98, 0.97), chlorophyll a (28.2, 27.4 mg/g FW), chlorophyll b (3.66, 3.29 mg/g FW), total chlorophyll (31.9, 30.7 mg/g FW), and carotenoids (18.30 mg/g FW in 2022) were recorded for T7 with a water stress level of I-1, while the lowest values were recorded for T8 with a water stress level of I-3. In 2023, the highest carotenoid content (18.62 mg/g FW) was recorded for T7 at I-2.
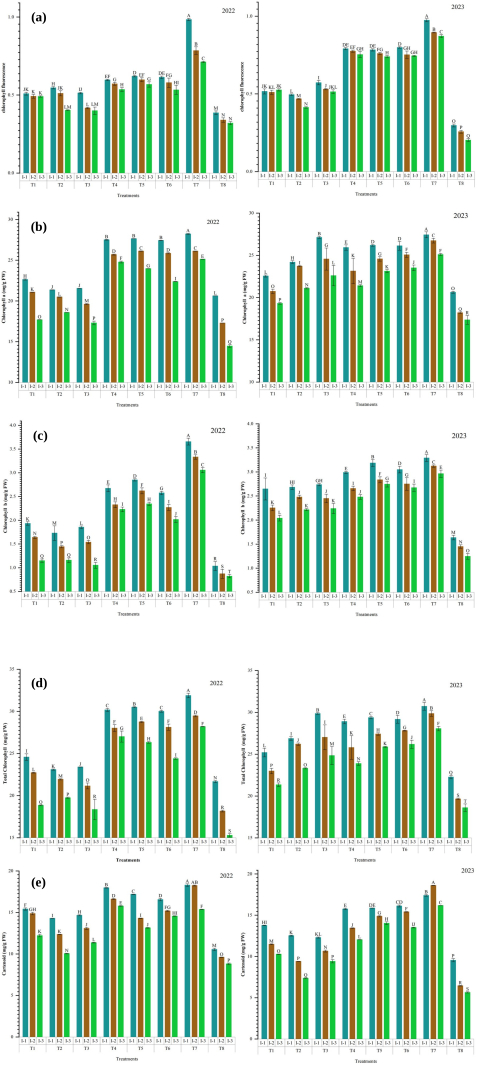
Figure 1: Combined peat moss, ascorbic acid and biochar (T7) best maintained the photosynthetic attributes of maize under water stress. (A) Chlorophyll fluorescence (Fv/Fm); (B) chlorophyll a; (C) chlorophyll b; (D) total chlorophyll; and (E) carotenoid contents (mg/g FW) in 2022 (left) and 2023 (right). Bars show means ± standard error (SE; n = 3 pots). Within each season, bars sharing a letter are not significantly different (LSD, p ≤ 0.05). Abbreviations: T1, 15% peat moss; T2, foliar ascorbic acid (40 mg/L); T3, 15% biochar; T4, peat moss + ascorbic acid; T5, peat moss + biochar; T6, ascorbic acid + biochar; T7, peat moss + ascorbic acid + biochar; T8, untreated control; I-1, I-2 and I-3, irrigation to 85%, 65% and 45% of field capacity, respectively; FW, fresh weight; Fv/Fm, maximum quantum yield of photosystem II. Please click here to view a larger version of this figure.
Enzymatic antioxidant attributes
Treatment, water-stress level, and their interaction had significant effects on CAT, SOD and APX. Figure 2A–C shows that CAT, SOD and APX activities increased with increasing water stress during both seasons. The results also show that the combined treatment with peat moss + ascorbic acid + biochar (T7) had the lowest activities, while the control (T8) had the highest CAT, SOD and APX activities during both seasons. Furthermore, the combined treatments with peat moss + ascorbic acid (T4), peat moss + biochar (T5) and ascorbic acid + biochar (T6) had lower CAT, SOD and APX activities than the single treatments with peat moss (T1), ascorbic acid (T2) and biochar (T3) for all levels of water stress during both seasons. Figure 2A shows the effects of treatment and water stress level on CAT activity. In most treatments, CAT activity was highest at I-3 in both seasons; the exceptions were T2 and T7 in 2022 and T6 in 2023, in which CAT activity was higher at I-2 than at I-3. Figure 2B shows the effects of treatments and water stress levels on SOD, while Figure 2C shows the effects of treatments and water stress on APX. The figures revealed that increasing water stress increased SOD and APX activity. However, with decreasing water stress and the application of combined treatments, such as peat moss + ascorbic acid (T4), peat moss + biochar (T5), and ascorbic acid + biochar (T6), the SOD and APX activities decreased. Similarly, the combination of the three treatments, peat moss + ascorbic acid + biochar (T7), which had relatively low water stress levels, had the lowest SOD and APX activities.
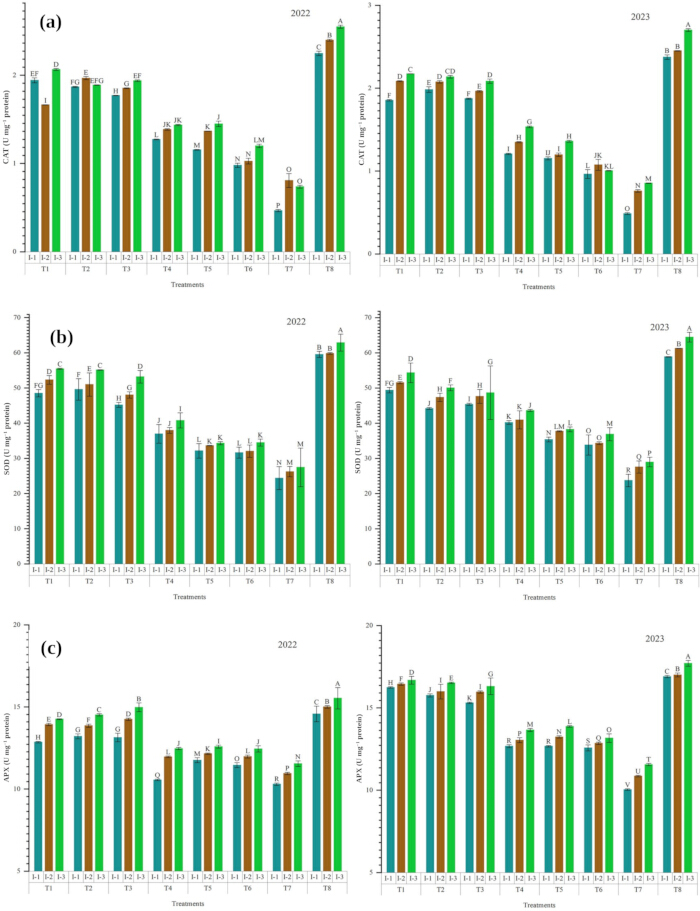
Figure 2: Antioxidant enzyme activities increased with water stress and were lowest under T7. (A) Catalase (CAT); (B) superoxide dismutase (SOD); and (C) ascorbate peroxidase (APX) activities (U mg−1 protein) in 2022 (left) and 2023 (right). Bars show means ± standard error (SE; n = 3 pots). Within each season, bars sharing a letter are not significantly different (LSD, p ≤ 0.05). Abbreviations: T1, 15% peat moss; T2, foliar ascorbic acid (40 mg/L); T3, 15% biochar; T4, peat moss + ascorbic acid; T5, peat moss + biochar; T6, ascorbic acid + biochar; T7, peat moss + ascorbic acid + biochar; T8, untreated control; I-1, I-2 and I-3, irrigation to 85%, 65% and 45% of field capacity, respectively. Please click here to view a larger version of this figure.
Osmolyte, sucrose and leaf water attributes
Treatment, water-stress level, and their interaction significantly affected the proline, soluble sugar, sucrose and leaf water contents in maize plants. The graphical data (Figure 3A–C) showed that with increasing water stress, the soluble sugar and sucrose contents in the maize plant leaves increased, whereas the proline content decreased. During both seasons, the highest soluble sugar (7.67, 8.72 mg/g FW) and sucrose (6.61, 6.90 mg/g FW) contents were found in the control treatment (T8) with water stress level I-3, while the lowest soluble sugar and sucrose contents were recorded for T7 (peat moss + ascorbic acid + biochar) with water stress level I-1. In contrast, the highest proline content (7.91, 8.45 mg/g FW) was recorded for T7 at I-1 and the lowest (1.55, 2.76 mg/g FW) for T8 at I-3. Water-stress level, treatment, and their interaction had significant effects on the leaf water content during both years. With increasing water stress, the water content decreased significantly. During the first season, the highest leaf water content (87.3%) was recorded for T7 (peat moss + ascorbic acid + biochar) at water stress level I-1, and the lowest moisture content (63.4%) was recorded for T8 (control) at water stress level I-3. Similarly, during the second season, the highest water content (87.6%) was recorded for T7 (peat moss + ascorbic acid + biochar), for which the water stress level was I-1, and the lowest water content (68.5%) was recorded for T8 (control), for which the water stress level was I-3 (Figure 3D).
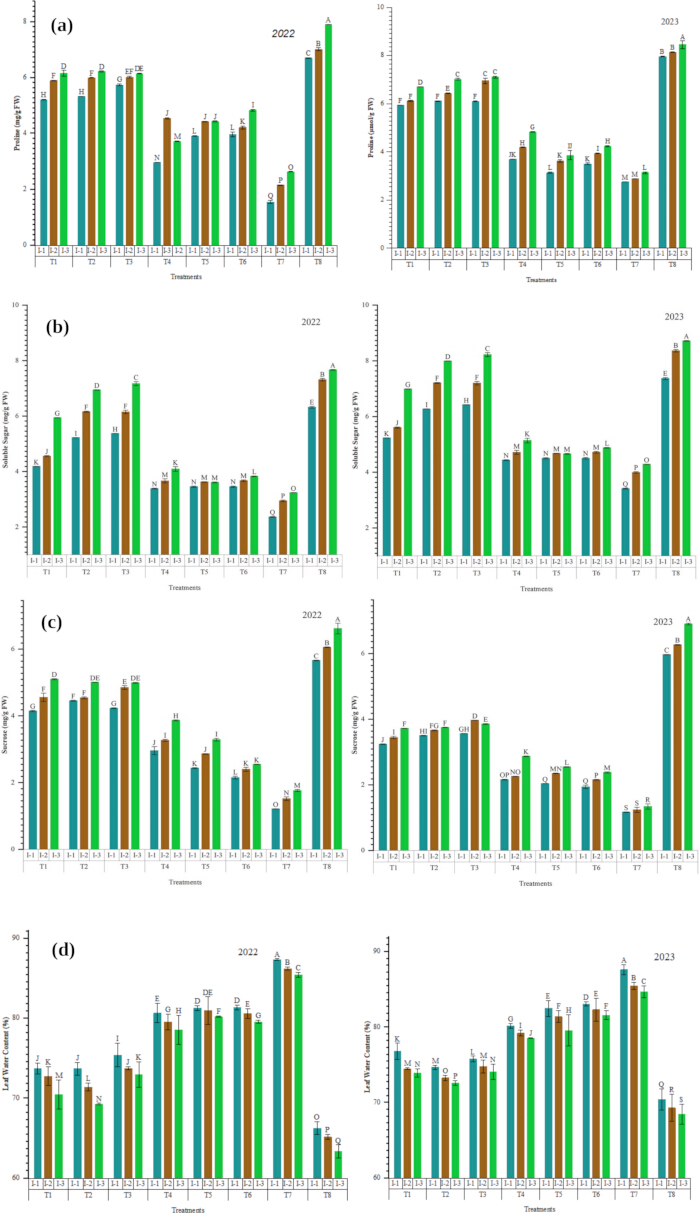
Figure 3: Soluble sugar and sucrose increased, whereas proline and leaf water content decreased, with water stress. (A) Proline; (B) soluble sugar; and (C) sucrose contents (mg/g FW); and (D) leaf relative water content (%) in 2022 (left) and 2023 (right). Bars show means ± standard error (SE; n = 3 pots). Within each season, bars sharing a letter are not significantly different (LSD, p ≤ 0.05). Abbreviations: T1, 15% peat moss; T2, foliar ascorbic acid (40 mg/L); T3, 15% biochar; T4, peat moss + ascorbic acid; T5, peat moss + biochar; T6, ascorbic acid + biochar; T7, peat moss + ascorbic acid + biochar; T8, untreated control; I-1, I-2 and I-3, irrigation to 85%, 65% and 45% of field capacity, respectively; FW, fresh weight. Please click here to view a larger version of this figure.
Growth and yield attributes
The effects of treatment, water stress level and their interaction were found to be significant for plant height, ear length, ear diameter, grain weight per ear (GW/E) and 100-grain weight (100 GW). Table 1 shows that plant height, ear length, ear diameter, GW/E and 100 GW generally decreased from I-1 to I-3 during both seasons. However, the decrease was not strictly monotonic for every treatment and trait. For example, in 2022, the plant height of T1 (252.3, 227.6 and 230.2 cm) and T3 (255.3, 249.1 and 252.2 cm) was slightly greater at I-3 than at I-2; GW/E of T5 was greatest at I-2 in both seasons; and the ear length of T1 in 2023 and the ear diameter of T8 in 2022 were greater at I-2 and I-3 than at I-1. During both seasons, plant height (278.4, 278.8 cm), ear length (21.0, 20.7 cm), ear diameter (5.3, 6.3 cm), GW/E (197.6, 197.7 g) and 100 GW (31.2, 30.9 g) were greatest for T7 (peat moss + ascorbic acid + biochar), under I-1, compared with the other treatment × water-stress combinations (in 2022, the ear length of T7 was numerically slightly higher at I-2 (21.1 cm) than at I-1 (21.0 cm), but the difference was not significant).
Table 1: Growth and yield attributes of maize under the soil amendment and foliar treatments at three water-stress levels in 2022 and 2023. Values are means (n = 3 pots). Within each column, means sharing a letter are not significantly different (LSD, p ≤ 0.05). Abbreviations: Ear Dia., ear diameter; GW/E, grain weight per ear; 100 GW, 100-grain weight; T1, 15% peat moss; T2, foliar ascorbic acid (40 mg/L); T3, 15% biochar; T4, peat moss + ascorbic acid; T5, peat moss + biochar; T6, ascorbic acid + biochar; T7, peat moss + ascorbic acid + biochar; T8, untreated control; I-1, I-2 and I-3, irrigation to 85%, 65% and 45% of field capacity, respectively. Please click here to download table.
Principal component analysis
PCA was used to detect the combinations of parameters assessed in both seasons. Figure 4 shows the parameter combinations for both seasons. Together, the first two principal components (Dim1 and Dim2) explained 90.9% of the total variance in 2022 (Dim1, 86.3%; Dim2, 4.6%) and 88.8% in 2023 (Dim1, 82.4%; Dim2, 6.4%) (Figure 4).
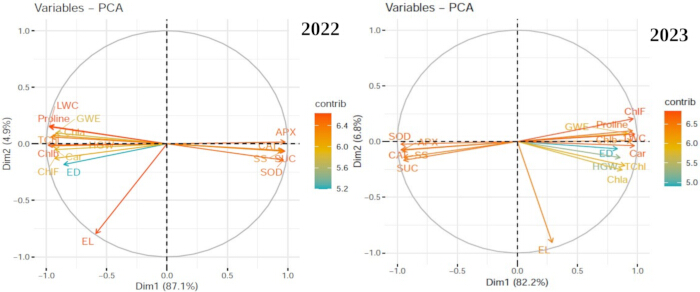
Figure 4: Principal component analysis separated stress-indicator traits from growth and yield traits. PCA variable plots for 2022 (left) and 2023 (right), generated from z-score standardized means of the 24 treatment × water-stress combinations for 17 measured traits. Dim1 and Dim2 explained 86.3% and 4.6% of the variance in 2022, and 82.4% and 6.4% in 2023, respectively. Arrow color indicates the contribution (contrib, %) of each variable. Abbreviations: PCA, principal component analysis; Dim, dimension; ChlF, chlorophyll fluorescence; Chla, chlorophyll a; Chlb, chlorophyll b; TChl, total chlorophyll; Car, carotenoids; CAT, catalase; SOD, superoxide dismutase; APX, ascorbate peroxidase; SS, soluble sugar; SUC, sucrose; LWC, leaf water content; PH, plant height; EL, ear length; ED, ear diameter; GWE, grain weight per ear; HGW, 100-grain weight. Please click here to view a larger version of this figure.
Heatmap analysis
The cluster heatmap analysis summarized the responses of the osmolytes, physiological parameters, antioxidants and agronomic characteristics of maize under different treatments and drought conditions (Figure 5). In the heatmap, the columns represent the measured traits, and the numbered rows (1–24) represent the 24 treatment × water-stress combinations (1–3, T1 at I-1, I-2 and I-3; 4–6, T2; 7–9, T3; 10–12, T4; 13–15, T5; 16–18, T6; 19–21, T7; 22–24, T8). During both years, all the traits exhibited differential associations varying from positive to negative extremes in all the treatments with respect to stress levels, as demonstrated in Figure 5.
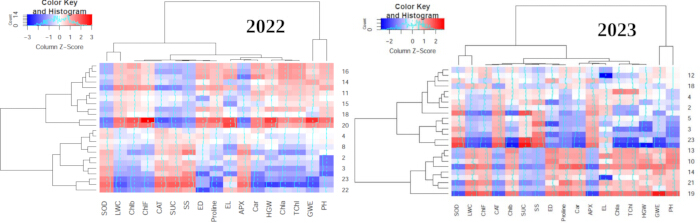
Figure 5: Cluster heatmap of maize traits under the 24 treatment × water-stress combinations. Heatmaps for 2022 (left) and 2023 (right). Colors represent column z-scores (red, high; blue, low), and the dendrograms show hierarchical clustering of the traits (columns) and of the treatment × water-stress combinations (rows). Row numbers: 1–3, T1 at I-1, I-2 and I-3; 4–6, T2; 7–9, T3; 10–12, T4; 13–15, T5; 16–18, T6; 19–21, T7; 22–24, T8. Trait abbreviations as in Figure 4; T1, 15% peat moss; T2, foliar ascorbic acid (40 mg/L); T3, 15% biochar; T4, peat moss + ascorbic acid; T5, peat moss + biochar; T6, ascorbic acid + biochar; T7, peat moss + ascorbic acid + biochar; T8, untreated control; I-1, I-2 and I-3, irrigation to 85%, 65% and 45% of field capacity, respectively. Please click here to view a larger version of this figure.
DATA AVAILABILITY:
The replicate-level dataset used for the analyses reported in this study is provided as Supplementary File 1.
Supplementary File 1: Replicate-level dataset for the two-season maize pot experiment. The workbook contains observations for the 24 treatment × water-stress combinations in 2022 and 2023, with three replicate pots per combination, including photosynthetic, antioxidant, osmolyte, leaf-water, growth, and yield measurements used for the statistical analyses, PCA, and heatmap. Please click here to download file.
المناقشة
Maize is sensitive to drought, and water deficits can reduce growth and productivity15. Therefore, sufficient water should be available at the root zone for proper growth. Under climate change conditions, fresh water availability is becoming a serious concern worldwide1. In this study, the performance of maize crops was investigated under water stress conditions in combination with the application of peat moss, biochar and ascorbic acid. The maize performance was characterized using biochemical and yield attributes. Chlorophyll fluorescence and chlorophyll content are important parameters that may be used to indicate the degree of water stress in maize plants25,26. Water deficit can reduce the maximal quantum yield of PSII photochemistry (Fv/Fm), reflecting impaired PSII efficiency and photosynthetic performance under drought conditions25. Decreases in chlorophyll fluorescence and chlorophyll a, chlorophyll b and total chlorophyll contents in maize plants were assessed with increasing water stress during both seasons of the experiment. The water stress level I-3 had the lowest chlorophyll content for all the treatments, and the lowest value was recorded for T8 when no treatment was applied against the water stress conditions. The decreases in chlorophyll fluorescence and chlorophyll content were due to the decreased number of reaction centers. These results are supported by Badr and Brüggemann25, who reported that the decreases in chlorophyll fluorescence and chlorophyll content are due to fewer reaction centers resulting from water stress conditions. The application of peat moss, ascorbic acid and biochar increased the chlorophyll fluorescence and chlorophyll content in maize plants at all water stress levels compared to those in the T8 (control) treatment. Several complementary mechanisms may explain this improvement. Peat moss and biochar increase soil porosity and water-holding capacity10,11, which helps plants maintain leaf hydration and stomatal opening under deficit irrigation; this agrees with the higher leaf water content of the amended treatments (Figure 3D). Biochar can also improve the availability of nutrients, such as nitrogen and magnesium, that are required for chlorophyll biosynthesis13. Foliar ascorbic acid is a major non-enzymatic antioxidant that scavenges reactive oxygen species in chloroplasts and helps protect photosynthetic pigments and PSII from photo-oxidative damage14. Together, better plant water status and lower oxidative load could have slowed drought-induced chlorophyll degradation, which may explain why the combined treatments, especially T7, retained the highest pigment contents. Furthermore, the combined application of peat moss, ascorbic acid and biochar had better chlorophyll-related effects than did the single-application treatment. Similar results were reported by Nehela et al.13. Their study reported improved maize chlorophyll contents by applying biochar to a sodic-saline soil irrigated with saline water (i.e., under salinity rather than drought stress), but better yields and chlorophyll contents were found when biochar was combined with plant growth-promoting rhizobacteria (PGPR). Similar results were also reported by Abdel-Aziz et al.27, where the combined effect of peat moss and multiwalled carbon nanotubes improved the chlorophyll content in bean plants. The better chlorophyll contents may reflect improved soil conditions and water retention, consistent with previous reports10,11,28. Carotenoids are also good indicators of water stress and are used to represent the water stress level in plants. As with chlorophyll content, a decrease in the carotenoid content was also observed with increasing water stress for all the treatments. Here, the combined treatments of peat moss, ascorbic acid and biochar (T4, T5, T6 and T7) had greater carotenoid contents than did T8 (control), where no treatment was applied to maize plants under water stress conditions. Similarly, Bijanzadeh et al.29 reported that chlorophyll and carotenoid contents were reduced under water stress conditions, but maize plants treated with foliar application of sodium silicate exhibited a 51% increase in carotenoid content compared with plants under water stress conditions.
For CAT, SOD and APX, increases in activity were recorded. The results clearly indicated that T8 (control) exhibited the highest CAT, SOD and APX activities during both seasons. Comparatively small values for CAT, SOD and APX were recorded for T1 (peat moss), T2 (ascorbic acid) and T3 (biochar). In the combined treatments of T4 (peat moss + ascorbic acid), T5 (peat moss + biochar) and T6 (ascorbic acid + biochar), small values of CAT, SOD and APX, respectively, were recorded compared to those in T1, T2 and T3. T7 (peat moss + ascorbic acid + biochar) had the lowest CAT, SOD and APX activities. These lower enzyme activities should not be interpreted as a stronger enzymatic antioxidant response under T7; rather, together with the higher leaf water and pigment contents of T7, they suggest that plants receiving the combined amendment experienced less drought-induced oxidative stress and therefore needed less upregulation of CAT, SOD and APX. When discussing water stress levels, for individual treatments, generally higher values of CAT, SOD and APX were recorded with increasing water stress. The increased enzymatic activity was protective against oxidative stress damage. Drought-induced oxidative stress can alter antioxidant enzyme activities, including catalase and superoxide dismutase, as part of the plant response to water deficit8,30. These results are supported by a study by Khan et al.31. The better performance of the combined treatments was consistent with the findings of Abdel-Aziz et al.27 and Jatuwong et al.32. Furthermore, Anjum et al.5 and Jiang and Zhang33 reported that with increasing water stress, antioxidant enzyme activity increased. These results are also supported by Jowkar et al.34.
Cell membranes are sensitive to environmental stressors, such as water stress, and can be assessed either by measuring cell membrane integrity or by measuring biomarkers such as proline, an amino acid that maintains turgor, buffers against reactive oxygen species and maintains redox homeostasis to prevent dehydration of plant cells35. Proline also helps reduce the effects of abiotic stress5. In the present study, proline content decreased with increasing water stress in all the treatments, and the lowest proline content was recorded for the control, where no additional protective measures were taken to address the water stress. The highest proline contents were recorded for T7 (peat moss + ascorbic acid + biochar) at a water stress level of I-1. This pattern is opposite to the commonly described drought-associated accumulation of proline. Mazloom et al.36 reported that improving soil water availability with a lignin-based hydrogel reduced leaf proline in drought-stressed maize, whereas the present experiment showed lower proline as water stress increased. Because the basis for this unexpected pattern was not investigated directly, the proline results should be interpreted cautiously and the measurements should be verified before a mechanistic explanation is assigned.
With increasing water stress, the soluble sugar and sucrose contents increased to reduce the damaging effect of water stress on plants in almost all the treatments. The highest values of soluble sugar and sucrose were recorded for T8 (control), where no protective treatment against water stress was applied. Similarly, water stress level I-3 had the highest soluble sugar and sucrose contents among the treatments. Similar results were reported by Anjum et al.5 and Du et al.9. Decreased leaf water contents were recorded for all water stress levels in all treatments. The lowest water contents were recorded in the control treatment, where no protective treatment was applied against water stress levels. For maize yield parameters, such as plant height, ear length, ear diameter, grain weight per ear and 100-grain weight, all yield-related parameters were significantly affected by the treatment and water-stress level. A general decrease in yield parameters was observed with increasing water stress. The decrease in yield parameters was due to a decrease in available photosynthetic pigments. As the ability of maize plants to produce food through photosynthesis decreased, the yield parameters decreased. These results are consistent with those of Iqbal et al.37, who reported that deficit irrigation significantly reduced maize yield attributes under field conditions, whereas activated biochar amendment improved leaf water content, photosynthetic pigments and grain weight under water-limited conditions.
This study was conducted in pots, in which root growth is confined and the soil volume, amendment distribution and water regime differ from those in the field. Pot experiments allow precise control of soil moisture at defined field-capacity levels and are therefore useful for screening amendments and for understanding physiological responses, but they cannot fully reproduce field conditions. The present results therefore show the potential of peat moss, biochar and ascorbic acid, particularly in combination (T7), to improve maize performance under water deficit. Multi-location field trials in water-scarce areas, together with an economic assessment of amendment rates, are needed before these treatments can be recommended to farmers for improving maize productivity.
Water stress reduced chlorophyll fluorescence, photosynthetic pigments, leaf water content and the yield attributes of maize, and increased CAT, SOD and APX activities and soluble sugar and sucrose contents, but decreased proline content. At all water-stress levels and in both seasons, the combined application of peat moss, ascorbic acid and biochar (T7) gave the highest photosynthetic pigment and leaf water contents and, in general, the best yield attributes. Plants under T7 had the lowest antioxidant enzyme activities and soluble sugar and sucrose contents (but the highest proline content), which indicates that they experienced less drought-induced stress, rather than a stronger enzymatic or osmotic response. Lipid peroxidation, reactive oxygen species and nutrient uptake were not measured in this study; therefore, the mechanisms proposed here need to be confirmed in future work. Because the experiment was conducted in pots, field trials under water-limited conditions are needed before T7 can be recommended for improving maize productivity in water-scarce areas.
الإفصاحات
The authors declare that the research was conducted in the absence of any commercial or financial relationships that could be construed as potential conflicts of interest. During preparation of this manuscript, the authors used ChatGPT and Grammarly to improve the technical and English language of the paper. After using these tools, the authors reviewed and edited the content as needed and take full responsibility for the content of the publication.
AUTHOR CONTRIBUTIONS:
Hiza Zaheer and Jameel Al-Tamimi contributed to conceptualization, preparation of the original draft, and review and editing of the manuscript. Kamran Ikram contributed to conceptualization, validation, formal analysis, investigation, technical language and English editing, supervision, and project administration. Muhammad Zeeshan Mansha contributed to methodology, investigation, and preparation of the original draft. Muhammad Saqlain Zaheer contributed to software, formal analysis, data curation, and technical language and English editing. Rubab Iqbal and Rahila Islamzade contributed to conceptualization, validation, formal analysis, investigation, technical language and English editing, supervision, project administration, preparation of the original draft, and review and editing of the manuscript. Akhtar Hameed contributed to methodology, validation, data curation, visualization, and review and editing of the manuscript. Hafiz Haider Ali contributed to validation and review and editing of the manuscript. Mohammad Yaqoob Sharafat contributed to formal analysis and preparation of the original draft. Tariverdi Islamzade provided resources. All authors read and approved the final version of the manuscript.
شكر وتقدير
The authors appreciate the support provided by the Ongoing Research Funding program (ORF-2026-1082), King Saud University, Riyadh, Saudi Arabia.
المواد
| الاسم | الشركة | رقم فهرسي | التعليقات |
|---|---|---|---|
| Acetone, 80% (v/v) | Agronomy Lab-KFUEIT | Extraction of chlorophyll and carotenoids | |
| Ascorbic acid (L-ascorbic acid) | Agronomy Lab-KFUEIT | Foliar spray, 40 mg/L, APX assay substrate. | |
| Biochar | Soil Fertility and Soil Chemistry Laboratory, Faisalabad, Pakistan | Soil amendment, 15% of pot soil. | |
| Centrifuge | Not provided | CFGR-B16B | Used for pigment extracts at 4000 rpm and enzyme extracts at 12,000 × g (or 10,000 rpm). |
| Chlorophyll fluorometer (handheld) | Not provided | TYS-B | Handheld fluorometer used for Fv/Fm measurement after 20 min dark adaptation. |
| Distilled water | Agronomy Lab-KFUEIT | N/A | Used to prepare the 40 mg/L ascorbic acid solution, for control foliar sprays, and for leaf-water-content measurements. |
| EDTA (Ethylenediaminetetraacetic acid) | Sigma-Aldrich, Agronomy Lab-KFUEIT | Chelating agent (1 mM) binds Mg2+ and Ca2+, inhibiting proteases and protecting antioxidant enzymes (CAT, SOD, APX) during extraction. | |
| Filter paper, grade 2 | Whatman (Cytiva) | Filtration of pigment extract | |
| Glacial acetic acid, ninhydrin and toluene | Agronomy Lab-KFUEIT | Proline determination | |
| Glucose standard | Sigma-Aldrich, Agronomy Lab-KFUEIT | Used to prepare a calibration curve (0–100 µg/mL) for quantifying soluble sugars in leaf samples. | |
| Graphing software (Origin 2018) | OriginLab Corporation, Northampton, MA, USA | Version 2018 | Bar graphs (Figures 1–3). |
| Hydrogen peroxide (H2O2) | Agronomy Lab-KFUEIT | CAT and APX assays | |
| L-Methionine | Agronomy Lab-KFUEIT | SOD assay | |
| Leaf clips | Not provided | Used to dark-adapt leaves for 20 min before chlorophyll-fluorescence (Fv/Fm) measurement. | |
| Maize seed (Zea mays L.) | Corteva Agriscience | N/A | Cultivar Pioneer 4040. |
| Mortar and pestle | Agronomy Lab-KFUEIT | N/A | Used to grind fresh leaf tissue for pigment extraction. |
| Nitroblue tetrazolium (NBT) | Agronomy Lab-KFUEIT | SOD assay | |
| Oven (drying) | Science Emporium | Leaf dry weight, 72 °C for 48 h (step 5.5) | |
| Peat moss | Horticultural Department, Punjab Agriculture Research Board, Faisalabad, Pakistan | Soil amendment, 15% of pot soil. | |
| Plastic pots | Agronomy Lab-KFUEIT | N/A | For experiment |
| Potassium phosphate buffer salts (KH2PO4/K2HPO4) | Agronomy Lab-KFUEIT | Enzyme assays | |
| PVP (Polyvinylpyrrolidone) | Sigma-Aldrich, Agronomy Lab-KFUEIT | Added to extraction buffer (1% w/v); binds phenolic compounds released during tissue homogenization, preventing enzyme inhibition. | |
| R software | R Foundation for Statistical Computing, Vienna, Austria | PCA and heatmap analyses (Figures 4 and 5); exact R version to be confirmed. | |
| Riboflavin | Agronomy Lab-KFUEIT | SOD assay | |
| Spectrophotometer | Shimadzu | UV-1800 | Absorbance readings at 240, 290, 470, 515, 520, 560, 645, and 663 nm. |
| Statistical software (Statistix 8.1) | Analytical Software, Tallahassee, FL, USA | Version 8.1 | Two-way ANOVA and LSD test |
| Sucrose standard | Sigma-Aldrich, Agronomy Lab-KFUEIT | Used to construct a calibration curve for accurate sucrose quantification in leaf samples. | |
| Tween-20 | Sigma-Aldrich, Agronomy Lab-KFUEIT | Non-ionic surfactant in ascorbic acid foliar spray (0.1% v/v); reduces surface tension for even leaf coverage and enhanced absorption. |
المراجع
- Khan AG, et al. Performance of spring and summer-sown maize under different irrigation strategies in Pakistan. Sustainability. 2021;13(5):2757.
- World Bank. Pakistan reforms for a brighter future, policy note 4: unleashing the agri-food sector – towards productive and climate-resilient agriculture. World Bank; Washington, DC; 2023. Available from: https://thedocs.worldbank.org/en/doc/59dbf031f78c1a096ef5692feac018e9-0310062023/original/Pakistan-Reforms-For-A-Brighter-Future-Policy-Note-4-Unleashing-the-Agri-Food-Sector.pdf
- Government of Pakistan, Finance Division. Pakistan Economic Survey 2022–23. Finance Division; Islamabad; 2023. Available from: https://www.finance.gov.pk/survey_2023.html
- Kalaji HM, et al. Prompt chlorophyll fluorescence as a tool for crop phenotyping: an example of barley landraces exposed to various abiotic stress factors. Photosynthetica. 2018;56(3):953–61.
- Anjum SA, et al. Drought induced changes in growth, osmolyte accumulation and antioxidant metabolism of three maize hybrids. Front Plant Sci. 2017;8:69.
- Farooq M, et al. Plant drought stress: effects, mechanisms and management. Agron Sustain Dev. 2009;29(1):185–212.
- Ashraf M, et al. Roles of glycine betaine and proline in improving plant abiotic stress resistance. Environ Exp Bot. 2007;59(2):206–16.
- Iqbal R, et al. Enhancing crop resilience through thiamine: implications for sustainable agriculture in drought-stressed radish. Not Bot Horti Agrobot Cluj Napoca. 2024;52(1):13472.
- Du Y, et al. Effect of drought stress on sugar metabolism in leaves and roots of soybean seedlings. Plant Physiol Biochem. 2020;146:1–12.
- Głodowska M, et al. Biochar is a growth-promoting alternative to peat moss for the inoculation of corn with a pseudomonad. Agron Sustain Dev. 2016;36(1):21.
- Abd El-Mageed TA, et al. Acidified biochar as a soil amendment to drought stressed (Vicia faba L.) plants: influences on growth and productivity, nutrient status, and water use efficiency. Agronomy. 2021;11(7):1290.
- Ahmadpour R, et al. Effect of ecophysiological characteristics of tomato (Lycopersicon esculentum L.) in response to organic fertilizers (compost and vermicompost). Not Bot Horti Agrobot Cluj Napoca. 2020;48(3):1248–59.
- Nehela Y, et al. The integrated amendment of sodic-saline soils using biochar and plant growth-promoting rhizobacteria enhances maize (Zea mays L.) resilience to water salinity. Plants (Basel). 2021;10(9):1960.
- Kadhim JJ, et al. Study of seed soaking and foliar application of ascorbic acid, citric acid and humic acid on growth, yield and active components in maize. IOP Conf Ser Earth Environ Sci. 2021;910(1):012076. Available from: https://doi.org/10.1088/1755-1315/910/1/012076
- Karvar M, et al. Potassium silicate reduces water consumption, improves drought tolerance, and enhances the productivity of sweet corn (Zea mays) under deficit irrigation. Acta Physiol Plant. 2023;45(3):38.
- Arnon DI. Copper enzymes in isolated chloroplasts. Polyphenoloxidase in Beta vulgaris. Plant Physiol. 1949;24(1):1–15.
- Lichtenthaler HK, et al. Determinations of total carotenoids and chlorophylls a and b of leaf extracts in different solvents. Biochem Soc Trans. 1983;11(5):591–2.
- Aebi H. Catalase in vitro. Methods Enzymol. 1984;105:121–6.
- Giannopolitis CN, et al. Superoxide dismutases: I. Occurrence in higher plants. Plant Physiol. 1977;59(2):309–14.
- Nakano Y, et al. Hydrogen peroxide is scavenged by ascorbate-specific peroxidase in spinach chloroplasts. Plant Cell Physiol. 1981;22(5):867–80.
- Bates LS, et al. Rapid determination of free proline for water-stress studies. Plant Soil. 1973;39(1):205–7.
- van Handel E. Direct microdetermination of sucrose. Anal Biochem. 1968;22(2):280–3.
- Irigoyen JJ, et al. Water stress induced changes in concentrations of proline and total soluble sugars in nodulated alfalfa (Medicago sativa) plants. Physiol Plant. 1992;84(1):55–60.
- Steel RGD, et al. Principles and procedures of statistics: a biometrical approach. 3rd ed. McGraw-Hill; New York; 1997.
- Badr A, et al. Special issue in honour of Prof. Reto J. Strasser – Comparative analysis of drought stress response of maize genotypes using chlorophyll fluorescence measurements and leaf relative water content. Photosynthetica. 2020;58(SI):638–45.
- Pandit NR, et al. Nutrient effect of various composting methods with and without biochar on soil fertility and maize growth. Arch Agron Soil Sci. 2020;66(2):250–65.
- Abdel-Aziz HMM, et al. Effect of multi-walled carbon nanotubes, urea, and peat moss on growth and yield of bean plants cultivated in sandy soil. J Soil Sci Plant Nutr. 2022;22(1):1173–87.
- Ali S, et al. Biochar soil amendment on alleviation of drought and salt stress in plants: a critical review. Environ Sci Pollut Res Int. 2017;24(14):12700–12.
- Bijanzadeh E, et al. Foliar application of sodium silicate mitigates drought stressed leaf structure in corn (Zea mays L.). S Afr J Bot. 2022;147:8–17.
- Armand N, et al. The effects of spraying methanol solution and drought stress on level of antioxidant enzyme activity, growth, biomass and yield of beans (Phaseolus vulgaris L. cv. COS16). Legume Res. 2016;39(3):385–95.
- Khan W, et al. Utilizing hydrothermal time models to assess the effects of temperature and osmotic stress on maize (Zea mays L.) germination and physiological responses. BMC Plant Biol. 2023;23(1):414.
- Jatuwong K, et al. Effects of biochar and arbuscular mycorrhizal fungi on soil health in Chinese kale (Brassica oleracea var. alboglabra L.) cultivation. Microbiol Res. 2024;15(1):404–21.
- Jiang M, et al. Water stress-induced abscisic acid accumulation triggers the increased generation of reactive oxygen species and up-regulates the activities of antioxidant enzymes in maize leaves. J Exp Bot. 2002;53(379):2401–10.
- Jowkar M, et al. Alterations in seed vigor and antioxidant enzymes activities in Silybum marianum under seed priming with KNO3. J Med Plants Res. 2012;6(7):1176–80.
- Sattar A, et al. Exogenous application of strigolactone alleviates drought stress in maize seedlings by regulating the physiological and antioxidants defense mechanisms. Cereal Res Commun. 2022;50(2):263–72.
- Mazloom N, et al. Lignin-based hydrogel alleviates drought stress in maize. Environ Exp Bot. 2020;175:104055.
- Iqbal H, et al. Unveiling the impact of organically activated biochar on physiological, biochemical, and yield attributes of maize under varied field moisture conditions. PeerJ. 2024;12:e17883.