Using 518 PubMed-indexed articles published between January 2016 and August 2025, this bibliometric study maps publication patterns, collaboration networks, keyword structures, and temporal trends in pediatric music therapy. The findings show growing attention to critical-care settings, multidisciplinary applications, and digital-health-related themes.
مقالة بحثية
Research Landscape and Emerging Frontiers in Pediatric Music Therapy: A Bibliometric Visualization Study
في هذه المقالة
ملخص
الملخص
This bibliometric study aimed to characterize publication patterns, collaboration networks, keyword structures, and temporal trends in pediatric music therapy. We analyzed 518 PubMed-indexed articles published between January 2016 and August 2025 using CiteSpace, VOSviewer, SCImago Graphica, and Excel. Publication and collaboration activities were concentrated in North America, Europe, and Asia. Keyword analyses identified themes involving cognitive function, language development, motor skills, mental health, quality of life, creative arts therapy, and systems analysis. The literature also spanned pediatrics, nursing, public health, physical therapy, and complementary medicine. Online delivery became more prominent during the COVID-19 period, and recent keywords included digital health-related topics. However, the keyword network remained sparse, indicating limited integration across research themes. These findings describe the intellectual structure and thematic development of the field but do not establish the clinical effectiveness of music therapy. Future research should prioritize methodological standardization, broader collaboration, and rigorous clinical evaluation.
المقدمة
Music therapy has been used as a nonpharmacological adjunct in pediatric and related clinical settings. Published work relevant to this field includes a protocol on COVID-19-related mental health1, pediatric oncology2, preschool settings that include children with disabilities3, pediatric neurodisability4, specialized inpatient palliative cancer care5, and hospitalized infants6. Within pediatric oncology, related studies have examined parent decision support, global childhood cancer incidence, and age-related patterns of integrative-medicine use7,8,9. In children with autism spectrum disorder, music therapy has been studied in relation to social skills10. Pediatric neurorehabilitation approaches have also combined patterned sensory enhancement and rhythmic auditory stimulation with physical therapy11.
Although the pediatric music therapy literature is expanding, its overall knowledge structure, collaboration patterns, and thematic evolution have not been comprehensively mapped. Narrative reviews synthesize individual studies but are not designed to quantify macro-level publication and network patterns. Therefore, this study used bibliometric and visualization methods to characterize publication output, collaboration networks, keyword structure, and temporal evolution in pediatric music therapy research from 2016 to 2025 and to identify gaps for future investigation.
البروتوكول
Ethics approval was not required because this study analyzed publicly available bibliographic metadata and did not involve human participants, identifiable personal data, or animal research. All authors are responsible for reviewing and approving the final manuscript before resubmission.
Literature retrieval, screening, and data preprocessing
PubMed was selected as the source database. The search strategy was: ((("Music Therapy"[Mesh]) OR (Therapy, Music)) AND (((("Patient Care"[Mesh]) OR (Care, Patient)) OR (Informal care)) OR (Informal cares))) AND (("Pediatrics"[Mesh]) OR (("Child"[Mesh]) OR (children))). Records were eligible if they (i) were indexed in PubMed between 1 January 2016 and 15 August 2025, (ii) focused on music therapy for patients younger than 18 years, and (iii) were original research articles or reviews published in English. Eligibility was assessed by screening the title and abstract of each retrieved record against the predefined inclusion and exclusion criteria, with the full record reviewed when eligibility could not be determined from the title and abstract alone. Data cleaning was performed before bibliometric analysis using predefined rules. Duplicate records were identified by matching PubMed identifiers (PMIDs) and, when necessary, by cross-checking article titles, authors, publication years, and journal information; only one record was retained for each publication. Author names were standardized by using a consistent surname-and-initial format and by reconciling variations in punctuation, spacing, and the presentation of initials. Institutional affiliations were harmonized by consolidating abbreviated and full institutional names and removing differences attributable solely to punctuation or departmental wording while preserving the parent institution. Country names were standardized to a single form; for example, ‘USA,’ ‘US,’ and ‘America’ were merged as ‘United States’. Journal-title variants were standardized according to the corresponding PubMed journal record. For keyword preprocessing, capitalization variants, abbreviations, singular/plural forms, and terms representing the same concept were merged; for example, ‘preterm infant’ and ‘preterm infants’ were standardized as ‘preterm infant’. Representative examples included ‘Child’, ‘Children’, and ‘Pediatric’, ‘ASD’ and ‘autism spectrum disorder’, and ‘Music Therapy’ and ‘music therapy’. Nine records were excluded: five because they had been retracted and four because they did not meet the predefined eligibility criteria (study population not restricted to patients younger than 18 years, n = 2; ineligible publication type, n = 2), leaving 518 articles for analysis.
Bibliometric and keyword analysis
Microsoft Excel 16.89.1, CiteSpace 6.4.R1, VOSviewer 1.6.20, and SCImago Graphica 1.0.51 were used for the analyses. Excel was used to extract field information, calculate word frequencies, and generate charts. CiteSpace was used for deduplication, synonym merging, keyword co-occurrence analysis, burst detection, timeline analysis, and time-zone analysis. The workflow included data import, project configuration, preprocessing, analysis, and result export. The analysis covered January 2016 to 15 August 2025, with one year per slice. The g-index was applied with k = 25, and the remaining parameters were retained at the software default settings. Comparable CiteSpace workflows have been reported in prior cross-domain bibliometric studies12,13.
Collaboration network analysis and visualization
VOSviewer was used to construct author- and country-level collaboration networks. For the country-level network, co-authorship analysis was performed using countries as the unit of analysis, with links representing co-authorship relationships between countries. The resulting country-network data were exported from VOSviewer and imported into SCImago Graphica for visualization; network relationships generated in VOSviewer were retained without recalculation. Counting was based on documents; the maximum label length was 30, with a maximum of 1,000 lines and a minimum link strength of 0. Figure 1 summarizes record retrieval, eligibility screening, data cleaning, and the analyses performed using Excel, CiteSpace, VOSviewer, and SCImago Graphica.
النتائج
Distribution of publications across journals
Annual publication output showed an overall upward pattern during the study period, increasing from 32 publications in 2016 to 72 in 2024, with year-to-year fluctuations.
From 2016 to 2025, the ten most productive journals published 132 articles, accounting for 25.5% of the 518 included publications, with a mean Impact Factor (IF) of 2.9 (Table 1). Journal of Music Therapy published 52 articles, representing 39.4% of the 132 articles in the top ten journals. Other journals publishing at least ten articles were the International Journal of Environmental Research and Public Health (n = 16), Acta Paediatrica (n = 13), PLOS One (n = 11), and Journal of Pediatric Nursing (n = 10). International Journal of Environmental Research and Public Health had the highest IF, at 4.8. Among the ten journals, 20% were classified as Journal Citation Reports (JCR) Q1 and 70% as Q2. Journal of Music Therapy had the largest publication count but a lower IF and quartile ranking than several other journals in the group. The journals represented the disciplines of music therapy, pediatrics, nursing, public health, and complementary therapy.
Network analysis of collaborative relationships
Analysis of national collaboration
Country names were standardized according to the preprocessing rules described in the Protocol. The resulting country-collaboration network was visualized using SCImago Graphica (Figure 2A). Collaboration links involved the United States, China, Australia, Canada, Norway, Denmark, Israel, Poland, Turkey, and Italy, while China was also connected with Finland, Brazil, Iran, and Singapore. Publication output was led by the United States (n = 140) and China (n = 65), followed by Australia (n = 38), Canada (n = 31), Germany (n = 29), Norway (n = 26), the Netherlands (n = 24), and Turkey and Italy (n = 22 each); France also appeared among the top ten countries (Figure 2B). Output was therefore concentrated in North America, Asia, and Europe.
Researcher collaboration and academic influence
The VOSviewer author network identified several collaboration groups (Figure 3). Connected authors included Monika Geretsegger, Grace Thompson, Christian Gold, Cochavit Elefant, Łucja Bieleninik, Shulamit Epstein, Ingrid Kvestad, Jörg Assmus, Mark Ettenberger, Tora Söderström Gaden, Bente Johan Vederhus, and Shmuel Arnon. The ten authors with the highest publication output were Christian Gold, Cochavit Elefant, Łucja Bieleninik, Qiang Chen, Hua Cao, Jörg Assmus, Shmuel Arnon, Dirk Bassler, Nienke H. van Dokkum, and Ya Li Huang (Table 2). These authors were affiliated with institutions in Norway, Israel, Poland, China, Switzerland, and the Netherlands. The network included several regional and cross-national teams, including established groups in Europe and Israel, as well as contributors from Fujian Province, China.
Analysis of keywords and research hotspots
Analysis of the keyword co-occurrence network
CiteSpace identified 286 keyword nodes and 253 co-occurrence links, with a network density of 0.0062 (Figure 4). Node size represented keyword frequency, purple rings indicated high betweenness centrality, red tree rings indicated burst periods, and links represented keyword co-occurrence, with thicker links indicating stronger associations. The low density indicated a sparse network with limited co-occurrence among topics14. Keywords were standardized according to the preprocessing rules described in the Protocol before construction of the co-occurrence network. Prominent themes included music therapy, art therapy, systems analysis, mental health, and quality of life.
Table 3 presents the twenty keywords with the highest reported frequency and centrality values. "Music therapy" occurred 147 times and had a centrality of 0.71; "systematic review" occurred 18 times with a centrality of 0.14; "mental health" occurred 6 times with a centrality of 0.12; "art therapy" occurred 14 times with a centrality of 0.11; "autism spectrum disorder" occurred 14 times with a centrality of 0.10; and "music intervention" occurred 8 times with a centrality of 0.10. Betweenness centrality reflects the extent to which a node connects otherwise separated parts of a network. Thus, "music therapy" was the principal connecting term, while "systematic review" had the second-highest centrality despite its lower frequency.
Overall, the low-density co-occurrence network was sparse, with limited integration among its principal topics. Mental health and music intervention were among the themes identified for further investigation.
Analysis of keyword cluster and emerging terms
Keyword clustering was performed using the log-likelihood ratio algorithm with one year per time slice14. This approach has been used to identify research hotspots and thematic trends in previous bibliometric studies15. The resulting keyword-cluster map is shown in Figure 5. The analysis yielded a Modularity Q of 0.85 and a Weighted Mean Silhouette S of 0.98. These values exceeded the stated thresholds of Q > 0.3 and S > 0.7, indicating well-separated and internally coherent clusters. The ten largest clusters were music therapy, art therapy, systematic review, integrative medicine, preterm infant, music intervention, autism spectrum disorder, complementary medicine, cardiac surgery, and mental health (Figure 5). The map showed several distinct thematic groupings, with links between neighboring clusters indicating overlap among related research topics. Cluster labels were numbered #0–#9, with lower numbers denoting clusters containing more keywords.
Burst terms are keywords whose frequency increases sharply during a defined period. CiteSpace identified 23 burst terms in the current dataset (Figure 6). Early burst terms included "hematopoietic stem cell transplantation," "cochlear implant," "qualitative research," and "music reminiscence activity." These terms describe changes in keyword attention and do not by themselves establish clinical importance or intervention effectiveness.
Several burst terms were confined to short intervals. From 2018 to 2019, acute pain, auditory integration training, complementary and alternative medicine, and developmental care appeared as burst terms. From 2020 to 2021, neonatal intensive care unit (NICU), critical care, and cardiac surgery appeared. Mental health and the COVID-19 pandemic were observed from 2021 to 2023, followed by terms including intensive care unit, hospitalized children, and pain management after 2022. These patterns indicate shifts in publication emphasis rather than a validated sequence of clinical development.
In the current analysis, "music intervention" had the strongest burst intensity (2.43), followed by "creative arts therapy" and "intensive care unit" (1.46 each). The burst analysis suggests that publication attention broadened from rehabilitation and complementary approaches toward critical-care settings, evidence synthesis, and more systematic descriptions of music interventions. Because burst strength measures changes in keyword frequency, it should not be interpreted as evidence of treatment effectiveness or clinical maturity.
Research frontiers and temporal evolution
Figure 7 displays the temporal distribution of keyword clusters #0–#9 in the cluster-timeline analysis. The earliest clusters included music therapy, systematic review, music intervention, cardiac surgery, and mental health. The preterm infant cluster first appeared in 2018. Music therapy, systematic review, and mental health persisted across the full ten-year period, whereas cardiac surgery had the shortest duration, at five years. Art therapy, qualitative research, and complementary medicine became visible from 2017 onward.
The time-zone map contained 286 nodes and 309 edges, with a density of 0.0076, a Modularity Q of 0.85, and a Weighted Mean Silhouette S of 0.99 (Figure 8)16. The sparse network nevertheless contained well-separated clusters. Three descriptive periods were observed. During 2016–2017, prominent terms included music therapy, mental health, heart rate, and anxiety. During 2018–2021, terms included preterm infant, quality of life, auditory integration training, sensory processing, and pediatric oncology. During 2022–2025, terms increasingly referred to specific clinical settings, including intensive care and neonatal intensive care, as well as evidence-synthesis terms such as systematic review and bibliometric analysis. Keywords appearing during 2021–2025 also included digital health, connected health, auditory novelty detection, and kangaroo care. These patterns describe changes in keyword attention and should not be interpreted as evidence of increasing intervention precision or effectiveness.
Data Availability:
The bibliographic data underlying this study have been deposited in Zenodo and are publicly available at https://zenodo.org/records/22171844. The deposited files include the original PubMed records retrieved using the search strategy described in the Protocol, the cleaned and standardized dataset used for bibliometric analysis, the keyword and synonym normalization table, and the relevant analysis output files used to generate the reported results and figures. No new primary data were collected for this study.
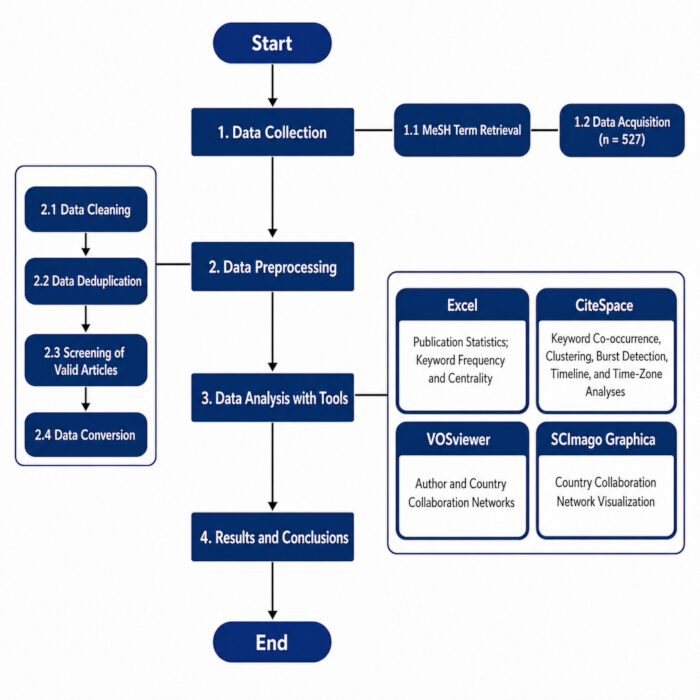
Figure 1: Research flowchart. PubMed retrieval yielded 527 records. After data cleaning, deduplication, and eligibility screening, 5 retracted records and 4 records that did not meet the eligibility criteria were excluded, leaving 518 articles for analysis. Excel was used for publication statistics; CiteSpace for keyword co-occurrence, clustering, burst detection, and temporal analyses; VOSviewer for author- and country-level collaboration networks; and SCImago Graphica for visualization of the country-collaboration network. Please click here to view a larger version of this figure.
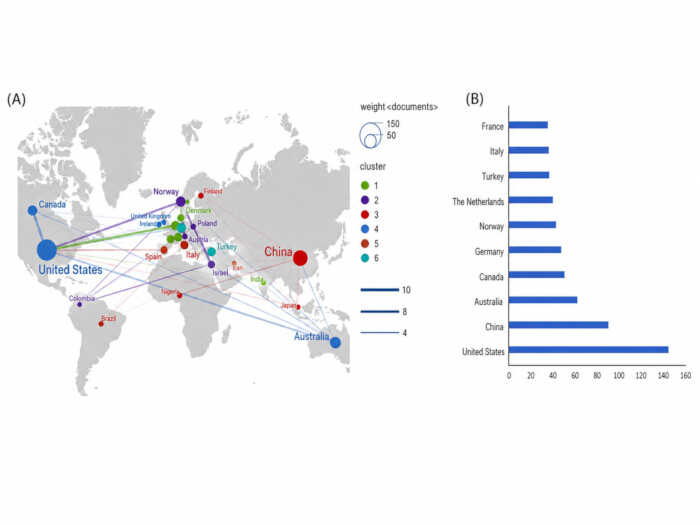
Figure 2: Country collaboration network and top 10 countries by publication output in pediatric music therapy research (2016–2025). (A) Links represent country-level collaboration, with thicker links indicating stronger connections and colors indicating collaboration groups. (B) Publication output was concentrated in a limited number of countries, led by the United States and China, followed by Australia, Canada, Germany, Norway, the Netherlands, Turkey, Italy, and France. Please click here to view a larger version of this figure.
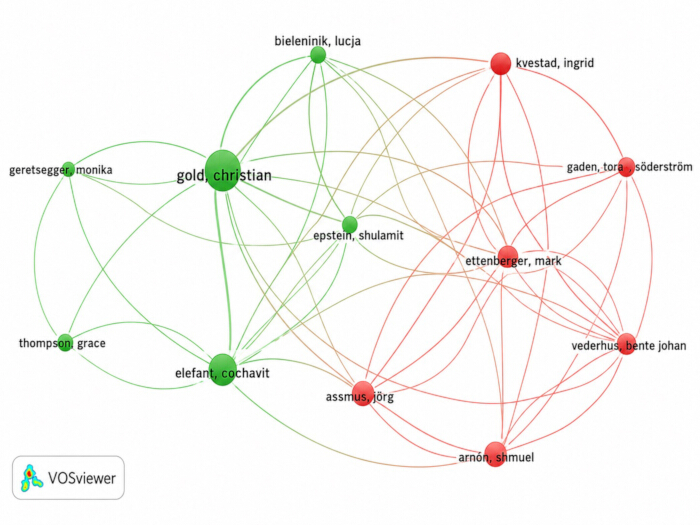
Figure 3: Author collaboration network in pediatric music therapy research (2016–2025). Nodes represent authors, links represent co-authorship relationships, and colors indicate collaboration clusters. The network contains several distinct research groups, with Christian Gold among the authors connecting collaborative teams. Please click here to view a larger version of this figure.
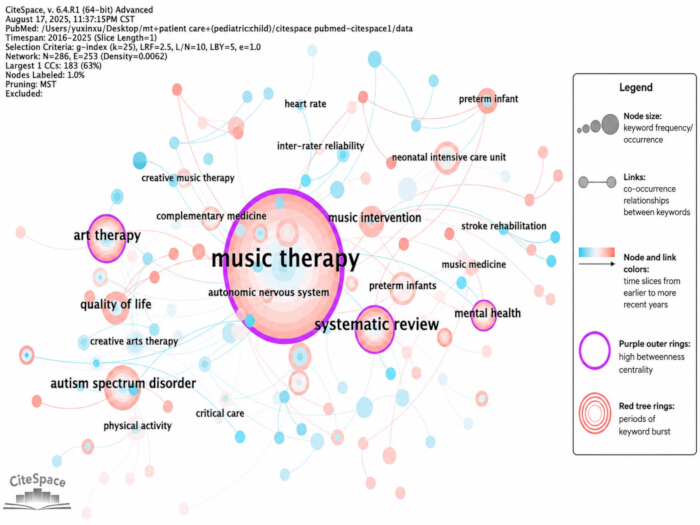
Figure 4: Keyword co-occurrence map in pediatric music therapy research (2016–2025). Nodes represent keywords; node size indicates frequency; purple rings indicate high betweenness centrality; red tree rings indicate periods of keyword burst; and links indicate keyword co-occurrence. The map identifies frequently occurring and structurally central topics, including music therapy, systematic review, art therapy, quality of life, and mental health. Please click here to view a larger version of this figure.
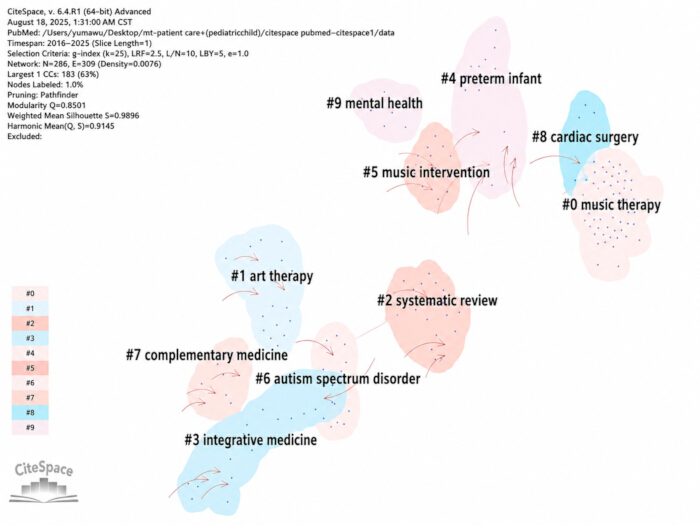
Figure 5: Keyword cluster analysis of pediatric music therapy research (2016–2025). The CiteSpace cluster map displays the ten largest keyword clusters, labeled #0–#9, with lower cluster numbers indicating larger clusters. Major clusters included music therapy, art therapy, systematic review, integrative medicine, preterm infant, music intervention, autism spectrum disorder, complementary medicine, cardiac surgery, and mental health. The clustering yielded a Modularity Q of 0.85 and a Weighted Mean Silhouette S of 0.98, indicating well-separated and internally coherent clusters. Please click here to view a larger version of this figure.
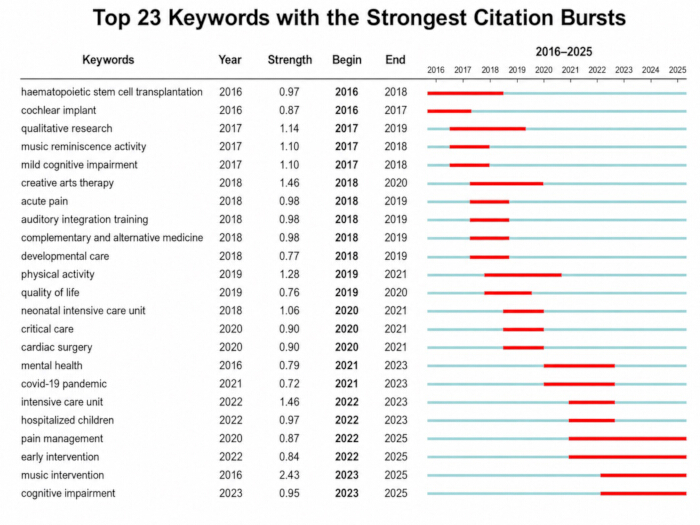
Figure 6: Top 23 keywords with the strongest citation bursts. Burst detection identifies keywords whose frequency increased sharply during specific periods between 2016 and 2025. The figure describes temporal changes in keyword attention; burst strength does not measure clinical importance or intervention effectiveness. Please click here to view a larger version of this figure.
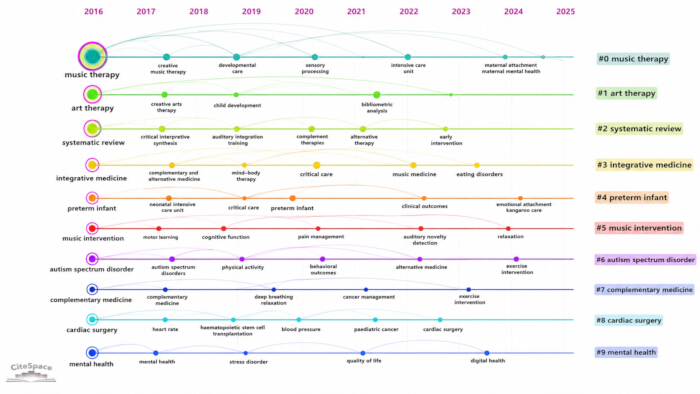
Figure 7: Keyword-cluster timeline in pediatric music therapy research (2016–2025). Each horizontal line represents a keyword cluster, and node positions indicate when keywords within that cluster appeared and persisted. The timeline describes changes in the occurrence of keyword clusters over the study period. Please click here to view a larger version of this figure.
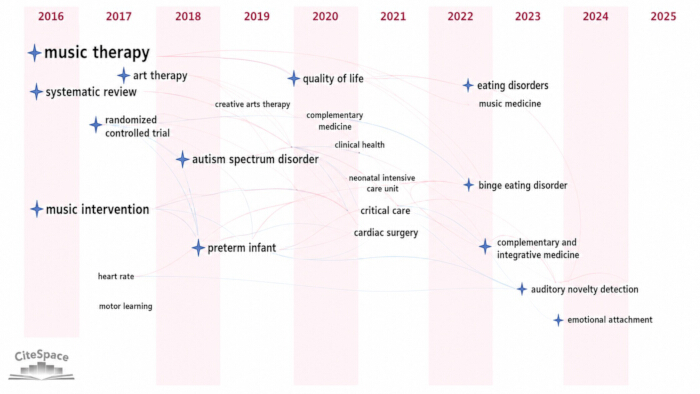
Figure 8: Keyword time-zone map in pediatric music therapy research (2016–2025). Individual keywords are arranged by year of appearance, and links show relationships across successive periods. The network contains 286 nodes and 309 edges, with a density of 0.0076, Modularity Q of 0.85, and Weighted Mean Silhouette S of 0.99. The combination of low density and high Q and S values indicates a sparse network containing well-separated clusters. Please click here to view a larger version of this figure.
| Journal | Count | Percentage of included publications (N = 518) | Impact factor (2021-2025) | JCR quartile |
| Journal of music therapy | 52 | 10.00% | 1.9 | Q4 |
| International journal of environmental research and public health | 16 | 3.10% | 4.8 | Q2 |
| Acta paediatrica | 13 | 2.50% | 2.5 | Q2 |
| PloS one | 11 | 2.10% | 3.2 | Q2 |
| Journal of pediatric nursing | 10 | 1.90% | 2.7 | Q1 |
| Complementary therapies in clinical practice | 7 | 1.30% | 3.3 | Q2 |
| BMC pediatrics | 6 | 1.20% | 2.5 | Q2 |
| BMJ open | 6 | 1.20% | 2.7 | Q2 |
| Medicine | 6 | 1.20% | 1.6 | Q2 |
| Complementary therapies in medicine | 5 | 1.00% | 3.8 | Q1 |
| / | 132 | 25.50% | 2.9 | / |
Table 1: Top 10 journals by publication output in pediatric music therapy (2016–2025). The ten journals published 132 articles, representing 25.5% of the included publications. Percentages for individual journals were calculated using the full included dataset (N = 518) as the denominator. Two journals were classified as JCR Q1, seven as Q2, none as Q3, and one as Q4.
| Number | Author | Count | Percentage (N=518) | Institutions, and Countries |
| 1 | Gold, Christian | 17 | 3.28% | University of Bergen, Norway |
| 2 | Elefant, Cochavit | 11 | 2.12% | University of Haifa, Israel |
| 3 | Bieleninik, Łucja | 11 | 2.12% | Gdańsk University, Poland |
| 4 | Chen, Qiang | 9 | 1.74% | Fujian Maternity and Child Health Hospital, China |
| 5 | Cao, Hua | 8 | 1.54% | Fujian Maternity and Child Health Hospital, China |
| 6 | Assmus, Jörg | 8 | 1.54% | Norwegian Research Centre, Norway |
| 7 | Arnon, Shmuel | 7 | 1.35% | Tel Aviv University, Israel |
| 8 | Bassler, Dirk | 7 | 1.35% | University Hospital Zurich and University of Zurich, Switzerland |
| 9 | Van Dokkum, Nienke H | 5 | 0.97% | University of Groningen, Netherlands |
| 10 | Huang, Ya-Li | 5 | 0.97% | Fujian Maternity and Child Health Hospital, China |
Table 2: Top 10 authors by publication output in pediatric music therapy (2016–2025). The table reports each author's publication count and institutional affiliation. The listed authors were affiliated with institutions in Europe, the Middle East, and Asia, reflecting the international distribution of research activity.
| Frequency | Centrality | Year | Keywords |
| 147 | 0.71 | 2016 | music therapy |
| 18 | 0.14 | 2016 | systematic review |
| 14 | 0.1 | 2018 | autism spectrum disorder |
| 14 | 0.11 | 2017 | art therapy |
| 8 | 0.04 | 2019 | quality of life |
| 8 | 0.1 | 2016 | music intervention |
| 8 | 0.02 | 2021 | preterm infant |
| 7 | 0.01 | 2018 | neonatal intensive care unit |
| 6 | 0.12 | 2016 | mental health |
| 6 | 0.01 | 2017 | qualitative research |
| 6 | 0.01 | 2020 | pain management |
| 5 | 0.04 | 2017 | randomized controlled trial |
| 5 | 0.02 | 2017 | complementary medicine |
| 4 | 0 | 2016 | cochlear implant |
| 4 | 0.01 | 2018 | preterm infant |
| 4 | 0.01 | 2018 | creative arts therapy |
| 4 | 0.01 | 2020 | heart rate variability |
| 4 | 0.04 | 2019 | physical activity |
| 4 | 0.01 | 2019 | child development |
| 3 | 0.01 | 2016 | speech therapy |
Table 3: Top 20 keywords in pediatric music therapy research (2016–2025). The table reports keyword frequency, betweenness centrality, and year of first occurrence. Music therapy had the highest frequency and centrality; other prominent terms included systematic review, mental health, art therapy, autism spectrum disorder, and music intervention.
المناقشة
The bibliometric findings can be interpreted across three broad thematic domains: functional rehabilitation, psychological and behavioral outcomes, and critical-care support. Music-based interventions have been studied for speech rehabilitation in hearing-impaired children17, for motor and emotional outcomes in a neurological case18, and for speech and language development in hearing-impaired children19. Music therapy has also been studied in children and adolescents with neurodisability4, for distress and anxiety in pediatric oncology2, for social skills in children with autism spectrum disorder10, for pain and anxiety during lumbar puncture in children with cancer20, and for parent-related outcomes in neonatal intensive care21,22. These studies illustrate the literature represented in the maps; because the present analysis did not evaluate study-level effect sizes or risk of bias, they should not be interpreted as collective proof of clinical effectiveness.
Publication output was distributed across music therapy, pediatrics, nursing, public health, and complementary therapy journals, and most of the ten highest-output journals were classified as JCR Q1 or Q2. This distribution suggests that pediatric music therapy has cross-disciplinary visibility. However, journal-level Impact Factors and quartile rankings do not establish the methodological quality of the individual studies included in this bibliometric analysis.
The country and author networks showed that research activity was concentrated in North America, Europe, and Asia, with collaboration links across these regions. European and Israeli teams occupied central positions in the author network, while researchers from Fujian Province contributed to increasing publication output. At the same time, the network's limited connectivity suggests that international collaboration remains uneven. Broader cross-regional and interdisciplinary partnerships may help researchers compare culturally responsive approaches without implying that musical content should be standardized across settings.
The keyword themes were consistent with the literature on pediatric neurodevelopment. Music intervention may improve some language, motor, and intelligence quotient outcomes, whereas cognitive findings remain inconsistent23. Related work has addressed pain and anxiety in hospitalized children24, conceptualized creative arts therapy in relation to quality of life, well-being, psychosocial symptoms, and pain in pediatric oncology25, and examined creative, art, music, or exercise approaches in diabetes26, autism27, and adolescents after ventricular septal defect closure28. Together, these studies demonstrate the breadth of outcomes investigated, but they do not establish an overall treatment effect. The low density of the keyword network further suggests that these themes remain only weakly integrated.
The temporal maps suggested a change in research attention from rehabilitation and psychological outcomes toward specific clinical settings, evidence synthesis, and multidisciplinary themes. The co-occurrence of terms related to quality of life, cognitive function, academic achievement, creative arts therapy, and complementary medicine indicates thematic overlap with education, nursing, pediatrics, and integrative medicine. Because these maps are based on keyword frequency and timing, the observed sequence should be interpreted as a change in publication emphasis rather than proof that interventions have progressed from preliminary validation to clinical translation.
The COVID-19 pandemic coincided with increased attention to remote delivery. The literature represented in the dataset described pediatric music-therapy case studies during the pandemic29, online delivery for children with asthma30, and home-based music therapy for children with developmental disorders31. Music therapy was also proposed as a potential approach to anxiety and depression during the COVID-19 pandemic1,32. These observations indicate changes in research topics and delivery formats rather than comparative evidence of effectiveness.
The mapping also suggested increasing attention to high-risk pediatric settings, including preterm infant care21,22 and critically ill children33. The keywords "digital health" and "connected health" appeared after 2022. Adjacent pediatric research has examined immersive virtual reality for procedural pain and anxiety34 and virtual-reality gaming for early mobilization in the pediatric intensive care unit35. These studies illustrate broader digital health trends but do not directly establish the efficacy of digital music therapy or palliative care.
This study has four principal limitations. First, it analyzed aggregated bibliographic metadata, including titles, abstracts, and keywords, and therefore did not assess study-level methodological quality, risk of bias, effect sizes, or clinical outcomes. Second, bibliometric findings may be influenced by citation practices, publication bias, and preferential publication of positive results. Third, the analysis was restricted to English-language records indexed in PubMed; including Web of Science, Scopus, PsycINFO, and other databases could yield a broader literature set. Fourth, coverage of 2025 was incomplete because the search ended on 15 August 2025.
Conclusion:
This bibliometric analysis of 518 PubMed-indexed publications from January 2016 to August 2025 characterized the research landscape of pediatric music therapy and identified three recurring thematic areas: functional rehabilitation, psychological and behavioral outcomes, and critical-care support. Research topics extended to include cognitive, language, motor, mental health, and quality-of-life outcomes. Publication and collaboration activity were concentrated in North America, Europe, and Asia, while the literature was distributed across music therapy, pediatrics, nursing, public health, and complementary therapy journals. Remote delivery and digital health-related themes also became evident during the study period.
At the same time, the sparse keyword network and uneven international collaboration indicate limited integration across research themes and regions. These bibliometric patterns support stronger methodological standardization, broader international collaboration, and rigorous multicenter clinical evaluation. Because this study mapped publication metadata rather than clinical outcomes, its findings do not establish the effectiveness of music therapy or justify its routine adoption in pediatric care.
These findings identify priorities for future research rather than immediate practice recommendations. Prospective studies should evaluate music therapy in high-risk pediatric populations using predefined clinical outcomes, adequate comparator groups, and transparent risk-of-bias assessment. Digitally delivered, artificial intelligence (AI)-assisted, and wearable- or biofeedback-supported approaches should be compared with conventional music therapy or standard care before clinical implementation is recommended.
الإفصاحات
Generative AI tools were used solely to assist with language editing and figure formatting; all scientific content, interpretations, and final materials were reviewed and approved by the authors.
شكر وتقدير
We thank the researchers and institutions whose work made this bibliometric analysis possible. We also thank the developers of CiteSpace, VOSviewer, and SCImago Graphica for providing the analytical tools used in this study, and the Children's Hospital of Nanjing Medical University, City University of Macau, and Guangzhou Huashang College for academic support and resources. This research received no specific grant from any funding agency in the public, commercial, or not-for-profit sectors.
المواد
| الاسم | الشركة | رقم فهرسي | التعليقات |
|---|---|---|---|
| CiteSpace | Drexel University | https://citespace.podia.com/ | 6.4.R1 |
| Microsoft Excel | Microsoft Corporation | https://www.microsoft.com/microsoft-365/excel | Version 16.89.1 |
| PubMed Database | National Center for Biotechnology Information (NCBI) | https://pubmed.ncbi.nlm.nih.gov/ | N/A |
| SCImago Graphica | SCImago Lab | https://www.graphica.app/ | 1.0.51 |
| VOSviewer | Centre for Science and Technology Studies (CWTS), Leiden University | https://www.vosviewer.com/ | 1.6.20 |
المراجع
- Chen X, Li H, Zheng X, Huang J. Effects of music therapy on COVID-19 patients' anxiety, depression, and life quality: a protocol for systematic review and meta-analysis. Medicine (Baltimore). 2021;100(26):e26419. doi:10.1097/MD.0000000000026419.
- Facchini M, Ruini C. The role of music therapy in the treatment of children with cancer: a systematic review of literature. Complement Ther Clin Pract. 2021;42:101289. doi:10.1016/j.ctcp.2020.101289.
- Birch J, Thompson G. Exploring music therapy research in preschool settings that include children with disabilities: a scoping review. J Music Ther. 2023;60(1):64-97. doi:10.1093/jmt/thac015.
- Twyford K, et al. Functional outcomes in children and adolescents with neurodisability accessing music therapy: a scoping review. Dev Med Child Neurol. 2025;67(4):428-442. doi:10.1111/dmcn.16135.
- Kordovan S, et al. Prospective study on music therapy in terminally ill cancer patients during specialized inpatient palliative care. J Palliat Med. 2016;19(4):394-399. doi:10.1089/jpm.2015.0384.
- Sanchez K, Morgan AT. Music therapy for neurodevelopment in hospitalised infants. Acta Paediatr. 2019;108(5):784-786. doi:10.1111/apa.14745.
- Jong MC, et al. Development of an evidence-based decision aid on complementary and alternative medicine (CAM) and pain for parents of children with cancer. Support Care Cancer. 2020;28(5):2415-2429. doi:10.1007/s00520-019-05058-8.
- Steliarova-Foucher E, et al. International incidence of childhood cancer, 2001-10: a population-based registry study. Lancet Oncol. 2017;18(6):719-731. doi:10.1016/S1470-2045(17)30186-9.
- Yun H, et al. Utilization of integrative medicine differs by age among pediatric oncology patients. Pediatr Blood Cancer. 2019;66(6):e27639. doi:10.1002/pbc.27639.
- Zhou Z, et al. A randomized controlled trial of the efficacy of music therapy on the social skills of children with autism spectrum disorder. Res Dev Disabil. 2025;158:104942. doi:10.1016/j.ridd.2025.104942.
- McLean H, Melicosta M, Spurgeon N. Combining music therapy techniques with physical therapy in an individual following brain injury: a case study in the use of both patterned sensory enhancement and rhythmic auditory stimulation [abstract]. J Head Trauma Rehabil. 2022;37(6):E504-E505. doi:10.1097/HTR.0000000000000845.
- Zou C, Zhu J, Duan T, Tong S. Prefabricated buildings: cross-database CiteSpace bibliometric analysis of research trends and hotspots. Autom Constr. 2026;184:106837. doi:10.1016/j.autcon.2026.106837.
- Li C, et al. Agricultural science: a CiteSpace-based bibliometric analysis of global and Chinese research. J Sci Food Agric. 2026;106(8):4476-4495. doi:10.1002/jsfa.70288.
- Li J, Chen C. CiteSpace: text mining and visualization in scientific literature. 3rd ed. Capital University of Economics and Business Press; Beijing; 2022. Chinese.
- Zhou MS, Zhou J. [Hotspots and evolution trend of data elements research in China]. Journal of Henan University (Social Sciences). 2023;63(4):13-19,152. Chinese.
- Chen Y, Chen C, Hu Z, Wang X. [Principles and applications of citation space analysis: a practical guide to CiteSpace]. Science Press; Beijing; 2014. Chinese.
- Hao S, et al. The effect of different visual feedback interfaces of music training games on speech rehabilitation in hearing-impaired children: an fNIRS study. Neurosci Lett. 2024;843:138010. doi:10.1016/j.neulet.2024.138010.
- Spak D, Card E. Music, movement, and mind: use of drumming to improve strength, balance, proprioception, stamina, coordination, and emotional status in a 12-year-old with agenesis of the corpus callosum: a case study. J Holist Nurs. 2020;38(2):186-192. doi:10.1177/0898010119871380.
- Torppa R, Huotilainen M. Why and how music can be used to rehabilitate and develop speech and language skills in hearing-impaired children. Hear Res. 2019;380:108-122. doi:10.1016/j.heares.2019.06.003.
- Nguyen TN, Nilsson S, Hellström AL, Bengtson A. Music therapy to reduce pain and anxiety in children with cancer undergoing lumbar puncture: a randomized clinical trial. J Pediatr Oncol Nurs. 2010;27(3):146-155. doi:10.1177/1043454209355983.
- Kehl SM, et al. Creative music therapy with premature infants and their parents: a mixed-method pilot study on parents' anxiety, stress and depressive symptoms and parent-infant attachment. Int J Environ Res Public Health. 2021;18(1):265. doi:10.3390/ijerph18010265.
- Kraft KE, et al. Maternal anxiety, infant stress, and the role of live-performed music therapy during NICU stay in the Netherlands. Int J Environ Res Public Health. 2021;18(13):7077. doi:10.3390/ijerph18137077.
- Jiang D, et al. Music intervention for neurodevelopment in the pediatric population: a systematic review and meta-analysis. Sci Rep. 2025;15(1):10388. doi:10.1038/s41598-025-93795-8.
- Johnson AA, et al. Examining the effects of music-based interventions on pain and anxiety in hospitalized children: an integrative review. J Pediatr Nurs. 2021;60:71-76. doi:10.1016/j.pedn.2021.02.007.
- Raybin JL, Krajicek M. Creative arts therapy in the context of children with cancer: a concept analysis. J Pediatr Oncol Nurs. 2020;37(2):82-90. doi:10.1177/1043454219878397.
- Bacus IP, et al. Play, art, music and exercise therapy impact on children with diabetes. Ir J Med Sci. 2022;191(6):2663-2668. doi:10.1007/s11845-021-02889-5.
- Bernier A, et al. Art interventions for children with autism spectrum disorder: a scoping review. Am J Occup Ther. 2022;76(5):7605205030. doi:10.5014/ajot.2022.049320.
- Lin ZW, et al. The effect of music therapy on chronic pain, quality of life and quality of sleep in adolescents after transthoracic occlusion of ventricular septal defect. Heart Surg Forum. 2021;24(2):E305-E310. doi:10.1532/hsf.3513.
- Goicoechea T, Lahue K. Case studies in pediatric music therapy during COVID-19. Music Ther Perspect. 2021;39(2):126-132. doi:10.1093/mtp/miab009.
- Zhang D, et al. Online-merge-offline (OMO)-based music therapy for asthmatic children during the COVID-19 pandemic in China. Eur J Pediatr. 2024;183(3):1277-1286. doi:10.1007/s00431-023-05361-x.
- Bompard S, et al. Home-based music therapy for children with developmental disorders during the COVID-19 pandemic. J Telemed Telecare. 2023;29(3):211-216. doi:10.1177/1357633X20981213.
- Mastnak W. Psychopathological problems related to the COVID-19 pandemic and possible prevention with music therapy. Acta Paediatr. 2020;109(8):1516-1518. doi:10.1111/apa.15346.
- Mata Ferro M, et al. The effect of a live music therapy intervention on critically ill pediatric patients in the intensive care unit: a quasi-experimental pretest-posttest study. Aust Crit Care. 2023;36(6):967-973. doi:10.1016/j.aucc.2023.01.006.
- Gold JI, et al. Effect of an immersive virtual reality intervention on pain and anxiety associated with peripheral intravenous catheter placement in the pediatric setting: a randomized clinical trial. JAMA Netw Open. 2021;4(8):e2122569. doi:10.1001/jamanetworkopen.2021.22569.
- Lai B, et al. Examining the feasibility of early mobilization with virtual reality gaming using head-mounted display and adaptive software with adolescents in the pediatric intensive care unit: case report. JMIR Rehabil Assist Technol. 2021;8(2):e28210. doi:10.2196/28210.