This protocol describes the generation of an inverted human intestinal organoid-derived epithelial model that provides direct access to both the apical and basolateral sides of the epithelial monolayer, enabling studies of barrier function, immune cell migration, and epithelial–immune cell interactions.
مقالة منهجية
An Inverted Organoid-Derived Intestinal Epithelial Monolayer Model for Studying Immune Cell–Epithelial Interactions
في هذه المقالة
ملخص
الملخص
Human intestinal organoids provide a powerful model system to study epithelial biology by preserving key characteristics of intestinal tissue organization, cellular differentiation, and function. However, their three-dimensional architecture limits direct experimental access to the apical surface, which is enclosed within the organoid lumen. This restricted accessibility complicates studies requiring controlled stimulation of epithelial compartments, barrier analysis, and investigation of interactions between epithelial and immune cells. This protocol describes the generation of an inverted organoid-derived intestinal epithelial model designed to improve accessibility to both the apical and basal compartments while maintaining essential epithelial properties. In this approach, organoid-derived single cells are seeded onto an inverted permeable support, where they establish a polarized epithelial monolayer that retains important features of intestinal differentiation and organization. The open configuration enables direct use of epithelial compartments and facilitates functional applications, including compartment-specific stimulation and immune–epithelial interaction studies. Furthermore, the model allows the integration of immune cell co-culture approaches to investigate cellular communication and migration processes. This platform provides a practical and adaptable experimental system that bridges conventional three-dimensional organoid cultures and accessible epithelial monolayer models. It offers a valuable approach for studying intestinal barrier function, inflammatory responses, immune interactions, and disease-associated mechanisms under controlled experimental conditions.
المقدمة
Human intestinal organoids have revolutionized research in epithelial biology because they faithfully replicate key aspects of intestinal tissue organization, cellular diversity, and epithelial function1. Despite these advantages, the three-dimensional structure of conventional organoids poses an experimental challenge because the apical epithelial surface is enclosed within the organoid lumen2. This orientation limits direct access to the lumen and complicates studies requiring controlled stimulation, barrier analyses, host-microorganism interactions, and communication between epithelial and immune cells3.
To improve experimental accessibility, organoid-derived epithelial monolayer models have been established using permeable membrane-based culture systems such as Transwell inserts. These approaches enable separate access to the apical and basolateral compartments and provide valuable platforms for studying epithelial barrier integrity, transport mechanisms, and inflammatory responses4,5,6. However, conventional configurations can limit experimental flexibility in complex co-culture systems, particularly when direct interaction and migration of immune cells need to be investigated.
Several epithelial-immune co-culture systems have previously been reported using this general approach, including the primary human macrophage-enteroid co-culture model described by Noel et al.5, in which monocyte-derived macrophages are co-cultured with enteroid-derived epithelial monolayers to study epithelial–immune crosstalk and host-pathogen interactions, and an autologous colonic organoid-derived monolayer model that combines patient-matched immune cells and a commensal bacterium to study epithelial barrier integrity in Crohn's disease patients published by Angus et. al.7. In these and other conventional culture insert configurations, the epithelial monolayer is established on the upper, luminal-facing surface of the membrane. This orientation can complicate direct visualization of the apical surface, immune cell seeding onto the epithelium, and simultaneous, unobstructed manipulation of both compartments during co-culture, particularly for complex, multi-cell-type systems.
This method aims to establish an inverted organoid-derived intestinal epithelial model that combines epithelial polarization with improved accessibility for functional studies by giving access to both sides of the epithelium. In this approach, organoid-derived epithelial single cells are cultured on the outer surface of a coated culture insert, enabling direct, simultaneous access to both epithelial compartments throughout differentiation and co-culture, while preserving key features of intestinal epithelial differentiation and organization and avoiding technically demanding procedures such as microinjection into the organoid lumen.
This protocol outlines the generation, characterization, and application of the inverted epithelial model to study intestinal barrier function and immune–epithelial interactions. The system is validated by comparing epithelial morphology, differentiation, and polarity markers with those of conventional organoid cultures. Furthermore, the model’s accessibility enables controlled stimulation and immune cell co-culture, including migration assays with neutrophils and monocytes.
This method provides a complementary platform between complex three-dimensional organoid cultures and conventional two-dimensional epithelial monolayers. It is particularly suitable for researchers investigating intestinal inflammation, epithelial barrier regulation, immune cell interactions, and disease-associated mechanisms that require controlled access to both sides of the epithelial interface.
البروتوكول
All experiments involving human tissue and human blood were performed in accordance with the Declaration of Helsinki and were approved by the institutional ethics committee of the Medical Faculty Mannheim, Heidelberg University (approval number: 2023-587). We obtained written informed consent from all participants or their legal guardians before sample collection. The reagents and the equipment used are listed in the Table of Materials.
Sections 1.1–1.8 describe the establishment of the inverted epithelial monolayer together with the structural and functional assays used to validate it (TEER, FITC-dextran permeability, Annexin V/PI viability, and immunofluorescence), as these assays represent the primary criteria used to determine whether a monolayer is suitable for downstream immune cell co-culture (Section 4). Established procedures for human immune cell isolation and labeling (Sections 2–3) and analytical readouts specific to the co-culture endpoint (Sections 5–7) follow thereafter. Full compositions of all media and buffers referenced throughout this protocol are provided in Supplementary Table 1, and antibody/staining-reagent panels in Supplementary Table 2.
1. Culture insert preparation
- Preparation of extracellular matrix-coated culture inserts
- Perform all cell culture procedures under sterile conditions in a biological safety cabinet.
- Prepare a collagen I coating solution by diluting collagen I in 17.5 mM acetic acid to a final concentration of 0.5 mg/mL. For 10 inserts, combine 50 µL of 5 mg/mL collagen I stock with 450 µL of 17.5 mM acetic acid, yielding 500 µL total coating solution (50 µL per insert). Use the solution directly; if necessary, store it overnight at 4 °C. The full recipe is provided in Supplementary Table 1.
CAUTION: Acetic acid is corrosive. Prepare the 17.5 mM working solution from the concentrated stock inside a chemical fume hood and wear gloves, a laboratory coat, and eye protection. - Flip the 24-well culture inserts and place them in sterile glass Petri dishes.
- Add 50 µL of the collagen I coating solution onto each insert and distribute the solution evenly across the membrane surface.
- Incubate the inserts within the sterile glass Petri dish, under sterile conditions in the biological safety cabinet for around 1–2 h until the acetic acid has completely evaporated.
- Wash each coated insert one time with 100 µL sterile 1× phosphate-buffered saline (PBS) per wash to remove residual acetic acid, keeping the inserts inverted within the Petri dish throughout the washing procedure.
NOTE: If the coated inserts are not used immediately or on the same day, store them under sterile conditions at 4 °C with the coated surface covered with sterile PBS. Use the inserts within 24 h.
- Dissociation of organoids into single cells
- Remove the 24-well plate containing the intestinal organoid cultures, prepared according to the organoid culture medium manufacturer's protocol, from the incubator.
- Mechanically disrupt the extracellular matrix domes by repeated pipetting in 500 µL of ice-cold Advanced medium until the domes are fully dissolved and a homogeneous organoid suspension is obtained (medium composition in Supplementary Table 1).
- Transfer the organoid suspension into a sterile 15 mL centrifuge tube.
- Centrifuge the organoid suspension at 300 × g for 5 min at 4 °C.
- Carefully discard the supernatant without disturbing the organoid pellet.
- Resuspend the organoid pellet in 300 µL pre-warmed cell dissociation reagent.
- Incubate the suspension at 37 °C for approximately 10 min to dissociate organoids into single cells.
- Stop the dissociation reaction by adding 700 µL of 1× PBS.
- Resuspend the cells thoroughly using a 1000 µL pipette until a homogeneous single-cell suspension is obtained.
- Centrifuge the cell suspension at 300 × g for 5 min at 4 °C.
- Carefully remove the supernatant and resuspend the cell pellet in an appropriate volume of organoid growth medium.
- Determine cell number and viability by using a hemocytometer with trypan blue, or Luna-FL cell counter, and adjust the concentration to 1 × 10⁶ cells/mL in organoid growth medium (see Supplementary Table 1).
- Generation of inverted organoid-derived epithelial monolayers
NOTE: Retrieve the collagen I-coated inserts prepared in Section 1.1. For a standard 24-well format, 1 × 10⁵ cells are seeded per insert; for example, an experiment using 12 inserts requires 1.2 × 10⁶ cells in a total volume of 1.2 mL of the single-cell suspension prepared in Section 1.2 (at 1 × 10⁶ cells/mL).- Seed 1 × 10⁵ organoid-derived epithelial cells per insert.
- Add 100 µL of the prepared single-cell suspension onto each coated insert membrane, with the insert still inverted in the sterile Petri dish.
- Ensure equal distribution of cells across the membrane surface.
- Incubate the seeded, inverted inserts in organoid growth medium at 37 °C and 5% CO2 for approximately 5 h or overnight to allow epithelial attachment. Keep the inserts within a humidified chamber or sealed Petri dish throughout this period to prevent the membrane from drying out.
- After the attachment period, carefully return the inserts to their upright orientation and place them into the wells of a 24-well plate.
- Carefully add 600 µL organoid growth medium to the lower compartment along the side of the well, taking care not to disturb the seeded epithelial layer.
- Add 300 µL of the appropriate culture medium into the insert compartment, again along the side of the insert wall.
- Maintain the cultures under standard cell culture conditions (37 °C, 5% CO2, humidified incubator). Monolayers typically reach confluency and are ready to proceed to differentiation (Section 1.4) after approximately 14 days; however, the time required to reach confluency is highly donor-dependent. Once a confluent monolayer has formed, proceed with differentiation and subsequent downstream experiments. Representative examples of unsuccessful monolayer establishment, including persistently low TEER values and discontinuous epithelial coverage, are provided in Supplementary Figure 1.
NOTE: A schematic overview of the inverted seeding procedure is provided in Figure 1. Throughout this protocol, the insert (upper) and well (lower) compartments are used as the primary points of reference. In the inverted configuration, epithelial cells are cultured on the outer surface of the insert membrane facing the well compartment. Following differentiation and polarization, the apical epithelial surface therefore faces the well (lower) compartment, whereas the basolateral surface faces the insert membrane, toward the insert (upper) compartment.
- Epithelial monolayer differentiation prior to co-culture
- Beginning on the day the epithelial monolayer reaches confluency, replace the organoid growth medium in the well (lower) compartment with epithelial differentiation medium (composition provided in Supplementary Table 1). Maintain Advanced Medium in the insert (upper) compartment throughout differentiation.
- Refresh the differentiation medium every day for a total of a maximum of 5 days.
- Assess monolayer maturity using the criteria described in Section 1.5 (TEER) and Section 1.8 (morphology/immunofluorescence). A monolayer is considered mature and suitable for co-culture when TEER values are stable across two consecutive measurements, and a complete monolayer is formed, as monitored with a light microscope (Figure 2B).
- Measurement of transepithelial electrical resistance (TEER)
- Equilibrate the TEER measurement device (electrodes/chopstick apparatus) in pre-warmed PBS at 37 °C for around 15 min before analysis.
- Prepare cell-free coated inserts as blank controls.
- Place the long electrode tip into the well (lower) compartment and the short electrode tip into the insert (upper) compartment, without touching the membrane or the epithelial layer on its outer surface.
NOTE: Electrode positioning for TEER measurement in the inverted culture insert configuration is illustrated in Figure 2A. - Measure the electrical resistance of each insert.
- Record resistance values in Ohms (Ω).
- Measure three technical replicates per insert.
NOTE: TEER readings can vary between consecutive measurements due to electrode positioning, temperature fluctuations, and minor movement of the culture medium; averaging technical replicates minimizes this variability. - Subtract the resistance value of the blank insert from each sample measurement.
- Calculate TEER using the following equation: TEER (Ω × cm2) = (Rsample − Rblank) × membrane surface area, where the membrane surface area is 0.33 cm2 for the 24-well insert format used in this protocol.
- Express final values as Ω × cm2.
- Repeat measurements at defined experimental time points, measure every 48 h from seeding until differentiation is complete, and immediately before co-culture, to monitor epithelial barrier formation. Representative TEER values obtained during monolayer maturation are shown in Figure 2B.
- Fluorescein isothiocyanate (FITC)-dextran permeability assay
NOTE: This assay is typically performed on mature monolayers (Section 1.5) as an independent, complementary measure of barrier integrity, either immediately before immune cell co-culture or on a parallel set of monolayers, since it requires a full medium change.- Prepare epithelial cultures that have reached the TEER-defined maturity criteria described in Section 1.5 for permeability analysis.
- Prepare a 4 kDa FITC-dextran (FD4) solution at 1 mg/mL by dissolving FITC-dextran in 1× PBS protected from light.
- Remove medium from the insert and the well.
- Add 200 µL of the fluorescent dextran solution to the insert (upper) compartment.
- Add 1 mL of 1× PBS to the well (lower) compartment; this compartment serves as the receiving compartment for this assay.
- Incubate cultures under standard cell culture conditions (37 °C, 5% CO2) for a total assay duration of 180 min, but this can be increased depending on the experimental question.
- Collect 50 µL samples from the well (lower/receiving) compartment every 30 min for 6 time points, replacing the removed volume with an equal volume of fresh medium after each collection.
- Transfer collected samples into a black 96-well plate suitable for fluorescence measurements. Keep the plate protected from light and measure the samples directly after collecting all samples for each time point.
- Prepare a serial dilution series of fluorescent dextran standards in the same medium used in step 1.6.5: 1 mg/mL, 0.1 mg/mL, 0.01 mg/mL, 0.001 mg/mL, 0.0001 mg/mL.
- Include medium-only blank controls (no FITC-dextran) during analysis.
- Measure fluorescence intensity using a fluorescence plate reader at excitation and emission wavelengths of 490 nm and 520 nm, respectively.
- Calculate the FITC-dextran concentration in the receiving well compartment from the measured fluorescence values using the corresponding standard curve. Alternatively, calculate the apparent permeability coefficient (Papp) using the following equation: Papp = ΔQ / (A × C0 × Δt), where ΔQ is the amount of FITC-dextran transported into the receiving compartment as determined from the standard curve, A is the membrane surface area (0.33 cm2), C0 is the initial FITC-dextran concentration in the donor compartment (1 mg/mL), and Δt is the incubation time. Insert the experimentally determined values into the equation to calculate Papp.
NOTE: Example calculation - If the FITC-dextran concentration determined from the standard curve is 0.05 mg/mL in a receiving volume of 0.60 mL, ΔQ is calculated as:
ΔQ = 0.05 mg/mL × 0.60 mL = 0.030 mg
For a membrane surface area of 0.33 cm2, an initial donor concentration of 1 mg/mL, and an incubation time of 60 min (3,600 s):

If only relative barrier permeability is required, the FITC-dextran concentration in the receiving compartment obtained from the standard curve can be reported directly instead of calculating Papp.
- Annexin V and propidium iodide (PI) viability staining of epithelial monolayers
NOTE: This assay is used both as a quality-control step following differentiation (Section 1.4) and to assess epithelial viability after stimulation or immune cell co-culture (Section 4).- Carefully remove the culture medium from the insert and the well.
- Wash the epithelial monolayer gently with PBS.
- Add pre-warmed enzymatic dissociation reagent to the lower compartment only, ensuring that the membrane is completely covered (see Supplementary Table 1).
- Incubate the inserts at 37 °C for 10 min to detach the epithelial monolayer.
- Carefully scrape the membrane surface to completely detach remaining epithelial cells.
- Collect the detached cell suspension and transfer it into flow cytometry tubes.
- Wash the membrane with PBS to collect remaining cells and combine with the original cell suspension.
- Centrifuge the samples at 300 × g for 6 min and remove the supernatant.
- Resuspend the cell pellet in 70 µL Annexin binding buffer (composition provided in Supplementary Table 1).
- Add 2 µL Annexin V staining reagent.
- Incubate samples for 20 min, protected from light.
- Add 230 µL Annexin binding buffer and 0.5 µL propidium iodide solution.
- Continue incubation for 30 min protected from light.
- Analyze samples immediately by flow cytometry, including an unstained control (Gating strategy is provided in Supplementary Figure 2).
- Determine viable (Annexin V−/PI−), Annexin V+/PI−, Annexin V+/PI+ (double-positive), and Annexin V−/PI+ epithelial cell populations.
- Immunofluorescence staining of organoid-derived epithelial monolayers
NOTE: Immunofluorescence staining is typically performed at the experimental endpoint, after completion of differentiation (Section 1.4), or a defined time after immune cell co-culture (Section 4), to confirm epithelial identity, polarity, and structural integrity.- Collect cultures at the required experimental endpoint (see Note above).
- Carefully remove the culture medium from both the insert and the well.
- Add 600 µL PBS to both the well and the insert to wash the epithelial monolayer, then remove the PBS completely.
- Fix cells directly on the membrane using 500 µL 4% paraformaldehyde.
CAUTION: Paraformaldehyde is toxic upon inhalation, ingestion, and skin contact and is a suspected carcinogen. Prepare and use the fixative inside a chemical fume hood, wear gloves and eye protection, and dispose of waste according to institutional guidelines. - Remove the fixation solution.
- Wash the fixed membrane thoroughly with PBS.
- Permeabilize cells on the membrane using 500 µL PBS containing 0.1% detergent.
- Block unspecific antibody binding by incubating the membrane with 500 µL blocking buffer for 2 h at room temperature with gentle agitation.
- Carefully cut out the membrane from the insert using a scalpel or fine scissors.
- Place the removed membrane onto a microscopy slide with the cell layer facing upward.
- Outline the membrane area using a hydrophobic barrier pen to retain antibody solutions during staining.
- Prepare primary antibody solutions in blocking buffer. Representative panels used in this protocol: anti-E-cadherin, anti-MUC2, and, where applicable, anti-MPO for NET visualization. A complete antibody list is provided in Supplementary Table 2.
- Add 70–100 µL of primary antibody solution directly onto the outlined membrane area.
- Incubate samples overnight at 4 °C in a humidified chamber.
- Remove the primary antibody solution.
- Wash the membrane carefully with PBS.
- Add the corresponding fluorescent secondary antibody solution onto the membrane.
- Incubate the secondary antibody for 1 h, protected from light.
- Wash samples thoroughly with PBS.
- Counterstain nuclei for 10 min using a nuclear staining reagent (e.g., DAPI).
- Add mounting medium and place a coverslip carefully onto the sample.
- Analyze epithelial structure and marker expression using fluorescence microscopy.
2. Isolation of peripheral blood immune cells
NOTE: The procedures below (Sections 2.1–2.3) follow established density-gradient and magnetic-bead separation methods. Readers are referred to Miltenyi et al.8 for additional methodological background and troubleshooting. This manuscript describes only the parameters and modifications relevant to this co-culture model.
- Isolation of peripheral blood mononuclear cells (PBMCs)
- Perform all procedures involving human blood samples under sterile conditions in a biological safety cabinet.
NOTE: Use human blood only after approval by the responsible institutional ethics committee and after written informed consent has been obtained (see the ethics statement above).
CAUTION: Human blood and blood-derived material are potentially infectious. Handle all samples in a biological safety cabinet, wear gloves and a laboratory coat, and dispose of waste according to institutional biosafety guidelines. - Collect peripheral blood samples in anticoagulant-containing ethylenediaminetetraacetic acid (EDTA) collection tubes.
- Transfer blood samples into sterile 50 mL centrifuge tubes.
- Add 15 mL of density gradient medium to a new 50 mL centrifuge tube.
- Dilute blood samples with sterile PBS up to 35 mL.
- Carefully layer the diluted blood suspension onto the 15 mL density gradient medium without disturbing the interface.
- Centrifuge samples at 460 × g for 30 min at 20 °C without brake.
- Remove the upper plasma layer carefully after centrifugation.
- Collect the PBMC layer located at the interface between the plasma and the density gradient medium and transfer it directly into a new 50 mL sterile centrifuge tube.
- Fill up to 50 mL with 1× PBS to remove remaining plasma and density gradient medium.
- Centrifuge cells at 300 × g for 6 min and remove the supernatant.
- Determine cell number and viability (see Section 1.2.12 for the method used throughout this protocol).
- Resuspend the cell pellet in magnetic separation buffer (Section 2.2), used when proceeding directly to CD14+ monocyte isolation.
- Perform all procedures involving human blood samples under sterile conditions in a biological safety cabinet.
- Magnetic isolation of CD14-positive monocytes
- Resuspend isolated PBMCs in magnetic separation buffer (composition provided in Supplementary Table 1) containing protein supplement and EDTA (80 µL per 107 cells).
- Add magnetic beads specific for CD14-positive cells (20 µL per 107 cells).
- Incubate the cell suspension for 15 min at 4 °C.
- Wash cells by adding 15 mL separation buffer.
- Centrifuge cells at 300 × g for 6 min.
- Remove the supernatant completely.
- Place the separation column into the magnetic field.
- Equilibrate the column with 3 mL separation buffer once.
- Resuspend the cells in 1 mL separation buffer.
- Apply the cell suspension onto the column.
- Collect the flow-through fraction.
- Wash the column three times with 3 mL separation buffer.
- Remove the column from the magnetic field.
- Elute the retained CD14-positive monocytes using 5 mL separation buffer.
- Count isolated monocytes and adjust the cell concentration to 1 × 10⁵ monocyte-derived cells per insert for use in co-culture (Section 4).
- Isolation of neutrophils
- Collect the granulocyte-containing fraction obtained after density gradient separation as described above (the white layer directly above the erythrocytes).
- Transfer the granulocyte fraction into a sterile 50 mL tube (around 8 mL).
- Remove remaining erythrocytes through hypotonic lysis by adding 36 mL ice-cold sterile water and inverting the tube for 20 s.
- Restore isotonic conditions immediately after by adding 4 mL 10× PBS.
- Centrifuge the cell suspension at 300 × g for 6 min.
- Remove the supernatant and resuspend cells in 1 mL 1× PBS.
- Repeat the erythrocyte lysis step by adding 36 mL ice-cold sterile water and inverting the tube for 20 s. Stop lysis by the addition of 4 mL 10× PBS.
- Remove supernatant and resuspend isolated neutrophils in appropriate volumes of 1× PBS.
- Determine neutrophil concentration and viability.
NOTE: Use freshly isolated neutrophils directly for co-culture experiments (within 1 h, stored at 37 °C, 5% CO2), as their short ex vivo lifespan and sensitivity to activation limit storage or delayed use.
3. Fluorescent labeling of immune cells
- Prepare freshly isolated immune cells at a concentration of 2 × 10⁵ cells/insert in 1× PBS.
NOTE: Calculate immune cell concentration prior to labeling, e.g., for 10 inserts, prepare 2 × 10⁶ cells. - Centrifuge the cell suspension at 300 × g for 6 min and remove the supernatant.
- Resuspend cells in fluorescent cell-tracking dye diluted in sterile PBS at a final concentration of 1 µM.
- Incubate cells at 37 °C protected from light according to dye-specific conditions.
- Stop the staining reaction by adding twice the sample volume of culture medium containing 10% fetal calf serum (FCS).
- Incubate for a further 5 min at room temperature.
- Centrifuge the cell suspension at 300 × g for 6 min.
- Remove the supernatant carefully.
- Resuspend labeled immune cells in appropriate culture medium (see Supplementary Table 1).
NOTE: Label different immune cell populations with spectrally separated fluorescent dyes to allow discrimination during flow cytometry analysis (monocytes: carboxyfluorescein succinimidyl ester (CFSE); neutrophils: far-red cell-tracking dye).
4. Establishment of immune cell co-culture on inverted epithelial models
- Use organoid-derived epithelial monolayers differentiated as described in Section 1.4.
- Where indicated, stimulate epithelial cultures with lipopolysaccharide (LPS) before adding immune cells: apply 200 µg/mL of LPS from Klebsiella pneumoniae to the lower well compartment for 24 h prior to immune cell co-culture. This step models an inflammatory epithelial state and evaluates how epithelial activation influences subsequent immune cell migration and neutrophil extracellular trap (NET) formation (Sections 5–6).
- Prepare freshly isolated and labeled immune cell populations (Sections 2–3).
- Adjust immune cell concentrations according to the required experimental conditions.
- Add 1 × 10⁵ monocyte-derived cells per insert.
- Add 2 × 10⁵ neutrophils per insert. This experimental design corresponds to the co-culture setup illustrated in Figure 3A.
- Ensure equal distribution of immune cells across the insert compartment.
- Incubate the immune–epithelial co-culture for 24 h at 37 °C and 5% CO2.
- Include appropriate controls containing epithelial cells only, stimulation only, and immune cells only. Unless otherwise stated, no additional exogenous cytokines were added to the co-culture medium (composition in Supplementary Table 1).
5. Surface marker staining for immune cell migration
- Carefully collect the complete medium from the well (lower) compartment after the 24 h migration period described in Section 4.8.
- Transfer collected cell suspensions into flow cytometry tubes.
- Centrifuge the samples and remove the supernatant.
- Resuspend the cells in 90 µL flow cytometry staining buffer (1× PBS + 2 mM EDTA + 10% FCS).
- Add 10 µL of an antibody master mix containing fluorophore-conjugated antibodies against the selected surface markers to each sample. A complete antibody panel (fluorophores, dilutions, and catalog numbers) is provided in Supplementary Table 2.
- For neutrophil identification, stain cells using antibodies targeting neutrophil-associated markers, e.g., 2 µL anti-CD66b antibody.
- Incubate the samples for 45 min protected from light.
- Wash cells by adding 2 mL flow cytometry staining buffer into each tube.
- Centrifuge samples at 300 × g for 6 min and remove excess staining solution.
- Resuspend stained cells in 300 µL flow cytometry staining buffer.
- Keep samples protected from light until acquisition.
- Flow cytometry controls, acquisition, and gating
NOTE: The following applies to all flow cytometry analyses described in this protocol (Sections 1.7, 5, 6). Panels used in this protocol contain a maximum of two fluorophores per sample, selected to be spectrally well separated; unstained controls were used to set scatter and voltage parameters rather than a full compensation/FMO panel.- Prepare an unstained control sample from each cell population (or a representative aliquot) analyzed in the experiment.
- Use the unstained sample to set forward scatter (FSC) and side scatter (SSC) voltages so that the main cell population of interest is clearly visualized and debris is excluded.
- Using the same unstained sample, set the laser/photomultiplier tube (PMT) voltage for each fluorescence channel used in the panel so that the negative (unstained) population is positioned appropriately on the scale.
- Acquire stained samples using the voltage settings established in steps 5.12.2–5.12.3, on an Attune CytPix, Thermo Fisher Scientific, using FlowJo 10 for analysis.
- Gate sequentially: first on FSC/SSC to exclude debris and select the population of interest, then identify marker-positive populations (e.g., CD66b+ for neutrophils; see Supplementary Table 2 for the full marker list) relative to the unstained control.
6. Detection of neutrophil extracellular traps (NETs) by flow cytometry
NOTE: This assay provides an optional, complementary quantitative readout of NET formation and is described only briefly here, as it is not central to the establishment of the inverted epithelial co-culture model itself.
- NET formation was assessed by flow cytometry based on combined myeloperoxidase (MPO) and extracellular DNA (SYTOX Orange) positivity. Briefly, collect the supernatant from the well (lower) compartment (as in Section 5.1) and stain with an anti-MPO antibody (2 µL) and an extracellular DNA dye (0.5 µL, added immediately before measurement) using the 100 µL staining buffer and washing steps described in Section 5, including the flow cytometry controls listed above.
- Analyze samples by flow cytometry and quantify NETs-associated populations based on combined extracellular DNA and neutrophil marker positivity.
NOTE: Full step-by-step incubation times and volumes for this assay are provided in Supplementary Table 1.
7. Quantification of neutrophil elastase (NE)–DNA and MPO–DNA complexes by enzyme-linked immunosorbent assay (ELISA)
NOTE: This assay provides an optional, complementary quantitative readout of NET-associated protein-DNA complexes in culture supernatants and is summarized briefly here, as it follows a standard ELISA workflow that is not specific to the inverted epithelial model.
- Quantify NE-DNA and MPO-DNA complexes using a capture/detection antibody-based ELISA. Perform coating (NE- or MPO-specific capture antibody, 0.5 µg/mL), blocking, sample incubation (40 µL sample per well, 2 h), detection antibody incubation (peroxidase-conjugated anti-DNA antibody, diluted 1:40 in incubation buffer or 1:100 in lysis buffer for the high-sensitivity variant), TMB substrate development, and absorbance measurement (450 nm, reference 570 nm) using separate plates for NE-DNA and MPO-DNA measurements. Full reagent concentrations, volumes, and incubation times are provided in Supplementary Table 1.
- Normalize absorbance values to the appropriate blanks and compare NETs-associated complex formation between experimental groups.
NOTE: Prepare separate plates for neutrophil elastase–DNA and myeloperoxidase–DNA measurements. Full step-by-step incubation times and volumes for this assay are provided in Supplementary Table 1.
النتائج
The results below focus on establishing and validating the core inverted epithelial monolayer model and its use for immune cell co-culture; outputs from the complementary NET-associated assays (Sections 6–7) are summarized briefly.
Establishment and validation of the epithelial monolayer derived from inverted organoids
Following inverted seeding, organoid-derived epithelial cells adhered to the collagen I-coated outer membrane surface, expanded, and formed a confluent monolayer during culture and differentiation. We defined successful cultures morphologically as a continuous epithelial layer without visible gaps or large cell aggregates; incomplete attachment or discontinuous epithelial coverage indicated unsuccessful monolayer establishment. Figure 1 includes representative organoid and established monolayer images, while Figure 2A illustrates the TEER measurement setup used to monitor barrier development.
Barrier development was assessed by measuring transepithelial electrical resistance (TEER) (Figure 2B). TEER values increased progressively during differentiation, reflecting the development of epithelial barrier integrity and maturation. In representative cultures, TEER increased from approximately 7 Ω × cm2 at the beginning of monolayer formation to approximately 600 Ω × cm2 in mature monolayers. The resistance of blank inserts without cells was approximately 155 Ω and was subtracted from the measured resistance before correction for the membrane surface area. Mature TEER values were within the range previously reported for human intestinal organoid-derived monolayers, which vary considerably depending on intestinal region, donor, and culture conditions9. For subsequent experiments, only monolayers with stable TEER values, indicating an intact epithelial barrier, were used. Persistently low or highly fluctuating TEER readings indicated incomplete barrier formation and led to exclusion of the culture. Representative TEER values from monolayers that failed to establish a barrier are shown for comparison in Supplementary Figure 1A.
Immunofluorescence staining confirmed the maintenance of epithelial identity within the monolayer. E-cadherin expression revealed continuous epithelial cell-cell junctions, while MUC2-positive goblet cells confirmed epithelial differentiation comparable to that observed in intestinal organoids (Figure 2C). A three-dimensional confocal reconstruction also confirmed the formation of a continuous, polarized epithelial monolayer on the outer surface of the membrane (Figure 2D).
To assess cell viability after differentiation, Annexin V/propidium iodide staining was performed (Figure 2E). The majority of epithelial cells were Annexin V-negative/PI-negative (viable), whereas only small proportions of cells were Annexin V-positive/PI-negative, double-positive, or PI-only-positive. Exposure to 200 µg/mL LPS did not substantially shift these proportions under this single stimulation condition tested. The effects of additional or combined inflammatory stimuli remain to be investigated.
Functional assessment of epithelial barrier integrity and immune cell migration
The inverted culture insert configuration provides direct access to both epithelial compartments and enables analysis of immune cell migration across the epithelial barrier (Figure 3A). To demonstrate the broader applicability of the protocol, organoids derived from tissue of patients with necrotizing enterocolitis (NEC), a severe inflammatory intestinal disease of preterm infants, were included alongside healthy control-derived cultures. Neutrophils added to the upper compartment migrated through the porous membrane toward the organoid-derived monolayer, enabling quantitative comparison between control and NEC-derived cultures (Figure 3B). The differential migration observed between control- and NEC-derived monolayers illustrates the model's suitability for investigating disease-associated epithelial–immune interactions.
To further evaluate multicellular interactions, neutrophil and monocyte migration were quantified in co-culture experiments with both control and NEC monolayers (Figure 3C). The system allows simultaneous investigation of multiple immune cell populations within the same experimental setup while maintaining epithelial barrier integrity.
Barrier function was also assessed using a permeability assay with 4 kDa FITC-dextran (FD4) (Figure 3D). Successful monolayers restricted FITC-dextran diffusion across the epithelial layer, whereas increased permeability indicated impaired barrier integrity. Together with TEER measurements, FITC-dextran analysis provides complementary functional validation of epithelial barrier formation before downstream applications.
Additional downstream readouts: NET formation and post-co-culture epithelial viability
Beyond barrier assessment and immune cell migration, the model also supports additional quantitative and imaging-based readouts following immune cell co-culture. As complementary outputs, NET-associated MPO-DNA and NE-DNA complexes were quantified by ELISA in culture supernatants (Figure 4A), and combined MPO and SYTOX Orange staining allowed flow-cytometric quantification of MPO+SYTOX Orange+ events (Figure 4B). Representative neutrophils and MPO-positive structures associated with the epithelial monolayer were visualized by immunofluorescence using CD66b, MPO, and DAPI staining (Figure 4C). Full experimental detail for these Flow and ELISA is provided in Sections 6–7 and the Supplementary Table 1 and Supplementary Table 2.
The model additionally permits recovery and flow-cytometric assessment of epithelial cells directly from the insert membrane following immune cell co-culture (Section 1.7), and can therefore be used to quantify epithelial viability as an additional downstream readout. Annexin V/PI staining enabled comparison of viable, early apoptotic, late apoptotic, and necrotic epithelial cell populations in control- and NEC-derived monolayers under baseline, LPS, neutrophil, and combined neutrophil/LPS conditions (Figure 4D,E).
Together, these results demonstrate that the inverted organoid-derived model supports barrier assessment and immune cell migration as its central validated outputs, with NET quantification and post-co-culture epithelial viability analysis available as additional, optional readouts within the same experimental platform.
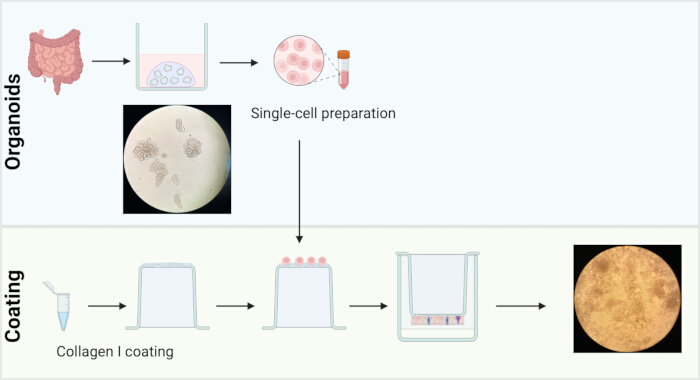
Figure 1: Schematic overview of the establishment of the inverted organoid-derived intestinal epithelial model. Human intestinal organoids are established from intestinal tissue and maintained in extracellular matrix domes. Prior to seeding, culture inserts are inverted, and the outer membrane surface is coated with collagen I to facilitate epithelial cell attachment. Organoids are enzymatically dissociated into a single-cell suspension and seeded onto the collagen-coated outer surface of the inverted insert membrane. After cell attachment, inserts are returned to their standard orientation and cultured under differentiation conditions until a confluent epithelial monolayer is established. Representative brightfield images show intact intestinal organoids before dissociation and the resulting differentiated epithelial monolayer after culture on the inverted insert membrane. Please click here to view a larger version of this figure.
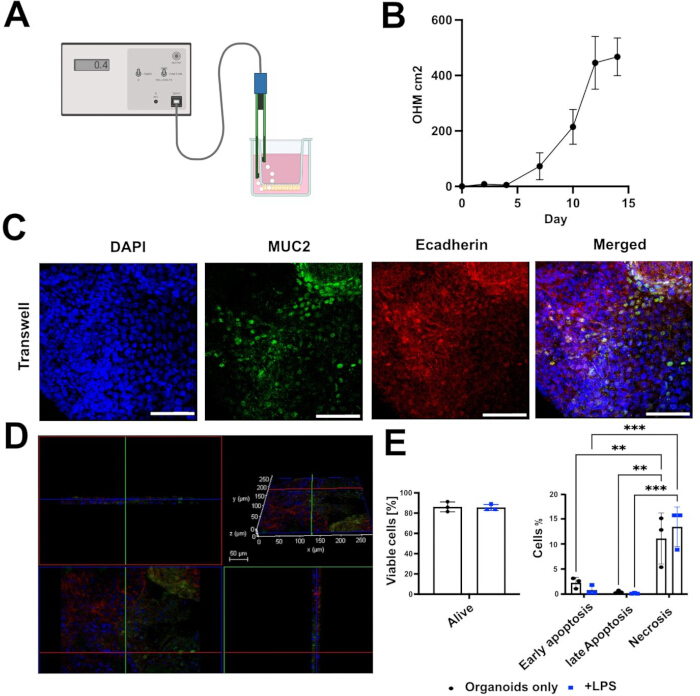
Figure 2: Establishment and validation of the inverted organoid-derived intestinal epithelial monolayer. (A) Schematic representation of the transepithelial electrical resistance (TEER) measurement setup, showing the epithelial voltohmmeter and STX2 electrode positioned in the insert (upper) and well (lower) compartments, as described in Section 1.5. (B) Representative transepithelial electrical resistance (TEER) measurements during epithelial differentiation demonstrating progressive barrier formation. Only monolayers with stable TEER values were used for subsequent experiments. (C) Representative immunofluorescence images of differentiated epithelial monolayers stained for E-cadherin (red) and MUC2 (green). Nuclei were counterstained with DAPI (blue). Scale bar = 50 µm. (D) Three-dimensional confocal reconstruction of the inverted epithelial monolayer demonstrating formation of a continuous polarized epithelial layer; E-cadherin (red), MUC2 (green), and DAPI (blue). Scale bar = 50 µm. (E) Quantification of epithelial cell viability by Annexin V/propidium iodide staining showing percentages of viable (Annexin V−/PI−), Annexin V+/PI−, Annexin V+/PI+, and Annexin V−/PI+ epithelial cells in untreated and LPS-treated monolayers. Data are presented as mean ± SD; statistical significance was determined by ordinary two-way ANOVA with Tukey's post hoc test for multiple comparisons. **p < 0.01, ***p < 0.001. All data were obtained with n (control) = 3. Please click here to view a larger version of this figure.
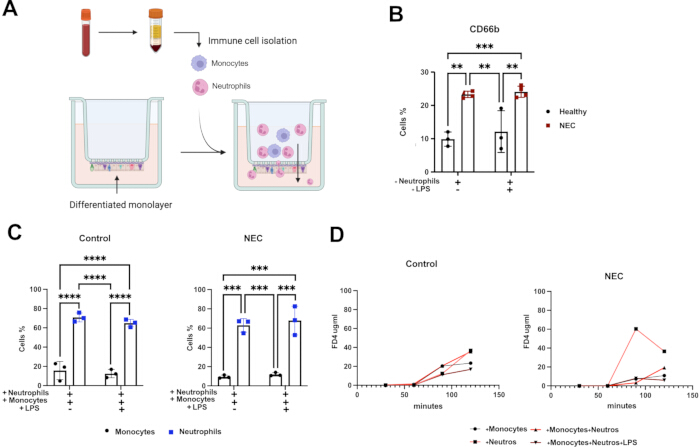
Figure 3: Functional characterization of the inverted epithelial model. (A) Schematic overview of the inverted epithelial model illustrating epithelial monolayer formation and the experimental setup for immune cell migration and barrier analysis. (B) Quantification of neutrophil migration across control- and NEC-derived epithelial monolayers. Migrated neutrophils (CD66b+) were quantified by flow cytometry. (C) Quantification of neutrophil and monocyte migration across control- and NEC-derived epithelial monolayers. Migrated immune cells (membrane-labeled; monocytes: carboxyfluorescein succinimidyl ester (CFSE), neutrophils: far-red cell-tracking dye) were analyzed by flow cytometry. (D) FITC-dextran permeability assay comparing epithelial barrier function of control- and NEC-derived monolayers. Increased FITC-dextran fluorescence indicates higher epithelial permeability. Data are presented as mean ± SD; statistical significance was determined by ordinary two-way ANOVA with Tukey's post hoc test for multiple comparisons. *p < 0.05, **p < 0.01, ***p < 0.001, ****p < 0.0001. All data were obtained with n (control) = 3. Please click here to view a larger version of this figure.
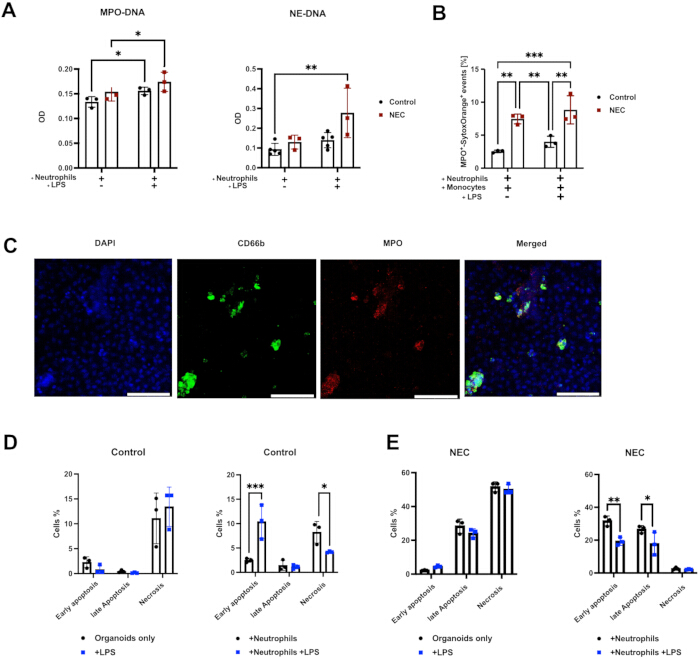
Figure 4: Quantification and visualization of neutrophil extracellular trap formation. (A) Quantification of MPO-DNA and NE-DNA complexes released from neutrophils following interaction with control- and NEC-derived epithelial monolayers using ELISA. (B) Representative flow cytometric quantification of MPO+SYTOX Orange+ events in neutrophils as a measure of NETs formation in control- and NEC-derived epithelial monolayers. (C) Representative immunofluorescence images of neutrophil extracellular traps on epithelial monolayers stained for CD66b (green, neutrophil marker), MPO (red), and nuclei (DAPI, blue). Scale bar = 50 µm. (D,E) Quantification of epithelial cell viability by Annexin V/propidium iodide staining showing percentages of viable (Annexin V−/PI−), Annexin V+/PI−, Annexin V+/PI+, and Annexin V−/PI+ epithelial cells in control and NEC-derived monolayers following neutrophil exposure with or without LPS stimulation. Data are presented as mean ± SD; statistical significance was determined by ordinary two-way ANOVA with Tukey's post hoc test for multiple comparisons. *p < 0.05, **p < 0.01, ***p < 0.001, ****p < 0.0001. All data were obtained with n (control) = 3, n (NEC) = 3. Please click here to view a larger version of this figure.
Supplementary Figure 1: Representative examples of unsuccessful monolayer establishment. (A) Representative TEER measurements from a monolayer that failed to establish a barrier, showing persistently low TEER values throughout the culture period, in contrast to the progressive increase observed in successful monolayers (Figure 2B). (B) Representative brightfield image of a membrane exhibiting discontinuous, incomplete epithelial coverage, in contrast to the confluent monolayer shown in Figure 1. The irregular boundary between covered and uncovered membrane areas and the residual bare membrane surface are indicative of failed monolayer establishment. Please click here to download this file.
Supplementary Figure 2: Representative gating strategy for Annexin V/PI analysis of organoid-derived epithelial cells recovered from the inverted monolayer. Sequential gating was performed to exclude debris and select the epithelial cell population prior to classification according to Annexin V and PI staining. Unstained controls were used to establish scatter and fluorescence settings. Please click here to download this file.
Supplementary Table 1: Media and buffer compositions. Please click here to download this file.
Supplementary Table 2: Antibodies and staining reagents. Please click here to download this file.
المناقشة
The inverted organoid-derived model provides a reproducible platform for generating a polarized intestinal epithelial monolayer while maintaining direct experimental access to both the apical and basolateral epithelial compartments. Compared with conventional three-dimensional organoid cultures, this configuration facilitates functional studies of epithelial barrier integrity, immune cell migration, and host-pathogen or host-immune interactions without requiring technically demanding procedures such as microinjection1,10,11,12. The model preserves essential epithelial characteristics while expanding the range of functional analyses that can be performed within a single experimental system.
Several steps are critical for the successful establishment of the model. Efficient dissociation of organoids into predominantly single cells is essential to ensure homogeneous cell attachment and formation of a continuous epithelial monolayer. Residual cell clusters frequently result in uneven epithelial coverage and delayed barrier maturation. Maintaining the inverted culture inserts in a stable, humidified environment during the initial attachment period (Section 1.3) is equally important to prevent drying of the membrane. Careful handling during inversion and reorientation minimizes mechanical disruption of the developing epithelial layer. Barrier maturation should be routinely monitored by TEER measurements, using the electrode configuration shown in Figure 2A, and only monolayers exhibiting stable TEER values should be used for downstream applications13. Immunofluorescence staining for epithelial markers such as E-cadherin and MUC2 provides additional confirmation of epithelial differentiation and monolayer integrity.
Several modifications and troubleshooting strategies may further improve reproducibility. If cell attachment is insufficient, optimization of extracellular matrix coating, seeding density, or organoid dissociation conditions should be considered. Persistently low TEER values often indicate incomplete epithelial coverage, excessive mechanical stress during medium exchange, or suboptimal differentiation conditions. High variability between biological replicates may reflect differences in organoid quality or donor-specific characteristics. For immune cell co-culture experiments, freshly isolated neutrophils with high viability should be used. Minimizing unnecessary manipulation of the inserts after immune cell addition further helps preserve epithelial integrity throughout the experiment.
The versatility of this model is reflected not primarily by the number of analytical readouts it supports; many existing organoid-immune co-culture and tri-culture systems similarly permit immunostaining, ELISA, flow cytometry, and gene expression profiling, but by the range of biological questions and experimental manipulations it enables. These include compartment-specific stimulation of either the apical or basolateral epithelial surface, simultaneous co-culture with multiple immune cell types, and direct comparison of healthy and disease-derived tissue within a single, epithelium-accessible platform.
Despite its advantages, the method has several limitations. As with other organoid-derived monolayer systems, the model lacks important components of the intestinal microenvironment, including vascularization, stromal cells, enteric neurons, and the complex three-dimensional architecture of native intestinal tissue4,6. Consequently, epithelial barrier properties and immune responses cannot fully recapitulate the in vivo situation. Furthermore, epithelial differentiation and barrier formation depend on organoid quality and donor variability. The relatively short lifespan of primary neutrophils also limits the duration of co-culture experiments and long-term analyses; extending the model to longer-term co-cultures, for example, using monocyte-derived macrophages or other more persistent immune populations, and to additional immune cell types such as T cells, represents a promising direction for future work.
Several organoid-derived epithelial monolayer systems have previously been established using permeable membrane-based culture approaches and have become valuable tools for investigating epithelial transport, barrier function, microbial interactions, and inflammatory responses3,5. In conventional insert-based models, however, the epithelial surface is typically positioned within the insert, which can restrict direct visualization and complicate experimental manipulation during immune cell co-culture. By culturing epithelial cells on the outer surface of the membrane, the inverted configuration presented here improves accessibility while preserving epithelial polarity and barrier formation. This design facilitates immune cell addition, migration assays, permeability measurements, confocal microscopy, and epithelial viability analyses within a single experimental setup, providing a flexible platform for investigating epithelial-immune interactions. Related co-culture strategies have also been developed for other epithelial tissues; for example, immune-epithelial co-culture models of the respiratory tract have been used to study barrier function and immune-modulatory responses in the lung14, underscoring the broader applicability of accessible, insert-based epithelial-immune co-culture designs across tissue types while highlighting tissue-specific adaptations such as the one presented here for the intestine.
Although demonstrated here using healthy control- and NEC-derived intestinal organoids, the protocol is not limited to necrotizing enterocolitis. The method can be readily applied to organoids generated from healthy tissue as well as from patients with a wide range of intestinal diseases, enabling direct comparison of disease-specific epithelial phenotypes under standardized experimental conditions. Potential applications include inflammatory bowel disease, infectious enterocolitis, colorectal cancer, inherited epithelial disorders, and investigations of host-microbe interactions. In combination with patient-derived organoids, the model also offers opportunities for personalized disease modeling, therapeutic screening, and evaluation of immune-targeted interventions. Its physiological relevance, experimental accessibility, and compatibility with diverse functional readouts establish the inverted organoid-derived system as a versatile platform for intestinal epithelial research.
الإفصاحات
The authors have no conflicts of interest to disclose. Generative AI tools were used solely for language correction.
شكر وتقدير
The authors gratefully acknowledge the Light Microscopy Facility (LIMA) at Heidelberg University for providing access to the Leica SP8 confocal microscope.
المواد
| الاسم | الشركة | رقم فهرسي | التعليقات |
|---|---|---|---|
| 10 mL serological pipettes | Sarstedt | 86.1254.001 | |
| 1× PBS | Gibco | 14190-169 | |
| 10× PBS | Gibco | 70013016 | |
| 15 mL conical centrifuge tubes | Greiner Bio-One | 188271-N | |
| 25 mL serological pipettes | Sarstedt | 86.1685.001 | |
| 40 µm cell strainer | Corning Falcon | 352340 | |
| 5 mL serological pipettes | Sarstedt | 86.1253.001 | |
| 50 mL conical centrifuge tubes | Greiner Bio-One | 227261 | |
| Acetic acid (AcOH) 100% | Merck | 1,00,06,32,511 | |
| Acridine Orange/PI staining solution | Logos Biosystems | F23001 | |
| Advanced DMEM/F12 | Gibco | 12634028 | |
| Annexin binding buffer | — | ||
| Annexin V-FITC | ImmunoTools | 31490013X2 | |
| Anti-CD206 | Proteintech | 60143-1-Ig | |
| Anti-CD66b | Thermo Fisher Scientific | MA5-48421 | |
| Anti-CD68 | Cell Signaling Technology | #26042 | |
| Anti-CD80 | Proteintech | 66406-1-Ig | |
| Anti-DNA POD antibody | Roche/Sigma-Aldrich | ||
| Anti-dsDNA | Abcam | ab27156 | |
| Anti-Histone H3 citrullinated (H3Cit) | Abcam | ab219406 | |
| Anti-mouse fluorescent secondary antibody | Invitrogen/Thermo Fisher Scientific | A32723 | |
| Anti-MPO | Abcam | ab9535 | |
| Anti-myeloperoxidase antibody | Merck | 07-496-I | |
| Anti-neutrophil elastase (NE) | Abcam | ab254178 | |
| Anti-neutrophil elastase antibody | R&D Systems | MAB91673-100 | |
| Anti-rabbit fluorescent secondary antibody | Invitrogen/Thermo Fisher Scientific | A32795 | |
| Black 96-well plate | Greiner Bio-One | 655090 | |
| Black 96-well plates | Greiner Bio-One | ||
| Bovine serum albumin (BSA) | Carl Roth | 810531 | |
| CaCl2 | Honeywell Fluka | C1016-500G | |
| CD14 Brilliant Violet 605 | BioLegend | 301834 | |
| CD14 MicroBeads | Miltenyi Biotec | 130-050-201 | |
| CD16 Pacific Blue | BD | 558122 | |
| CD163 PE/Cyanine7 | BioLegend | 333614 | |
| CD66b antibody | Thermo Fisher Scientific | MA5-48421 | |
| CD68-PE | Thermo Fisher Scientific | 12-0689-42 | |
| CD86 NovaRed | Thermo Fisher Scientific | H021T03R06-A | |
| Cell Death Detection Kit | Sigma-Aldrich/Roche | 11544675001 | |
| CellTrace Far Red | Thermo Fisher Scientific | C34564 | |
| CellTrace CFSE | Thermo Fisher Scientific | C34554 | |
| Coverslips | Logos Biosystems | L12014 | |
| DAPI | Sigma-Aldrich | D9542-1MG | |
| ddH2O | — | ||
| E-cadherin | Bio-Techne | NBP2-19051 | |
| EDTA | Thermo Fisher Scientific | 15575020 | |
| EDTA blood collection tubes | Sarstedt | 2066057 | |
| EVOM² voltohmmeter | World Precision Instruments | ||
| FACS tubes (5 mL round bottom) | Falcon | 352054 | |
| Fc-block | BioLegend | 422302 | |
| FCS | Thermo Fisher Scientific | A5256701 | |
| Fine forceps | Fine Science Tools | 11251-35 | |
| Fine scissors | Fine Science Tools | 14060-09 | |
| FITC-Dextran 4 kDa (FD4) | Sigma-Aldrich | FD4-100MG | |
| Flow cytometer Attune Cytpix | Thermo Fisher Scientific | ||
| FlowJo 10.10.1 | FlowJo | ||
| Glass Petri dish | BRAND | BR455751-10EA | |
| Goat serum | Biowest | S2000-100 | |
| H2SO4 | Merck | 1007161000 | |
| Histopaque-1077 | Sigma-Aldrich | 10771-6X100ML | |
| Human intestinal tissue samples | — | ||
| Human peripheral blood samples | — | ||
| Human serum | — | ||
| Hydrophobic barrier pen | Vector Laboratories | H-4000 | |
| LEGENDplex Human Inflammation Panel (13-plex) | BioLegend | 740809 | |
| Lipopolysaccharide (LPS), Klebsiella pneumoniae | Sigma-Aldrich | L4268-10MG | |
| LS columns | Miltenyi Biotec | 130-042-401 | |
| Luna-FL cell counter | Logos Biosystems | ||
| MACS buffer | — | ||
| Magnetic separator | Miltenyi Biotec | ||
| Matrigel | Corning | 356255 | |
| M-CSF | ImmunoTools | 11343115 | |
| Microplate reader | Tecan | ||
| Microscope slides | Thermo Scientific | J1800AMNZ | |
| Mounting medium | Dako/Agilent | S3023 | |
| MPO-eFluor antibody | Thermo Fisher Scientific | 48-1299-42 | |
| MUC2 | Abcam | ab11197 | |
| Na2CO3 | Roth | A135.2 | |
| NaHCO3 | Merck | 1063461000 | |
| Organoid Differentiation Medium (ODM) | STEMCELL Technologies | 100-0214 | |
| Organoid Growth Medium (OGM) | STEMCELL Technologies | 06010 | |
| Parafilm | Bemis | PM996 | |
| Paraformaldehyde (4%) | Carl Roth | 0964.3 | |
| Plate reader | Tecan | ||
| Propidium iodide (PI) | BioLegend | 60002818 | |
| RPMI medium | Thermo Fisher Scientific | 11835063 | |
| Scalpel blades | Feather | No.11 | |
| Sterile filter pipette tips, 10 µL | Eppendorf | 0030000811 | |
| Sterile filter pipette tips, 100 µL | Biozym | VT0230 | |
| Sterile filter pipette tips, 1000 µL | Eppendorf | 3442645 | |
| STX2 electrodes | World Precision Instruments | ||
| Sytox Orange | Thermo Fisher Scientific | S34861 | |
| TMB substrate | BioLegend | 421101 | |
| Transwell inserts (0.33 cm²) | Merck | PTSP24H48 | |
| Triton X-100 | Sigma-Aldrich | ||
| TrypLE | Thermo Fisher Scientific | 12604013 | |
| Tween-20 | Merck | 8221840500 | |
| Type I Collagen (Collagen Collagen Type I, rat tail ) | ibidi | 50201 |
المراجع
- Sato T, et al. Single Lgr5 stem cells build crypt-villus structures in vitro without a mesenchymal niche. Nature. 2009;459(7244):262-265.
- Co JY, et al. Controlling epithelial polarity: a human enteroid model for host-pathogen interactions. Cell Rep. 2019;26(9):2509-20.e4.
- Fatehullah A, Tan SH, Barker N. Organoids as an in vitro model of human development and disease. Nat Cell Biol. 2016;18(3):246-254.
- Kozuka K, et al. Development and characterization of a human and mouse intestinal epithelial cell monolayer platform. Stem Cell Reports. 2017;9(6):1976-1990.
- Noel G, et al. A primary human macrophage-enteroid co-culture model to investigate mucosal gut physiology and host-pathogen interactions. Sci Rep. 2017;7:45270.
- VanDussen KL, et al. Development of an enhanced human gastrointestinal epithelial culture system to facilitate patient-based assays. Gut. 2015;64(6):911-920.
- Angus HC, et al. An autologous colonic organoid-derived monolayer model to study immune-bacterial interactions in Crohn's disease patients. Clin Transl Immunology. 2022;11(8):e1407.
- Miltenyi S, Müller W, Weichel W, Radbruch A. High gradient magnetic cell separation with MACS. Cytometry. 1990;11(2):231-238.
- Nickerson KP, et al. A versatile human intestinal organoid-derived epithelial monolayer model for the study of enteric pathogens. Microbiol Spectr. 2021;9(1):e0000321.
- Hoffmann P, et al. Intestinal organoid-based 2D monolayers mimic physiological and pathophysiological properties of the pig intestine. PLoS One. 2021;16(8):e0256143.
- Macedo MH, Martínez E, Barrias CC, Sarmento B. Development of an improved 3D in vitro intestinal model to perform permeability studies of paracellular compounds. Front Bioeng Biotechnol. 2020;8:524018.
- Altay G, et al. Self-organized intestinal epithelial monolayers in crypt and villus-like domains show effective barrier function. Sci Rep. 2019;9(1):10140.
- Srinivasan B, et al. TEER measurement techniques for in vitro barrier model systems. J Lab Autom. 2015;20(2):107-116.
- Kusek ME, Pazos MA, Pirzai W, Hurley BP. In vitro co-culture assay to assess pathogen induced neutrophil trans-epithelial migration. J Vis Exp. 2014;(83):50823.