This study investigates syngas production from three bamboo species using experimental gasification and computational modeling. It compares the concentrations of CH₄, CO, CO₂, and H₂ and examines how experimentally evaluated operating conditions affect syngas composition.
مقالة بحثية
Experimental and Computational Analysis of Syngas Composition from Bamboo Biomass Gasification
في هذه المقالة
ملخص
الملخص
This study investigates syngas production from three bamboo species, Bambusa vulgaris (BV), Chimonobambusa calosa (CC), and Dendrocalamus longispathus (DL), using experimental gasification and computational fluid dynamics (CFD) modeling. The objective was to characterize the major syngas components, namely methane (CH₄), carbon monoxide (CO), carbon dioxide (CO₂), and hydrogen (H₂), and to examine their behavior under the investigated gasification conditions. Gasification experiments were conducted using a tapered bubbling fluidized-bed reactor, while transient multiphase CFD simulations were performed to evaluate gas-solid hydrodynamic and thermal behavior and to compare simulated and experimental syngas compositions. For Bambusa vulgaris at the selected condition of 800 °C and 0.2 m/s, the experimentally measured concentrations of H₂, CO, CO₂, and CH₄ were approximately 20.5%, 22.5%, 33.0%, and 2.4%, respectively, compared with simulated values of 22.5%, 25.0%, 36.0%, and 3.0%. The corresponding relative deviations were approximately 9.8%, 11.1%, 9.1%, and 25.0%, respectively. The results indicate reasonable agreement between the experimental and computational values for the major syngas components under the selected operating condition. The observed variations in gas composition are consistent with the influence of temperature and gas-solid interactions on the principal gasification reactions. However, because moisture and residence time were not quantified independently across a systematic experimental matrix, their effects are not interpreted as established parameters. The findings demonstrate the applicability of the combined experimental and computational approach to characterizing bamboo-derived syngas under the conditions investigated.
المقدمة
Pursuing renewable energy sources has become increasingly important due to growing concerns about energy security and the need to diversify energy resources1. Biomass gasification is a thermochemical conversion process with strong potential to convert organic resources into useful gaseous energy products2. Among various biomass feedstocks, bamboo is particularly attractive because of its rapid growth, availability, renewability, and lignocellulosic composition.
This research examines the gasification behavior of bamboo biomass, with particular emphasis on syngas composition, as illustrated in Figure 1. Syngas is a gaseous product consisting primarily of methane (CH₄), carbon monoxide (CO), carbon dioxide (CO₂), and hydrogen (H₂), together with smaller quantities of other gases3. The relative concentrations of these components influence the properties of syngas and its potential downstream applications4. Therefore, a detailed understanding of syngas composition and its variation under different operating conditions is essential for evaluating bamboo biomass gasification5.
In the present study, three bamboo species, namely Bambusa vulgaris (BV), Chimonobambusa calosa (CC), and Dendrocalamus longispathus (DL), were selected for experimental and computational investigation6. We selected the species based on their local availability as biomass feedstocks and differences in their proximate and ultimate compositions. Variations in volatile matter, fixed carbon, moisture, ash, and elemental composition can influence biomass reactivity, heating value, and syngas formation during gasification. Proximate and ultimate analyses were therefore conducted on the selected biomass samples, and their theoretical higher heating values (HHVs) were calculated to evaluate their energy characteristics7,8.
Previous studies have investigated fluidized-bed gasification and drying processes using reactors with different taper angles9,10. It has been reported that increasing the taper angle from 1° to 100° can adversely affect fluidization because particles may leave the reactor prematurely, resulting in under-fluidization11. Significant variations in fluidization characteristics have also been observed for taper angles ranging from approximately -60° to positive values, with changes in particle residence time and suspension density affecting process performance12. The authors have previously reported computational modeling of fluidization behavior in a tapered reactor13.
The unique properties of bamboo biomass, including its cellulose, hemicellulose, and lignin contents, influence its thermochemical conversion behavior and, consequently, affect syngas formation14. Operating conditions, biomass properties, and fluidization characteristics also affect gasification reactions15. Although previous investigations have examined bamboo gasification, a research gap remains in the integrated experimental and computational evaluation of major syngas components produced from multiple bamboo species. Comparing experimentally measured CH₄, CO, CO₂, and H₂ concentrations with computational predictions and evaluating the corresponding gas-solid hydrodynamic and thermal behavior warrants further investigation.
Accordingly, this study aimed to experimentally investigate syngas production from BV, CC, and DL bamboo biomass and to compare measured CH₄, CO, CO₂, and H₂ concentrations with computational predictions under the operating conditions investigated. Transient CFD analysis was also used to examine gas-phase velocity, solid-phase volume fraction, and temperature distribution within the reactor. The study hypothesized that differences in bamboo feedstock characteristics and gasification operating conditions would influence syngas composition and that the experimental and computational results would show comparable trends. The novelty of this work lies in combining experimental syngas characterization of three bamboo species with computational analysis and a direct comparison of measured and predicted syngas compositions in a single investigation. This approach extends the authors' previous work on reactor fluidization modeling13 by incorporating experimental syngas characterization and experimental-computational comparison.
Furthermore, this study seeks to bridge the gap between theoretical analysis and practical evaluation of bamboo-derived syngas by examining its composition under controlled gasification conditions16. The resulting syngas has potential applications in power generation, heat production, and biofuel synthesis, depending on its composition and quality17. This study's findings are intended to provide a systematic understanding of the relationship between bamboo feedstock characteristics, gasification conditions, and syngas composition, thereby supporting further optimization and application of bamboo biomass gasification.
البروتوكول
Biomass production application characterization
Three bamboo species, namely Chimonobambusa calosa (CC), Bambusa vulgaris (BV), and Dendrocalamus longispathus Kurz (DL), were selected as biomass feedstocks for the gasification study. The biomass samples were characterized according to the ASTM procedures listed in Table 1. Proximate analysis was performed to determine moisture, volatile matter, fixed carbon, and ash contents, whereas ultimate analysis was performed to determine carbon, hydrogen, nitrogen, and sulfur contents. The proximate-analysis values were reported on an as-received basis, while the ultimate-analysis values were reported on a dry basis. Oxygen content was calculated by difference on the corresponding reporting basis. The characterization results are presented in Table 2. Proximate and ultimate analyses are commonly used to evaluate biomass feedstocks for thermochemical conversion, while compositional parameters can also be used to estimate biomass higher heating value (HHV)18,19.
The volatile matter contents of CC, BV, and DL were 80.0%, 76.0%, and 82.0%, respectively. The fixed carbon contents were 2.5%, 4.2%, and 4.3%, while the ash contents were 9.5%, 9.9%, and 5.7%, respectively. The carbon contents were 44.0%, 46.5%, and 46.2% for CC, BV, and DL, respectively. The corresponding hydrogen contents were 6.2%, 6.6%, and 6.14%, respectively. The sulfur contents were 0.28%, 0.24%, and 0.27%, respectively, whereas the nitrogen content was negligible for all three feedstocks. The HHVs of CC, BV, and DL were 17.60, 18.57, and 17.72 MJ/kg on a dry basis, respectively. Among the investigated feedstocks, BV exhibited the highest carbon content and HHV. The HHV was calculated using the empirical correlation proposed by Channiwala and Parikh: HHV = 0.3491C + 1.1783H + 0.1005S − 0.1034O − 0.0151N − 0.0211A, where HHV is the higher heating value (MJ/kg), and C, H, O, N, S, and A represent the mass percentages of carbon, hydrogen, oxygen, nitrogen, sulfur, and ash, respectively.
Experimental gasification
The gasification experiments were conducted in a bubbling fluidized-bed reactor, as shown in Figure 2. Air was used as the fluidizing and gasifying medium. Before biomass feeding, the reactor was warmed to 50 °C as an initial reactor-conditioning step, and not as the gasification temperature. After the required operating temperature was established, the bamboo biomass was continuously fed into the reactor at a rate of 20 g/min. The biomass particle diameter was 1.118 mm. The reactor pressure drop was monitored using a U-tube manometer. The experimental investigation considered gasification temperatures in the range of 700–1000 °C and superficial air velocities in the range of 0.2–0.4 m/s. However, the quantitative syngas dataset available for the present manuscript corresponds to 800 °C and 0.2 m/s for Bambusa vulgaris (BV), Chimonobambusa calosa (CC), and Dendrocalamus longispathus (DL). Therefore, the experimental–computational comparison of H₂, CO, CO₂, and CH₄ presented in Figure 3 is restricted to this condition. The available dataset does not support reporting a complete quantitative syngas-composition series across all temperature–velocity combinations. Reactor dimensions and operating parameters are provided in Table 3.
Syngas sampling and analysis
The syngas produced during gasification was analyzed using a Testo 350XL gas analyzer to determine the concentrations of hydrogen (H₂), carbon monoxide (CO), carbon dioxide (CO₂), and methane (CH₄). Following stabilization of the gasification process, syngas was withdrawn from the reactor outlet and continuously supplied to the analyzer through the sampling line. Three measurements were obtained for each experimental condition, and the reported values represent the mean concentrations. Before analysis, the gas analyzer was calibrated using zero gas and certified calibration gases in accordance with the manufacturer's recommended procedure. The analyzer readings were recorded after stabilization, and the manufacturer-specified measurement uncertainty was accounted for when reporting the results. The measured syngas concentrations are reported as dry-gas volume percentages (vol%) for H₂, CO, CO₂, and CH₄. No additional normalization to 100% was applied after excluding N₂. Nitrogen, which originated from the air supplied as the gasifying medium, was therefore not included in the four-component syngas composition presented in Figure 3. Consequently, the sum of H₂, CO, CO₂, and CH₄ represents their measured dry-gas concentrations and does not imply complete four-component normalization.
Principal gasification reactions
Carbonaceous by-products such as soot may also form during biomass gasification, depending on the operating conditions20. The principal reactions considered in the analysis of syngas formation are given below21.





Equation (1) represents the complete oxidation of carbon, whereas Equation (3) represents the partial oxidation of carbon. Equation (2) represents the water-gas reaction and contributes to CO and H₂ formation. Equation (4) represents the water-gas shift reaction, which governs the interconversion of CO, CO₂, and H₂. Equation (5) represents the methanation reaction and contributes to CH₄ production. Gasification temperature, moisture content, fluid velocity, and biomass characteristics influence the relative contributions of these reactions.
Computational modeling
CFD simulations using ANSYS Fluent were performed to examine the gas–solid flow behavior and temperature distribution in the reactor22. The reactor dimensions and operating conditions given in Tables 3 and 4 were used to construct the computational domain. The solid phase was represented by the dry silica/sand bed, whereas the gas phase was represented by fluidization air. Gas–solid flow was modeled using an Eulerian multiphase model, in which the gas and solid phases were treated as interpenetrating continua. The local phase volume fractions were constrained by

where εg and εs are the local gas- and solid-phase volume fractions, respectively. The computational model was solved using a pressure-based transient solver. The k − ε viscous model was employed for the gas-phase flow, and phase-coupled SIMPLE was used for pressure–velocity coupling. Hybrid initialization was applied before the transient calculations. The simulations consisted of 5,000 time steps with a time step size of 0.001 s, corresponding to a total simulated time of 5 s. A pressure-outlet boundary condition of 101,325 Pa was specified at the reactor outlet, with the corresponding backflow conditions defined for the fluidization air phase. The reactor walls were treated as stationary, and the thermal and phase-interaction conditions were specified as in Table 3.
The Eulerian multiphase CFD model was used to calculate the gas–solid hydrodynamic and thermal behavior of the reactor; however, it did not directly calculate H₂, CO, CO₂, and CH₄ because biomass devolatilization, species transport, and gas-phase reaction kinetics were not included in the CFD model. The simulated syngas compositions presented in Figure 3 were obtained using a zero-dimensional (0-D) stoichiometric thermodynamic-equilibrium model based on the ultimate analysis and moisture content of each bamboo species. The global gasification reaction was represented as CH1.71O0.78 + wH₂O + mO₂ + 3.76mN₂ → x1H₂ + x2CO + x3CO₂ + x4H₂O + x5CH₄ + 3.76mN₂. The unknown product-gas coefficients were determined using carbon, hydrogen, and oxygen mass balances, together with methane-formation and water-gas-shift equilibrium relationships, 1 = x2 + x3 + x5, 1.71 + 2w = 2x1 + 2x4 + 4x5, 0.78 + w + 2m = x2 + 2x3 + x4, K1 = x5/x21, and K2 = x1x3/(x2x4), respectively. The temperature-dependent equilibrium constants were evaluated from the standard Gibbs free energy of reaction using ln K = −ΔG0T/(RT), and the resulting system of equations was solved using the multivariable Newton–Raphson method in MATLAB. The equilibrium calculations were performed for BV, CC, and DL under conditions corresponding to the experimental comparison: 800 °C, an inlet air velocity of 0.2 m/s, and atmospheric pressure (101,325 Pa). The calculated equilibrium mole fractions were converted to dry-gas volume percentages and used as the simulated H₂, CO, CO₂, and CH₄ concentrations shown in Figure 3. Thus, the Eulerian multiphase CFD model describes the gas–solid hydrodynamic and thermal fields, whereas the 0-D thermodynamic equilibrium model provides predictions of syngas composition. The equilibrium model formulation was based on the previously reported bamboo gasification methodology of Gopan et al.7.
Computational domain and operating conditions
Tables 3 and 4 summarize the computational parameters and boundary conditions used in the CFD simulations. The reactor had an overall height of 1 m, an internal diameter of 0.15 m, and a wall thickness of 0.006 m. The computational domain consisted of a gas phase representing the fluidization air and a solid phase representing the dry silica/sand bed. The initial solid-phase volume fraction was set to 0.60, with a sand particle diameter of 1.118 mm and a density of 1,200 kg/m3. The simulations were performed using a transient, pressure-based solver with the Eulerian multiphase model and the k–ε turbulence model. Phase-coupled SIMPLE was used for pressure–velocity coupling, and the simulations were conducted over 5,000 time steps with a time step of 0.001 s, corresponding to a total simulation time of 5 s. The initial sand-bed height was 0.25 m, with an initial solid packing fraction of 0.60. The spherical-equivalent particle diameter was 1.118 mm. Air was specified as the primary phase with a density of 1.225 kg/m3. The dry silica/sand was specified as the secondary solid phase with a density of 1,200 kg/m3 and a thermal conductivity of 0.20 W/(m·K). The inlet pressure was specified as 101,325 Pa. Gravity was applied in the negative Y-direction with a magnitude of 9.81 m/s2. The reactor wall was specified as steel with a thickness of 0.006 m, and the external/free-stream temperature was set to 300 K. The pressure-outlet condition was applied at the reactor outlet.
Minimum fluidization velocity
The minimum fluidization velocity was evaluated using an Ergun-based correlation23. At minimum fluidization, the pressure drop through the packed bed balances the effective weight of the solid particles. The Ergun relationship can be expressed as

where Umf is the minimum fluidization velocity (m/s), ε0 is the fixed-bed voidage (dimensionless), μf is the fluid dynamic viscosity (Pa·s), dp is the particle diameter (m), ρf is the fluid density (kg/m3), ρs is the solid-particle density (kg/m3), and g is the gravitational acceleration (m/s2). Using the particle diameter of 1.118 mm, solid density of 1,200 kg/m3, air density of 1.225 kg/m3, and the specified bed properties, the calculated minimum fluidization velocity was approximately 0.66 m/s. This value was compared with the experimental superficial air velocities of 0.2–0.4 m/s to assess the fluidization condition. Because the calculated Umf is higher than the reported experimental velocities, the operating conditions should not be described as fully developed fluidization solely on the basis of this calculation.
Suspension density
The suspension density describes the effective density of the gas-solid mixture within the fluidized region. The original expression,
ρsus = (1 − ε0) + ε0ρg
It is dimensionally inconsistent because the first term is dimensionless, whereas the second term has units of density. For a volume-averaged gas-solid mixture, the suspension density is expressed as

or equivalently,

Here, ρsus is the suspension density (kg/m3), εs is the solid-phase volume fraction, εg is the gas-phase volume fraction, ρs is the solid-phase density (kg/m3), and ρg is the gas-phase density (kg/m3).
Residence time
The experimental procedure described above did not directly measure or independently vary particle residence time. Therefore, residence time was not treated as an independently controlled experimental parameter. The transient CFD simulations were conducted for 5 s using 5,000 time steps of 0.001 s; however, this computational duration represents the simulated time and should not be interpreted as the experimentally measured particle residence time.
النتائج
Experimental syngas composition
Figure 3 presents a comparison between the experimental and simulated compositions of the major syngas components, namely hydrogen (H₂), carbon monoxide (CO), carbon dioxide (CO₂), and methane (CH₄), for Bambusa vulgaris (BV), Chimonobambusa calosa (CC), and Dendrocalamus longispathus (DL). The comparison was performed at a gasification temperature of 800 °C and an inlet fluid velocity of 0.2 m/s. For BV, the simulated concentrations of H₂, CO, CO₂, and CH₄ were approximately 22.5%, 25.0%, 36.0%, and 3.0%, respectively, whereas the corresponding experimental values were approximately 20.5%, 22.5%, 33.0%, and 2.4%, respectively. For CC, the simulated concentrations were 20.5% H₂, 22.0% CO, 37.0% CO₂, and 2.7% CH₄, compared with experimental values of 17.8%, 19.5%, 34.5%, and 1.8%, respectively. For DL, the simulated concentrations were 21.0% H₂, 22.0% CO, 37.5% CO₂, and 3.0% CH₄, whereas the corresponding experimental values were 18.0%, 19.0%, 35.5%, and 1.9%, respectively. The simulated compositions followed trends like those observed experimentally, although the simulated concentrations were generally higher than the measured values. These differences may be associated with idealized assumptions in the computational representation, differences between the experimental and numerical boundary conditions, and the absence of detailed biomass conversion and reaction kinetics in the hydrodynamic CFD model. The observed syngas composition is consistent with the contributions of oxidation, water-gas, water-gas shift, and methanation reactions; however, these reaction-based explanations are used only to interpret the measured composition and do not represent experimentally determined reaction rates or extents.
The simultaneous presence and relative variation of these gas components are consistent with the principal gasification reactions described above, including water-gas, oxidation, water-gas shift, and methane-forming processes. These reaction assignments are interpretations based on compositional trends and established gasification chemistry, rather than on direct measurements of reaction rates or pathways.
Effect of operating conditions on syngas composition
The experimental results indicate that syngas composition varied among the three bamboo species under the selected gasification conditions. Figure 3 presents the measured and simulated syngas compositions at 800 °C and an inlet fluid velocity of 0.2 m/s. For BV, the measured concentrations of H₂, CO, CO₂, and CH₄ were approximately 20.5%, 22.5%, 33.0%, and 2.4%, respectively. For CC, the corresponding values were 17.8%, 19.5%, 34.5%, and 1.8%, while DL produced approximately 18.0%, 19.0%, 35.5%, and 1.9%, respectively. These measurements show that BV had the highest measured H₂ and CO concentrations, whereas DL exhibited the highest CO₂ concentration and BV the highest CH₄ concentration among the three feedstocks under the selected condition. Differences in syngas composition may be associated with variations in feedstock characteristics. BV contained 46.5% carbon, compared with 44.0% for CC and 46.2% for DL, while the corresponding HHVs were 18.57, 17.60, and 17.72 MJ/kg, respectively. These compositional differences can influence the relative formation of gaseous products during gasification. However, the available experimental dataset does not provide a complete quantitative series in which gasification temperature and fluid velocity were independently varied with corresponding syngas measurements. Therefore, the present study does not claim to experimentally quantify the effects of temperature or fluid velocity on syngas composition. Instead, the results are interpreted as a comparison of the three bamboo feedstocks under the selected operating condition of 800 °C and 0.2 m/s.
Experimental pressure-drop behavior
The pressure drop across the fluidized bed was monitored using a U-tube manometer during the gasification experiments. Pressure-drop monitoring was used to observe changes in the bed's fluidization conditions. However, the available results dataset does not include numerical pressure-drop measurements. Therefore, the pressure-drop measurement is reported as an experimental monitoring procedure rather than as a quantitative CFD-validation dataset. Direct experimental–computational validation of fluidization behavior based on pressure drop would require reporting measured pressure-drop values alongside the corresponding simulated pressure gradients.
Fluid-phase velocity distribution
Figure 4 presents the simulated fluid-phase velocity contours for inlet velocities of 0.1, 0.2, 0.3, 0.4, and 0.5 m/s. The experimentally investigated superficial air-velocity range was 0.2–0.4 m/s. The additional CFD cases at 0.1 and 0.5 m/s were included only to illustrate the hydrodynamic response of the reactor over a wider computational velocity range and were not used as experimental operating conditions or for experimental–computational comparison of syngas composition. The inlet velocity represents the prescribed boundary condition, whereas the velocity values within the contours represent local velocities calculated throughout the computational domain. Therefore, the local velocity is not expected to remain equal to the prescribed inlet velocity throughout the reactor. At 0.1 m/s, fluid motion is concentrated mainly in the lower region of the reactor. With increasing inlet velocity, the gas penetrates progressively farther into the solid bed, resulting in a more developed gas-phase velocity field. At 0.2 m/s, the gas phase penetrates the lower bed region, thereby promoting gas–solid interaction. Further increases in inlet velocity produce greater upward gas-phase transport. Thus, Figure 4 illustrates the computational hydrodynamic behavior over the tested numerical velocity range, whereas the experimentally relevant range is 0.2–0.4 m/s.
Solid-phase volume fraction
Figure 5 shows transient solid-phase volume-fraction contours at 0.2 m/s input fluid velocity. These contours represent simulation times of 0, 1, 1.5, 2, and 2.5 s. Early in the simulation, the solid phase is mostly in the bottom bed. The solid phase redistributes when the gasifying medium enters the reactor. At 1 s, the solid phase increases, whereas at 1.5 s, particles occupy a greater volume of the reactor. Areas of increased solid-phase concentration remain apparent at 2 and 2.5 s. Transient solid-phase redistribution under the simulated gas-flow condition is evident in these contours. The localized areas of elevated solid-phase percentage imply particle clustering or nonuniform particle distribution; the CFD data alone do not prove chemical agglomeration. Particle redistribution may affect gas-solid interaction conditions and the biomass conversion environment.
Temperature distribution
Figure 6 shows the simulated temperature distribution at an input fluid velocity of 0.2 m/s for simulation durations of 0, 0.1, 0.2, 0.3, 0.4, and 0.5 s. The CFD simulation ran for 5 s with 5,000 time steps of 0.001 s each. The time periods in Figure 6 are snapshots from the 5-s transient simulation. The temperature contours show the evolution of the reactor thermal field. The initial temperature distribution is roughly uniform. Due to gas-solid interaction and heat transport, spatial temperature gradients develop over time. The reactor has higher temperatures in the lower and middle regions and lower temperatures in the top region. Figure 6's temperature scale reaches 973 K (700 °C). Thus, the contour does not indicate a constant temperature of 750–800 °C.
At 800 °C and an inlet air velocity of 0.2 m/s, the computationally predicted syngas composition was compared with the experimental syngas composition. The experimental concentrations of H₂, CO, CO₂, and CH₄ in Bambusa vulgaris were 20.5%, 22.5%, 33.0%, and 2.4%, whereas the CFD estimates were 22.5%, 25.0%, 36.0%, and 3.0%. Thus, the absolute percentage discrepancies were 2.0, 2.5, 3.0, and 0.6 percentage points, equating to relative variances of 9.8%, 11.1%, 9.1%, and 25.0%. These findings indicate qualitative agreement between the experimental and computational syngas compositions for the examined condition, although the magnitude of the relative differences varied among the gas components. The minimum fluidization velocity was not measured experimentally; however, it was estimated theoretically using the Ergun-based correlation described in Equation (7). Using the specified particle and fluid properties, the calculated minimum fluidization velocity was approximately 0.66 m/s. This theoretical value is higher than the experimental inlet air velocity of 0.2 m/s used for the comparison in Figure 3. Therefore, the calculated Umf is treated as a theoretical reference rather than an experimentally verified fluidization threshold. Bed expansion was not independently quantified during the experiments, although the U-tube manometer was used to monitor the reactor pressure drop.
Data Availability
The dataset used in this study comprises original experimental and computational data generated during the bamboo biomass gasification investigation. It includes biomass characterization data for Chimonobambusa calosa (CC), Bambusa vulgaris (BV), and Dendrocalamus longispathus (DL), experimental syngas measurements of H₂, CO, CO₂, and CH₄, HHV calculations, and CFD output data for gas-phase velocity, solid-phase volume fraction, and temperature distribution. The verified dataset underlying the reported results and figures is available in Zenodo at https://doi.org/10.5281/zenodo.22183458
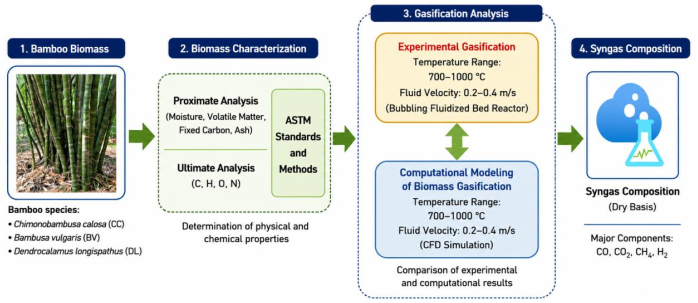
Figure 1: Biomass gasification process flow diagram. Schematic representation of bamboo biomass characterization, experimental gasification, computational modeling, and syngas composition analysis. The experimental and computational gasification conditions considered gasification temperatures of 700–1,000 °C and fluid velocities of 0.2–0.4 m/s. Please click here to view a larger version of this figure.
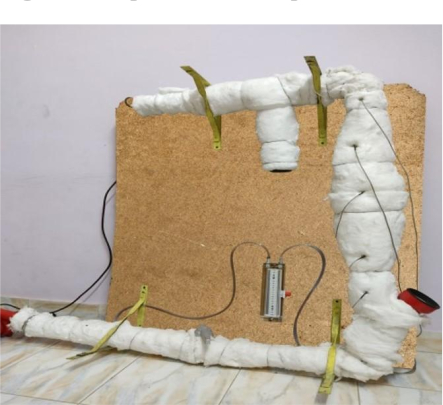
Figure 2: Experimental gasification setup. Photograph of the bubbling fluidized-bed gasification system used for experimental bamboo biomass gasification and syngas production. Please click here to view a larger version of this figure.
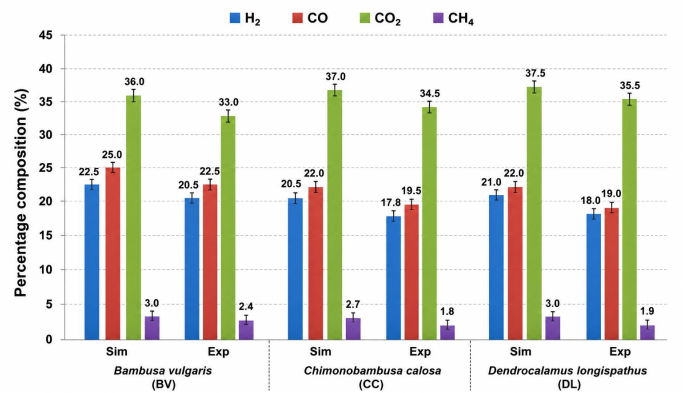
Figure 3: Comparison of simulated and experimental syngas compositions. Comparison of H₂, CO, CO₂, and CH₄ concentrations for Chimonobambusa calosa (CC), Bambusa vulgaris (BV), and Dendrocalamus longispathus (DL) at 800 °C and an inlet fluid velocity of 0.2 m/s. The compositions are reported on a dry-gas basis. Error bars represent ± standard deviation of three independent experimental measurements (n = 3). Please click here to view a larger version of this figure.
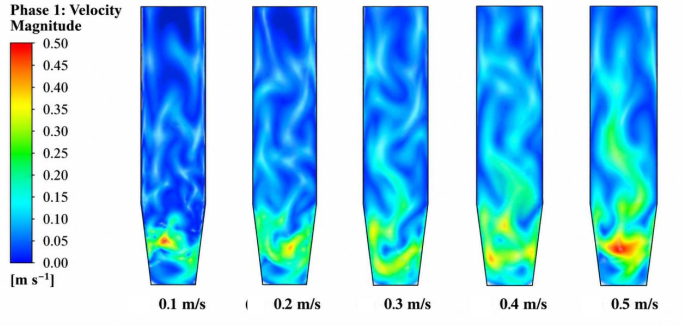
Figure 4: Simulated fluid-phase velocity distribution. Simulated fluid-phase velocity contours at inlet velocities of 0.1, 0.2, 0.3, 0.4, and 0.5 m/s, illustrating the corresponding local velocity distribution within the reactor. The 0.1 and 0.5 m/s cases represent additional computational conditions and were not experimental operating conditions. Please click here to view a larger version of this figure.
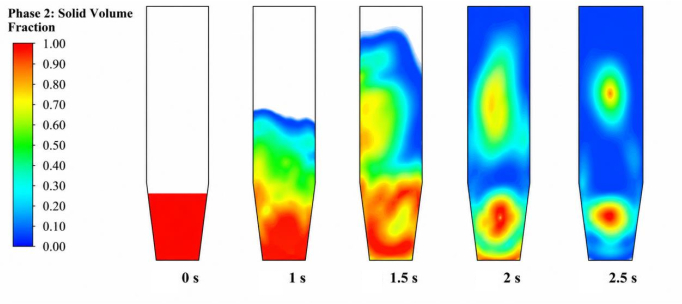
Figure 5: Transient solid-phase volume-fraction distribution. Simulated solid-phase volume-fraction contours at an inlet fluid velocity of 0.2 m/s at simulation times of 0, 1, 1.5, 2, and 2.5 s. Please click here to view a larger version of this figure.
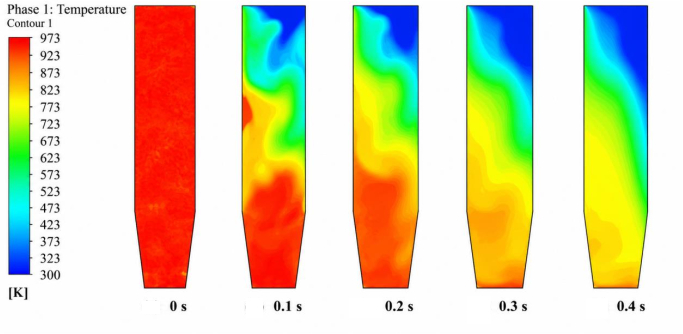
Figure 6: Transient temperature distribution. Simulated reactor temperature contours at an inlet fluid velocity of 0.2 m/s at the indicated simulation times. The temperature scale and time points correspond to the numerical CFD results presented in the figure. Please click here to view a larger version of this figure.
| Analysis | Property | ASTM standard/method |
| Proximate analysis | Moisture content (% w/w) | ASTM E871 |
| Volatile matter (% w/w) | ASTM E872 | |
| Ash content (% w/w) | ASTM E1755 | |
| Fixed carbon (% w/w) | By difference | |
| Ultimate analysis | Carbon (C, %) | ASTM D5373 |
| Hydrogen (H, %) | ASTM D5373 | |
| Nitrogen (N, %) | ASTM D5373 | |
| Sulfur (S, %) | ASTM D4239 | |
| Oxygen (O, %) | By difference |
Table 1: ASTM standards and methods used for bamboo biomass characterization. ASTM standards and corresponding analytical methods were used to determine the proximate and ultimate compositions of the selected bamboo biomass samples.
Table 2: Proximate and ultimate characteristics of the selected bamboo species. Proximate and ultimate analysis results and higher heating values (HHVs) of Chimonobambusa calosa (CC), Bambusa vulgaris (BV), and Dendrocalamus longispathus (DL). Proximate-analysis values are reported on an as-received basis, whereas ultimate-analysis values and HHVs are reported on a dry basis. Please click here to download this file.
Table 3: Experimental and computational boundary conditions and operating parameters. Numerical reactor dimensions, material properties, inlet conditions, outlet pressure, wall conditions, phase properties, and operating parameters used in the experimental and CFD analyses. The CFD outlet was set to a pressure outlet at atmospheric pressure (101,325 Pa), and the heating-zone temperature was set to the gasification temperature used for each simulation. Please click here to download this file.
Table 4: Computational modeling parameters. Numerical models, solver settings, phase definitions, initialization procedure, pressure–velocity coupling scheme, time-step settings, and other computational parameters used for the transient Eulerian multiphase CFD simulations. Please click here to download this file.
المناقشة
Experimental syngas analysis and computational modeling of gas-solid flow and temperature distributions were used to investigate the behavior of three bamboo species: Bambusa vulgaris (BV), Chimonobambusa calosa (CC), and Dendrocalamus longispathus (DL). We observed differences in feedstock characteristics and syngas composition among the three species. At 800 °C and an inlet fluid velocity of 0.2 m/s, H₂, CO, CO₂, and CH₄ were detected for all three bamboo species, and the computational predictions showed qualitative agreement with the experimental compositions.
Initial biomass production application features may distinguish bamboo species. BV had the greatest HHV and 46.5% carbon content, compared to 44.0% for CC and 46.2% for DL. The similar carbon concentrations in BV and DL, but varying HHVs, suggest that elemental composition, not carbon quantity, affects HHV. Ash contents were 9.9%, 9.5%, and 5.7% for BV, CC, and DL. These changes in feedstock composition may alter thermal conversion and gas composition.
The experimental and simulated syngas compositions at 800 °C and 0.2 m/s exhibit similar patterns, although the simulated concentrations are greater. In BV, modeling and experiment show absolute differences of approximately 2.0, 2.5, 3.0, and 0.6 percentage points for H₂, CO, CO₂, and CH₄, respectively. Similar discrepancies exist for CC and DL. The idealized computational representation and the practical gasification environment may differ due to gas-solid interactions, heat transport, heterogeneity in biomass production applications, and numerical model simplifications. The current dataset lacks quantitative CFD validation based on mesh independence, pressure-drop measurements, and uncertainty analysis; the comparison should be viewed as an evaluation of agreement in syngas composition rather than numerical validation.
The main gasification processes in the Methods section may explain the syngas composition. CO and CO₂ creation result from partial and total carbon oxidation, whereas the water-gas reaction produces H₂ and CO. The water-gas shift reaction converts CO and CO₂ to H₂ and CO₂, whereas methanation converts CO and H₂ to CH₄. The relatively high CO₂ concentration in Figure 3 is consistent with contributions from carbon oxidation and water-gas shift reactions under the conditions examined. The presence of H₂ and CO suggests gasification processes involving carbon, steam, and the gasifying medium. These reaction-based explanations represent mechanistic interpretations of the observed gas composition rather than direct measurements of individual reaction rates or pathways.
The CFD simulations provide additional insight into the hydrodynamic behavior of the gasification system24. Figure 4 illustrates that increasing input velocity from 0.1 to 0.5 m/s alters fluid-phase velocity distribution and increases gas-phase upward transport. Gas enters the lower bed and interacts with the solid phase at a velocity of 0.2 m/s. Figure 5 exhibits solid-phase transient redistribution at 0.2 m/s. The transient simulations show the redistribution of the initially concentrated solid bed. These findings demonstrate changes in the simulated gas-solid hydrodynamic behavior as a function of inlet fluid velocity.
Figure 6 shows that the heat field changes spatially and temporally during transient CFD simulations. The contour, therefore, represents a simulated transient temperature field rather than a constant reactor temperature of 750–800 °C. Figure 3 shows an 800 °C experimental comparison, whereas Figure 6 shows transient CFD snapshots. Temperature impacts the relative relevance of oxidation, water-gas, water-gas shift, and methanation pathways; the current dataset lacks precisely measured reaction rates to quantify each reaction's contribution. Thus, temperature affects syngas composition via defined chemical routes rather than kinetic relationships.
Thermochemical conversion of agricultural biomass residues has also been investigated as a route for energy generation25. The findings are broadly consistent with biomass gasification studies in which bamboo and other lignocellulosic feedstocks produce H₂, CO, CO₂, and CH₄ as major gaseous components. These measurements follow the compositional behavior of biomass production application-derived syngas, but component concentrations vary strongly depending on reactor configuration, gasifying agent, equivalence ratio, temperature, feedstock composition, particle size, and moisture content. Comparisons across studies should be made carefully, since wet/dry reporting basis, gas normalization, gasifying agent composition, and sample processing might greatly affect reported percentages26.
Based on these results, reactor hydrodynamics and biomass production parameters should be considered when evaluating syngas composition. These bamboo species had distinct proximate and ultimate compositions, and CFD results showed transient variations in gas velocity and solid-phase distribution. Particle mobility affects gas-solid interactions and heat transfer, whereas temperature conditions affect syngas production processes. The tests quantify the gas composition, while the CFD analysis reveals the flow and heat fields27.
Reliability
We assessed the reliability of the present findings by comparing experimental and simulated syngas compositions at 800 °C and an inlet fluid velocity of 0.2 m/s. The relative differences for H₂, CO, CO₂, and CH₄ were 9.8%, 11.1%, 9.1%, and 25.0%, respectively. Although the experimental and computational results showed qualitative agreement under the conditions examined, quantitative assessment of model reliability is limited by the lack of a comprehensive uncertainty analysis, a statistical treatment of independent replicates, and experimental validation based on pressure drop, bed expansion, and minimum fluidization velocity. The findings are therefore limited to the bamboo species and operating conditions investigated and should not be generalized to other feedstocks or reactor configurations without further validation. Future studies should include additional independent replicates, comprehensive statistical and uncertainty analyses, further CFD validation, and quantitative assessment of syngas yield, carbon conversion efficiency, cold gas efficiency, tar, and particulate concentrations.
Limitations
Several limitations should be considered when interpreting the present findings. In the gas study, we quantified only the main components (H₂, CO, CO₂, and CH₄), excluding minor gases and trace species. Second, the study did not assess tar, particulate matter, or other condensable or solid products, limiting a thorough assessment of product dispersion or pollutant emissions. The CFD model gives important information on gas-solid flow and temperature behavior; however, the research lacks mesh-independence evaluation, time-step-independence analysis, quantitative pressure-drop validation, and uncertainty-based validation. Fourth, the study examined only three bamboo species, limiting generalization to additional bamboo varieties and other biomass feedstocks. The experimental dataset did not separately quantify or alter moisture and particle residence times.
الإفصاحات
The authors declare no conflict of interest.
شكر وتقدير
This research received no specific grant from any funding agency in the public, commercial, or not-for-profit sectors.
المواد
| الاسم | الشركة | رقم فهرسي | التعليقات |
|---|---|---|---|
| Air supply system | Atlas Copco | GA 15 | Air supply for fluidization and gasification |
| ANSYS Fluent | ANSYS Inc. | ANSYS Fluent 2023 R2 | Eulerian multiphase CFD simulations |
| Bambusa vulgaris biomass | Local biomass supplier | N/A | Bamboo biomass; particle size 1.118 mm |
| Biomass feeder | Laboratory fabricated | N/A | Biomass feeding rate 20 g/min |
| Bubbling fluidized-bed reactor | Laboratory fabricated | N/A | Height 1 m; internal diameter 0.15 m; wall thickness 0.006 m |
| Chimonobambusa calosa biomass | Local biomass supplier | N/A | Bamboo biomass; particle size 1.118 mm |
| Computer workstation | Dell Technologies | Precision 5820 | CFD simulation and data processing |
| Dendrocalamus longispathus biomass | Local biomass supplier | N/A | Bamboo biomass; particle size 1.118 mm |
| Digital balance | Sartorius | Entris II | Biomass weighing |
| Gas analyzer | Testo SE & Co. KGaA | Testo 350XL | Measurement of H2, CO, CO2, and CH4 |
| Moisture analyzer | OHAUS | MB23 | Biomass moisture determination |
| Silica/sand bed | Sigma-Aldrich | S5631 | Particle diameter 1.118 mm; density 1200 kg/m³ |
| Type-K thermocouple | Omega Engineering | KMQXL-116G-6 | Reactor temperature measurement |
| U-tube manometer | Dwyer Instruments | 1227 | Reactor pressure-drop measurement |
المراجع
- Song Y et al. Utilization of bamboo biomass production application as a biofuels feedstocks: process optimization with yeast immobilization and the sequential fermentation of glucose and xylose. Fuel. 2022;307:121892. doi:10.1016/j.fuel.2021.121892.
- Jayakrishnan R, Johnpaul V, Balasundaram N, Senthilkumar S. Stabilization of black cotton soil in Chittur region in Palakkad using lime, rice husk ash, coir fibre. Indian Journal of Engineering. 2026;23:e3ije1709. doi:10.54905/disssi.v23i59.e3ije170.
- Mani M. Quasi-static puncture shear resistance behaviour of silica nanoparticle-reinforced carbon fiber–polypropylene splint–epoxy hybrid laminates for biomedical implants. Journal of Adhesion Science and Technology. 2025:1-30. doi:10.1080/01694243.2025.2586057.
- Ogbonnaya EP et al. Efficacy of Moringa oleifera leaf extract as a phytogenic additive in finisher broiler chickens. Discovery Agriculture. 2026;12:e14da3219. doi:10.54905/disssi.v12i25.e14da32.
- Gambarotta A, Morini M, Zubani A. A non-stoichiometric equilibrium model for the simulation of the biomass production application gasification process. Applied Energy. 2018;227:119-127. doi:10.1016/j.apenergy.2017.07.135.
- Gopan G, Hauchhum L, Kalita P, Pattanayak S. Biomass production application gasification in a double-tapered bubbling fluidized bed reactor using preheated air. International Journal of Energy and Environmental Engineering. 2022;13(2):643-656. doi:10.1007/s40095-021-00451-8.
- Gopan G et al. Prediction of species concentration in syngas produced through gasification of different bamboo biomass production applications: a numerical approach. International Journal of Energy and Environmental Engineering. 2022;13(4):1383-1394. doi:10.1007/s40095-022-00492-7.
- Arun M. Computational fluid dynamics and experimental investigation of dimple tube solar trough heater using silver nanofluids. International Journal of Low-Carbon Technologies. 2026;21:ctag097.
- Mani M. Influence of lattice geometry on energy absorption and puncture resistance in 3D-printed ABS structures for advanced medical implants. Advanced Composite Materials. 2025:1-27. doi:10.1080/09243046.2025.2524256.
- Rinesh S et al. Prediction and classification of solar photovoltaic power generation using extreme gradient boosting regression model. International Journal of Low-Carbon Technologies. 2024;19:2420-2430.
- Venkatesh R. Effect of hybrid nanofluid and polyethylene glycol/aluminium foam on thermal characteristics and energy storage performance of solar air heater. Applied Thermal Engineering. 2026;291:130213. doi:10.1016/j.applthermaleng.2026.130213.
- Darwis A, Iswanto AH. Morphological characteristics of i and the distribution and shape of vascular bundles therein. Journal of the Korean Wood Science and Technology. 2018;46(4):315-322. doi:10.5658/WOOD.2018.46.4.315.
- Gopan G et al. Parametric study of tapered fluidized bed reactor under varied taper angle using TFM. AIP Conference Proceedings. 2021;2396:020020. Available from: https://doi.org/10.1063/5.0066547.
- Ding Z et al. A thermo-chemical and biotechnological approaches for bamboo waste recycling and conversion to value added product: towards a zero-waste biorefinery and circular bioeconomy. Fuel. 2023;333:126469. doi:10.1016/j.fuel.2022.126469.
- Pattanayak S et al. Thermal performance and synergetic behaviour of co-pyrolysis of North East Indian bamboo biomass production application with coal using thermogravimetric analysis. Biomass Conversion and Biorefinery. 2023;13(13):11755-11768. doi:10.1007/s13399-021-02196-0.
- Liu X et al. Reduction mechanism of bamboo powder pyrolysis in selective lithium extraction from spent lithium-ion batteries. Journal of Environmental Chemical Engineering. 2023;11(3):110172. doi:10.1016/j.jece.2023.110172.
- de Priall O et al. Modelling and experimental investigation of small-scale gasification CHP units for enhancing the use of local biowaste. Waste Management. 2021;136:174-183. doi:10.1016/j.wasman.2021.10.012.
- Krishnan R, Hauchhum L, Gupta R, Gopan G. Selection criteria of municipal solid wastes for thermo-chemical conversion processes by using proximate and ultimate analysis. International Journal of Global Warming. 2021;24(1):1-13. doi:10.1504/IJGW.2021.115106.
- Pattanayak S, Loha C, Hauchhum L, Sailo L. Application of MLP-ANN models for estimating the higher heating value of bamboo biomass production application. Biomass Conversion and Biorefinery. 2021;11:2499-2508. doi:10.1007/s13399-020-00685-2.
- He Q et al. Soot formation during biomass production application gasification: a critical review. Renewable and Sustainable Energy Reviews. 2021;139:110710. doi:10.1016/j.rser.2021.110710.
- Lan W et al. Research on the characteristics of biomass production application gasification in a fluidized bed. Journal of the Energy Institute. 2019;92(3):613-620. doi:10.1016/j.joei.2018.03.011.
- Ismail TM, Abd El-Salam M, Monteiro E, Rouboa A. Fluid dynamics model on fluidized bed gasifier using agro-industrial biomass production application as fuel. Waste Management. 2018;73:476-486. doi:10.1016/j.wasman.2017.06.018.
- Fang S et al. Modeling of the minimum fluidization velocity and the incipient fluidization pressure drop in a conical fluidized bed with negative pressure. Applied Sciences. 2020;10(24):8764. doi:10.3390/app10248764.
- Kalita P, Saha UK, Mahanta P. Parametric study on the hydrodynamics and heat transfer along the riser of a pressurized circulating fluidized bed unit. Experimental Thermal and Fluid Science. 2013;44:620-630. doi:10.1016/j.expthermflusci.2012.09.001.
- George J, Arun P, Muraleedharan C. Sustainable energy generation from agricultural crop residues. In: Drück H, et al., editors. Green Buildings and Sustainable Engineering. Springer; Singapore; 2019. p. 113-123. doi:10.1007/978-981-13-1202-1_10.
- Mohanty R, Mahanta P, Sharma RP. Recent advances in biomass production application gasification to improve the quality of syngas: a comprehensive review. Industrial & Engineering Chemistry Research. 2025;64(28):13950-13965. doi:10.1021/acs.iecr.5c01388.
- Liang J et al. Potential use of bamboo resources in energy value-added conversion technology and energy systems. GCB Bioenergy. 2023;15:e13072. doi:10.1111/gcbb.13072.