This study describes a rat model for evaluating post-exposure N-acetylcysteine and guarana treatment following acute acetaminophen toxicity. Across the evaluated outcomes, combined treatment produced findings that most consistently approached control values.
مقالة بحثية
Hepatoprotective Effects of N-Acetylcysteine and Guarana in a Wistar Rat Model of Acute Acetaminophen Toxicity
في هذه المقالة
ملخص
الملخص
Acetaminophen overdose causes acute liver injury through oxidative stress, inflammation, and hepatocellular damage. This study evaluated the post-exposure effects of N-acetylcysteine (NAC), guarana, and their combination in a rat model of acute acetaminophen toxicity. Thirty male Wistar rats were randomly allocated to the Control, APAP, APAP + NAC, APAP + Guarana, and APAP + NAC + Guarana groups. Acetaminophen (3 g/kg) was administered orally on day 8. Treatments were initiated 4 h later and repeated on days 9 and 10; NAC was administered intraperitoneally at 1.5 g/kg, whereas guarana was administered orally at 300 mg/kg. Serum liver enzymes, circulating oxidative stress and antioxidant parameters, hepatic TNF-α and IL-1β levels, and liver histopathology were assessed. Acetaminophen increased serum AST, ALT, ALP, and catalase activities, serum MDA levels, and hepatic TNF-α and IL-1β levels, decreased serum SOD activity, and caused marked histopathological injury. Histopathological scores differed significantly among groups for all six evaluated parameters and the total liver injury score (all P < 0.001). NAC monotherapy improved selected biochemical and inflammatory outcomes and significantly reduced sinusoidal congestion, inflammatory cell infiltration, and architectural disruption relative to APAP. Guarana monotherapy showed numerical changes in several measures but did not differ significantly from APAP in the histopathological comparisons after multiplicity correction. Combined NAC and guarana treatment produced the broadest treatment-associated response and significantly lower histopathological scores than APAP across all evaluated parameters. These findings support further evaluation of guarana as a potential adjunct to NAC after acetaminophen exposure without establishing superiority over NAC or a synergistic interaction.
المقدمة
Paracetamol (acetaminophen; APAP) is among the most frequently used analgesic and antipyretic agents worldwide because of its established clinical efficacy and favorable safety profile at recommended doses. However, this therapeutic margin narrows substantially after overdose, and APAP intoxication remains a major cause of drug-induced liver injury and acute liver failure in many countries1,2,3. Its unrestricted availability, together with accidental dosing errors and intentional ingestion, has sustained the clinical and experimental relevance of APAP toxicity. Elucidating the biological events that drive APAP-induced hepatic injury and identifying interventions capable of limiting its progression therefore remain important objectives in toxicology research4˒5. Experimental models of APAP-induced hepatotoxicity are particularly valuable because they reproduce characteristic biochemical and histological features of drug-induced liver injury and provide a controlled platform for assessing candidate hepatoprotective treatments2˒5˒6.
The hepatic toxicity of APAP originates primarily from its metabolic conversion within hepatocytes. At therapeutic concentrations, most APAP undergoes glucuronidation or sulfation and is subsequently eliminated. A smaller fraction is oxidized by cytochrome P450 enzymes, particularly cytochrome P450 2E1 (CYP2E1), to form the highly reactive intermediate N-acetyl-p-benzoquinone imine (NAPQI). Under physiological conditions, NAPQI is neutralized through conjugation with reduced glutathione (GSH). Following overdose, increased NAPQI generation exhausts intracellular GSH reserves, permitting the metabolite to accumulate and covalently bind to cellular proteins. The resulting sequence of redox imbalance, mitochondrial impairment, adduct formation, and hepatocellular necrosis culminates in disruption of hepatic architecture1⁻7. Because oxidative injury occupies a central position in this cascade, interventions that restore redox homeostasis, preserve endogenous antioxidant defenses, or restrict mitochondrial damage represent biologically plausible approaches to reducing APAP-induced hepatotoxicity1˒8˒9.
Oxidative stress and inflammation are closely interconnected components of APAP-induced liver injury. Excessive generation of reactive oxygen species (ROS), together with depletion of endogenous antioxidant systems, promotes lipid peroxidation, mitochondrial dysfunction, and loss of hepatocellular integrity. Injured hepatocytes may subsequently initiate inflammatory signaling, increasing the production of mediators that amplify local tissue damage. Accordingly, liver enzymes, indices of oxidant and antioxidant balance, and hepatic inflammatory cytokines provide complementary information on the development and severity of APAP-induced hepatotoxicity and the biological response to treatment1˒2˒6˒9˒10. Experimental work with flavonoids, polyphenols, and other antioxidant compounds further indicates that simultaneous attenuation of oxidative and inflammatory pathways may limit APAP-induced hepatic damage9,10,11,12. This mechanistic convergence makes antioxidant-oriented treatment strategies particularly relevant for experimental models of acute APAP intoxication8,9,10.
N-acetylcysteine (NAC) remains the principal antidotal treatment for APAP poisoning. Its most established function is to provide cysteine for GSH synthesis, thereby restoring the intracellular capacity to detoxify NAPQI. NAC may also improve redox balance, support mitochondrial function, and modulate inflammatory responses during the evolution of hepatic injury. When administered sufficiently early, it markedly reduces the likelihood of severe hepatotoxicity and improves clinical outcomes. These properties have established NAC as both the cornerstone of clinical management and a reference treatment in experimental investigations of APAP-induced liver injury8˒13.
Despite the effectiveness of NAC, interest persists in complementary agents that may reinforce antioxidant defenses or influence additional pathways involved in hepatocellular injury. Natural products containing polyphenols and related bioactive compounds, including silymarin, resveratrol, curcumin, and various flavonoids, have been examined for their capacity to reduce oxidative damage, preserve mitochondrial function, and regulate inflammatory signaling in experimental hepatotoxicity models9˒11˒12˒14. Such observations provide a rationale for evaluating naturally derived compounds alongside conventional antidotal therapy rather than as replacements for NAC9˒11. Among these candidates, guarana (Paullinia cupana) is of particular interest because its seeds contain caffeine, catechins, tannins, proanthocyanidins, and several other phenolic constituents associated with antioxidant, anti-inflammatory, and cytoprotective activity15,16,17,18.
Guarana has shown antioxidant, anti-inflammatory, and metabolic regulatory effects across a range of experimental settings17,18,19. Its polyphenol- and proanthocyanidin-rich composition has been linked to free-radical scavenging activity and reduced production of pro-inflammatory mediators, including tumor necrosis factor alpha (TNF-α)19. These properties are mechanistically relevant to APAP hepatotoxicity, in which depletion of antioxidant reserves and activation of inflammatory pathways contribute to progressive hepatocellular damage. Although direct evidence concerning guarana in acute APAP-induced liver injury remains limited, findings from other oxidative injury models indicate that it may exert cytoprotective and hepatoprotective effects16˒17˒20. The hepatic consequences of administering guarana after APAP exposure, either alone or together with NAC, therefore warrant targeted investigation using biochemical, inflammatory, and histopathological outcomes.
The present experimental study aimed to compare the hepatoprotective effects of guarana dry extract powder (Paullinia cupana) and NAC, administered alone or in combination after acute APAP exposure, in male Wistar rats. Hepatic injury and treatment-associated changes were assessed through serum liver enzyme activities, circulating oxidative stress and antioxidant defense parameters, hepatic TNF-α and interleukin-1 beta (IL-1β) levels, and semi-quantitative histopathological examination of liver tissue.
البروتوكول
All experimental procedures involving animals were conducted in accordance with internationally accepted guidelines for the care and use of laboratory animals and complied with the ARRIVE guidelines. The experimental protocol was approved by the Kırşehir Ahi Evran University Animal Experiments Local Ethics Committee (Decision No. 3, dated 12 June 2025). All efforts were made to minimize animal suffering and reduce the number of animals used throughout the study. Detailed information on the reagents, manufacturers, catalog numbers, and equipment is provided in the Table of Materials.
1. Preparation of Guarana and chemicals
Guarana (Paullinia cupana), acetaminophen, and N-acetylcysteine (NAC) were used in this study. Acetaminophen, guarana seed dry extract, and NAC were freshly prepared on each administration day. Guarana was prepared by suspending 1 g of guarana in 10 mL of sterile 0.9% physiological saline to obtain a final concentration of 100 mg/mL. The suspension was homogenized by vortex mixing and thoroughly mixed immediately before administration to maintain uniform particle distribution and minimize sedimentation. Guarana was administered orally by gavage at 300 mg/kg body weight. The required dose for each animal was calculated as follows: required dose (mg) = body weight (kg) × 300 mg/kg. For a rat weighing approximately 220 g, the calculated dose was approximately 66 mg of guarana extract, corresponding to 0.66 mL of the 100 mg/mL suspension. Fresh suspensions were prepared immediately before use, and homogeneity was visually confirmed before each administration.
Acetaminophen was prepared as a 300 mg/mL suspension in warmed sterile 0.9% physiological saline on the day of administration. Three grams of acetaminophen were suspended in a final volume of 10 mL. The suspension was initially homogenized by vortex mixing and subsequently maintained under continuous magnetic stirring to ensure uniform dispersion. APAP was administered as a single oral gavage dose of 3 g/kg at an administration volume of 10 mL/kg. The required dose for each animal was calculated as follows:
required dose (mg) = body weight (kg) × 3,000 mg/kg
For a rat weighing approximately 220 g, the calculated dose was 660 mg, corresponding to 2.2 mL of the 300 mg/mL suspension. The preparation was continuously stirred throughout the dosing period and rehomogenized immediately before each animal-specific dose was drawn to minimize sedimentation and variation in the amount of APAP delivered.
NAC was administered at 1.5 g/kg body weight using a sterile injectable formulation at a nominal concentration of 100 mg/mL (300 mg/3 mL). The administration volume was adjusted individually based on each animal's body weight. At this concentration, the selected NAC dose of 1.5 g/kg corresponded to an administration volume of 15 mL/kg. Accordingly, rats weighing 200–220 g received approximately 3.0–3.3 mL per administration. At each scheduled treatment time point, the calculated NAC volume was administered as a single intraperitoneal injection under aseptic conditions.
Animals were monitored during and after administration for leakage, abdominal distension, respiratory changes, impaired mobility, or other visible signs of distress. Each NAC dose was administered immediately after preparation. All solutions and suspensions were freshly prepared on each administration day and used immediately. Homogeneity of the APAP and guarana suspensions was maintained by continuous or repeated mixing, whereas the NAC solution was inspected for visible contamination or precipitation before administration. All procedures related to chemical preparation and administration were conducted in accordance with institutional laboratory safety regulations, and appropriate personal protective equipment was used throughout the study.
2. Animal selection, housing conditions, experimental groups, and randomization
Thirty adult male Wistar albino rats aged 8–12 weeks and weighing 200–220 g were obtained from the Experimental Animal Research Laboratory. Animals were housed individually in polycarbonate cages measuring 40 cm × 25 cm × 20 cm, with coarsely chopped pine shavings used as bedding. The animal room was maintained at 24 ± 2 °C and 35 ± 10% relative humidity under a 12 h light/12 h dark cycle, with illumination from 07:00 to 19:00. Standard pelleted rodent chow and tap water were provided ad libitum throughout the study. No dedicated environmental enrichment was provided during the acclimatization or experimental periods.
Before initiation of the experimental procedures, all animals underwent a 7-day acclimatization period. During acclimatization and throughout the experiment, animals were observed daily for general condition, food and water consumption, mobility, posture, coat appearance, and signs of distress.
Animals were randomly allocated to five experimental groups (n = 6 per group) using a computer-generated simple randomization method. The Control group received no experimental treatment. The APAP group received a single oral dose of acetaminophen (3 g/kg) on day 8. The APAP + NAC group received a single oral dose of acetaminophen (3 g/kg) on day 8, followed by NAC (1.5 g/kg). The APAP + Guarana group received a single oral dose of acetaminophen (3 g/kg) on day 8, followed by guarana (300 mg/kg). The APAP + NAC + Guarana group received a single oral dose of acetaminophen (3 g/kg) on day 8, followed by NAC (1.5 g/kg) and guarana (300 mg/kg).
Neither the Control group nor the untreated APAP group underwent treatment-matched sham procedures. No sham oral gavage, sham intraperitoneal injection, or treatment-matched vehicle administration was performed in these groups. Apart from routine husbandry, daily health monitoring, anesthesia, and terminal sample collection, animals in the Control group did not undergo APAP administration or treatment-related handling. Animals in the APAP group received APAP on day 8 but received no subsequent treatment or treatment-matched vehicle on days 8–10. Guarana was prepared in sterile 0.9% physiological saline, whereas NAC was administered from its injectable formulation without preparation of a separate vehicle.
Sample size was determined using an a priori power analysis for a fixed-effects one-way analysis of variance involving five experimental groups. The calculation assumed a large standardized effect size (Cohen’s f = 0.70), a type I error rate of 0.05, and statistical power of 80%. The effect size was prespecified to represent a large and biologically meaningful overall between-group difference expected in this experimental model. Under these assumptions, the required total sample size was 30 animals, corresponding to six animals per group. The calculation was designed for the overall five-group comparison and was not specifically powered to detect smaller pairwise differences between active treatment groups. The individual animal was considered the experimental unit.
3. Drug administration protocol
The APAP dose of 3 g/kg was selected based on previously published rat studies reporting acute hepatic injury with acceptable survival during the observation period16˒21˒22. The guarana dose of 300 mg/kg16 and the NAC dose of 1.5 g/kg were selected based on previously reported experimental doses13˒23. No pilot dose-finding study was performed.
Following acclimatization, all animals except those in the Control group received a single oral dose of APAP (3 g/kg) by gavage on day 8. Four hours after APAP administration, the first treatment dose was administered according to group allocation. Guarana (300 mg/kg) was administered by oral gavage using a 22-gauge stainless-steel feeding cannula. Each animal was maintained in an upright position, and the cannula was gently advanced through the esophagus into the stomach. If excessive resistance was encountered, the cannula was withdrawn and repositioned before administration. Animals were observed for regurgitation during and immediately after gavage.
NAC (1.5 g/kg) was administered intraperitoneally into the lower right quadrant of the abdomen. The needle was inserted at an angle of approximately 30°–45°, and aspiration was performed before injection to check for inadvertent vascular entry. The injection site was visually monitored during and immediately after administration for leakage, bleeding, or other visible complications. All oral gavage and intraperitoneal injection procedures were performed by the same investigator using a standardized technique.
Treatment administrations were repeated at the same scheduled time on days 9 and 10. Body weight was measured once at study initiation and was used to calculate the APAP, guarana, and NAC doses and administration volumes for days 8–10. Animals in the APAP + Guarana group received guarana once daily for three consecutive days, animals in the APAP + NAC group received NAC once daily for three consecutive days, and animals in the APAP + NAC + Guarana group received both treatments according to the same schedule. The overall experimental design, treatment schedule, and timing of sample collection are summarized in Figure 1.
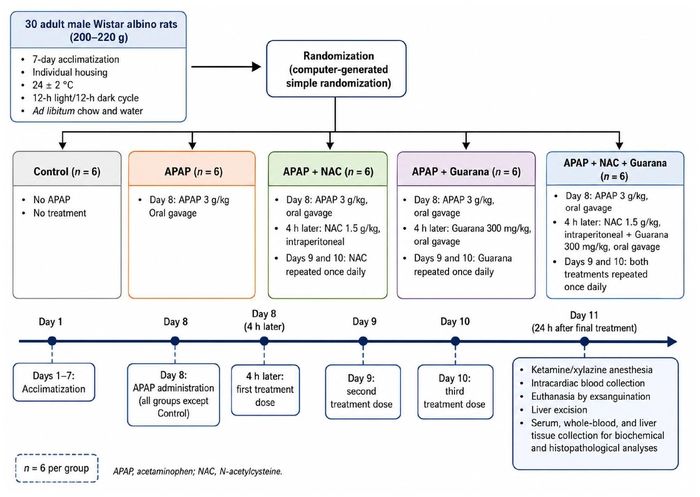
Figure 1: Experimental design, treatment schedule, and sample collection workflow. Thirty male Wistar rats were randomly allocated to five experimental groups (n = 6 per group). Following a 7-day acclimatization period, all animals except those in the Control group received a single oral dose of APAP (3 g/kg) on day 8. Four hours after APAP administration, NAC (1.5 g/kg, intraperitoneally), guarana (300 mg/kg, orally), or their combination was administered according to group allocation. Treatments were repeated on days 9 and 10. On day 11, animals were anesthetized, blood samples were collected, and liver tissues were obtained for biochemical and histopathological analyses. APAP, acetaminophen; NAC, N-acetylcysteine. Please click here to view a larger version of this figure.
4. Euthanasia procedure, humane endpoints, and sample collection
Throughout the experimental period, all animals were monitored daily for general health status, feeding behavior, locomotor activity, and water consumption. Humane endpoint criteria were predefined as marked lethargy, inability to consume food or water, severe weight loss, abnormal posture, impaired mobility, or evident signs of distress. Animals meeting any of these criteria were scheduled for humane euthanasia. No animals reached the predefined humane endpoint criteria during the study.
Twenty-four hours after the final treatment administration, on day 11, all animals were deeply anesthetized by intraperitoneal administration of ketamine (80 mg/kg) and xylazine (10 mg/kg). Adequate anesthesia was confirmed by the absence of the pedal withdrawal reflex. Following confirmation of deep anesthesia, approximately 3–5 mL of blood was collected by intracardiac puncture using a 5 mL syringe fitted with a 25-gauge needle. Euthanasia was subsequently performed by exsanguination under deep anesthesia.
Blood samples intended for biochemical analyses were transferred into anticoagulant-free serum tubes, whereas samples intended for glutathione analysis were collected into EDTA-containing tubes. Blood collected in anticoagulant-free tubes was allowed to clot completely at room temperature before centrifugation. Samples were centrifuged at 3,000 × g for 10–15 min at 4 °C. The serum fraction was carefully separated, transferred into individually labeled tubes, and stored at −80 °C until analysis. Adequate serum separation was verified by the presence of clear, non-hemolyzed serum.
Following blood collection, a median laparotomy was performed, and the liver was carefully excised. Surrounding adipose and connective tissues were removed, and the liver samples were divided for histopathological and biochemical analyses. Samples intended for histopathological examination were fixed in 10% neutral buffered formalin. Samples intended for biochemical analysis were appropriately labeled and stored at −80 °C until further processing.
Group allocation was known to the investigator administering the interventions. Biochemical measurements, histopathological evaluation, and statistical analyses were performed using coded identifiers by investigators blinded to group allocation. No animals were excluded from the analyses. Acetaminophen powder, formalin, xylene, biological specimens, and animal tissues were handled using appropriate personal protective equipment, including gloves, laboratory coats, and eye protection. Procedures involving hazardous chemicals and biological materials were conducted according to institutional laboratory safety guidelines and local regulations. Biological specimens, animal tissues, and chemical waste were disposed of according to institutional biosafety and hazardous-waste procedures.
5. Biochemical analysis
Serum markers of hepatocellular injury, circulating oxidative stress and antioxidant status, and hepatic inflammatory responses were evaluated. Serum aspartate aminotransferase (AST), alanine aminotransferase (ALT), and alkaline phosphatase (ALP) activities were measured using colorimetric assay kits on an automated chemistry analyzer according to the manufacturers’ instructions.
For hepatic inflammatory-marker measurements, approximately 50 mg of liver tissue was obtained from samples stored at −80 °C. Each sample was homogenized in 500 µL of RIPA buffer containing a protease inhibitor cocktail. The homogenates were centrifuged at 14,000 × g for 10 min at 4 °C, and the resulting supernatants were collected for TNF-α and IL-1β measurements. Serum superoxide dismutase (SOD) activity was measured colorimetrically. The assay was based on the generation of superoxide radicals by the xanthine–xanthine oxidase system and their reaction with 2-(4-iodophenyl)-3-(4-nitrophenyl)-5-phenyltetrazolium chloride to form a colored formazan product. Endpoint absorbance was measured at 505 nm, and SOD activity was expressed as U/mL.
Serum malondialdehyde (MDA) concentration was determined using the thiobarbituric acid reaction. Serum samples were mixed with cold trichloroacetic acid to precipitate proteins and centrifuged at 7,500 × g for 5 min at 4 °C. The resulting supernatant was reacted with thiobarbituric acid at 90 °C for 60 min, cooled, and measured at 532 nm. MDA concentrations were calculated from the corresponding calibration curve and expressed as nmol/mL. Reduced glutathione (GSH) levels were measured in EDTA-anticoagulated whole blood using a modified Ellman colorimetric method. Proteins were precipitated with trichloroacetic acid, and the deproteinized samples were combined with 5,5′-dithiobis(2-nitrobenzoic acid) in 500 mM Tris buffer at pH 8.2. The colored reaction product was measured at 412 nm, and GSH levels were expressed as mmol/L.
Serum catalase (CAT) activity was measured using a two-step colorimetric assay. Serum samples were incubated with a known amount of hydrogen peroxide, which was decomposed by catalase into water and molecular oxygen. After the enzymatic reaction was terminated, the remaining hydrogen peroxide was quantified using a chromogenic reagent. Absorbance was measured at 405 nm, and CAT activity was expressed as U/mL. CAT measurements were performed in duplicate, and the mean of the two technical replicates was used as the animal-level value for statistical analysis. Hepatic TNF-α and IL-1β concentrations were measured in liver tissue homogenate supernatants using rat-specific enzyme-linked immunosorbent assay (ELISA) kits according to the manufacturers’ protocols. For each animal, approximately 50 mg of liver tissue was homogenized in 500 µL of RIPA buffer containing a protease inhibitor cocktail, corresponding to a tissue-to-buffer ratio of 1:10 (w/v). The homogenates were centrifuged at 14,000 × g for 10 min at 4 °C, and the resulting supernatants were collected separately without pooling samples from different animals.
Before analysis, all reagents, standards, controls, and liver tissue homogenate supernatants were allowed to reach room temperature. Standards, controls, and tissue supernatants were added to the designated antibody-precoated wells, followed by the corresponding biotinylated detection antibody and streptavidin–horseradish peroxidase conjugate. Samples and assay reagents were incubated for 1 h at 37 °C. After five washing cycles, substrate solutions A and B were added and incubated for 10 min at 37 °C. The color reaction was terminated using the acidic stop solution, and absorbance was measured at 450 nm. TNF-α and IL-1β concentrations were calculated from the corresponding standard curves.
All samples were analyzed in duplicate, and the mean of the two technical replicate wells was used as the single animal-level value for statistical analysis. Technical replicate wells were not considered independent observations. Serum, EDTA-anticoagulated whole blood, and liver tissue samples obtained from each animal were processed and analyzed separately, and samples from different animals were not pooled. Separate aliquots and technical replicate measurements obtained from the same animal were treated as within-animal measurements. The individual animal was considered the experimental unit; therefore, six independent animal-level observations were included in each experimental group.
6. Histopathological processing and scoring
Liver tissue specimens were fixed in 10% neutral buffered formalin for 72 h at room temperature. Following fixation, the specimens were washed under running tap water and dehydrated through graded ethanol concentrations of 50%, 70%, 80%, 96%, and 100% for 1 h at each concentration. Sections of 5 µm thickness were obtained using a rotary microtome and mounted on poly-L-lysine-coated glass slides. For hematoxylin and eosin (H&E) staining, paraffin sections were deparaffinized in xylene and rehydrated through descending ethanol concentrations of 100%, 96%, 80%, 70%, and 50%, followed by a water rinse. Sections were stained with hematoxylin for 5 min and washed under running tap water for 5 min. Differentiation was performed using acid alcohol, followed by bluing in ammonia water for 1 min. Sections were then counterstained with eosin for 2 min, dehydrated through ascending ethanol concentrations, cleared in xylene, and mounted using a synthetic mounting medium.
Successful H&E staining was verified by clear nuclear staining, distinct cytoplasmic contrast, and adequate preservation of hepatic tissue architecture. All H&E-stained sections were evaluated under standardized conditions using a light microscope equipped with a digital imaging system.
All histopathological examinations were performed by a single investigator experienced in histological evaluation who was blinded to experimental group allocation. Liver sections were evaluated for hepatocellular necrosis, cellular swelling, vacuolar degeneration, sinusoidal congestion, inflammatory cell infiltration, and disruption of hepatic tissue architecture. Histopathological changes were assessed using a semi-quantitative scoring system. Each parameter was scored on a scale from 0 – 4, where 0 indicated absence, 1 minimal, 2 mild, 3 moderate, and 4 severe involvement.
For each animal, three H&E-stained liver sections were examined. Five microscopic fields were randomly selected from each section and evaluated using a 40× objective, resulting in 15 microscopic fields per animal. The fields were selected from comparable regions of the hepatic parenchyma, and the same objective and standardized evaluation conditions were used across all animals and experimental groups.
After all 15 fields had been examined, the field exhibiting the most pronounced overall tissue injury was used as the reference field for semi-quantitative scoring. A single score from 0 – 4 was assigned to each histopathological parameter for each animal. Histological sections and microscopic fields were treated as within-animal subsamples and were not considered independent observations. The individual animal was considered the experimental unit; therefore, six independent animal-level observations were included in each experimental group. Representative H&E-stained photomicrographs were acquired at a total magnification of ×200, and a 200 µm scale bar was included in each image. These photomicrographs were obtained for illustrative purposes and were not treated as independent observations in the histopathological scoring or statistical analyses. The total liver injury score for each animal was calculated by summing the scores assigned to the six evaluated histopathological parameters. Histopathological assessment and semi-quantitative scoring were guided by the criteria described by Kleiner et al. and Jamshidzadeh et al.24˒25.
7. Statistical analysis
Normality of continuous variables was assessed using the Shapiro–Wilk test and Q–Q plots, and homogeneity of variances was evaluated using Levene’s test. Normally distributed continuous variables were presented as mean ± standard deviation, whereas variables that did not meet the assumptions of parametric testing were presented as median and interquartile range [median (IQR)]. Variables satisfying the assumptions of normality and homogeneity of variances were compared among experimental groups using one-way analysis of variance (ANOVA). When the overall ANOVA result was statistically significant, all pairwise comparisons were performed using Tukey’s significant difference (Tukey HSD) post hoc test.
Variables that did not meet the assumptions of parametric testing were compared among groups using the Kruskal–Wallis test. The ordinal histopathological scores, including the six individual parameter scores and the total liver injury score, were summarized as median (first quartile–third quartile) and analyzed using the Kruskal–Wallis test. When the overall test was statistically significant, pairwise comparisons were performed using Dunn’s test with Holm correction for multiple comparisons. All statistical tests were two-sided, and P < 0.05 was considered statistically significant.
النتائج
Serum markers of hepatic injury (AST, ALT, and ALP)
Serum AST, ALT, and ALP activities differed significantly among the experimental groups (P < 0.001, P < 0.001, and P = 0.004, respectively; Table 1). Serum AST activity was significantly higher in the APAP group than in the Control, APAP + NAC, and APAP + NAC + Guarana groups. AST activity in the APAP + Guarana group was also significantly higher than that in the Control group (Tukey HSD, P < 0.05).
Serum ALT activity was significantly higher in the APAP group than in the Control, APAP + NAC, and APAP + NAC + Guarana groups. ALT activity was also significantly higher in the APAP + Guarana group than in the Control and APAP + NAC + Guarana groups, whereas the APAP + NAC group showed significantly higher ALT activity than the Control group (Tukey HSD, P < 0.05). Serum ALP activity was significantly higher in the APAP group than in the Control and APAP + NAC + Guarana groups (Dunn–Holm; PHolm = 0.004 and PHolm = 0.015, respectively). No other pairwise differences in ALP activity reached statistical significance after Holm correction.
Circulating oxidative stress and antioxidant defense parameters
Significant differences among the experimental groups were observed in MDA and GSH levels and in CAT and SOD activities (P = 0.005, P = 0.027, P < 0.001, and P = 0.002, respectively; Table 2). MDA levels were significantly higher in the APAP group than in the Control and APAP + NAC + Guarana groups. The Holm-adjusted P values were 0.010 for the comparison between the Control and APAP groups and 0.030 for the comparison between the APAP + NAC + Guarana and APAP groups. Although GSH levels differed significantly among the groups overall, the only significant pairwise difference was between the Control and APAP + Guarana groups, with lower GSH levels in the APAP + Guarana group (PHolm = 0.039).
Serum CAT activity differed significantly among the experimental groups (P < 0.001; Table 2). CAT activity was significantly higher in the APAP group [median (IQR), 552.76 (337.92) U/mL] than in the Control group [28.76 (31.15) U/mL; PHolm < 0.001] and the APAP + NAC + Guarana group [39.31 (28.64) U/mL; PHolm < 0.001]. Median CAT activities in the APAP + NAC [205.67 (116.71) U/mL] and APAP + Guarana [204.46 (82.06) U/mL] groups were numerically lower than that in the APAP group; however, these pairwise differences were not statistically significant after Holm correction. No other pairwise comparisons reached statistical significance. SOD activity was significantly lower in the APAP and APAP + Guarana groups than in the Control group (Tukey HSD, P < 0.05). No other pairwise differences in the evaluated oxidative stress and antioxidant defense parameters reached statistical significance.
Hepatic inflammatory markers (TNF-α and IL-1β)
Hepatic TNF-α and IL-1β levels differed significantly among the experimental groups (both P < 0.001; Table 3). TNF-α levels were significantly higher in the APAP group than in the Control and APAP + NAC + Guarana groups (Dunn–Holm; PHolm < 0.001 for both comparisons). No other pairwise differences in TNF-α levels reached statistical significance after Holm correction. IL-1β levels were significantly higher in the APAP group than in the Control, APAP + NAC, and APAP + NAC + Guarana groups. In addition, the APAP + Guarana group had significantly higher IL-1β levels than the Control and APAP + NAC + Guarana groups (Tukey HSD, P < 0.05). No significant difference in IL-1β levels was detected between the APAP and APAP + Guarana groups.
Histopathological Findings
Qualitative histopathological findings
Histopathological examination of H&E-stained liver sections revealed distinct morphological differences among the experimental groups (Figure 2). Liver sections from the Control group exhibited preserved lobular architecture, regularly arranged hepatocyte cords extending from the central vein toward the periphery, and normal sinusoidal structures (Figure 2A).
In the APAP group, marked histopathological alterations were observed, particularly in the centrilobular regions. These changes included extensive hepatocellular swelling, prominent vacuolar degeneration, sinusoidal congestion, inflammatory cell infiltration, disruption of the hepatic lobular architecture, and widespread foci of hepatocellular necrosis (Figure 2B). Liver sections from the APAP + Guarana group showed less extensive histopathological injury than those from the APAP group. Moderate hepatocellular swelling and vacuolar degeneration remained evident, whereas sinusoidal congestion and inflammatory changes were relatively mild. Centrilobular necrotic foci were smaller and less extensive than those observed in the APAP group (Figure 2C).
In the APAP + NAC group, hepatic lobular architecture was largely preserved. Hepatocellular swelling, vacuolar degeneration, and centrilobular necrosis were minimal, whereas sinusoidal congestion, inflammatory cell infiltration, and architectural disruption were not evident in the representative sections (Figure 2D). The APAP + NAC + Guarana group exhibited a histological appearance closely resembling that of the Control group. Hepatocyte cord organization and lobular architecture were preserved, and none of the evaluated histopathological abnormalities were evident in the representative sections (Figure 2E).
Semi-quantitative histopathological scoring
Semi-quantitative histopathological scores differed significantly among the experimental groups for hepatocellular necrosis (H = 27.046, P < 0.001), cellular swelling (H = 27.046, P < 0.001), vacuolar degeneration (H = 26.027, P < 0.001), sinusoidal congestion (H = 26.488, P < 0.001), inflammatory cell infiltration (H = 26.488, P < 0.001), architectural disruption (H = 26.488, P < 0.001), and total liver injury score (H = 28.384, P < 0.001; Table 4). The APAP group had the highest median total liver injury score [20.00 (19.25–20.75)], whereas the corresponding values were 9.00 (8.25–9.75) in the APAP + Guarana group, 3.00 (3.00–3.00) in the APAP + NAC group, and 0.00 (0.00–0.00) in both the Control and APAP + NAC + Guarana groups.
Dunn’s post hoc tests with Holm correction showed that all six individual histopathological scores and the total liver injury score were significantly higher in the APAP group than in the Control and APAP + NAC + Guarana groups (all adjusted P < 0.001). Sinusoidal congestion, inflammatory cell infiltration, and architectural disruption scores were also significantly higher in the APAP group than in the APAP + NAC group (all adjusted P < 0.001). The APAP + Guarana group had significantly higher hepatocellular necrosis and cellular swelling scores than the Control and APAP + NAC + Guarana groups (adjusted P = 0.037 for each comparison), higher vacuolar degeneration scores than these two groups (adjusted P = 0.021 for each comparison), and a higher total liver injury score than these two groups (adjusted P = 0.018 for each comparison). No other pairwise comparisons remained statistically significant after Holm correction.
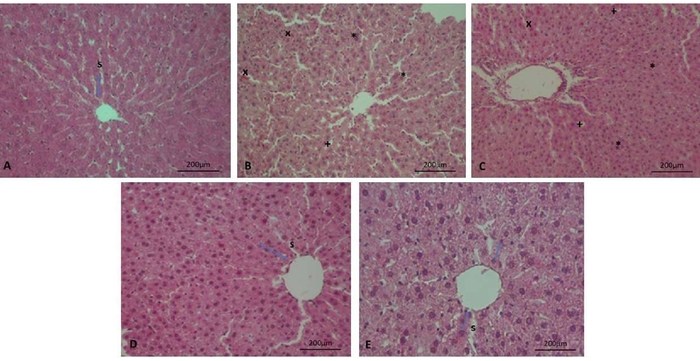
Figure 2: Representative histopathological findings in liver tissues from the experimental groups. Representative hematoxylin and eosin-stained liver sections are shown. (A) Control group: hepatic lobular architecture was preserved, with regularly arranged hepatocyte cords and normal sinusoidal structures. (B) APAP group: widespread hepatocellular swelling (*), prominent vacuolar degeneration (+), sinusoidal congestion (×), and disruption of the hepatic lobular architecture were observed. (C) APAP + Guarana group: moderate hepatocellular swelling (*) and vacuolar degeneration (+), together with mild sinusoidal congestion (×), were observed. (D) APAP + NAC group: hepatic lobular architecture was largely preserved, with only mild hepatocellular changes. (E) APAP + NAC + Guarana group: APAP-induced histopathological alterations were markedly reduced, and the overall tissue appearance was close to that of the Control group. Blue double-headed arrows indicate hepatocyte cords; s, sinusoidal structures; *, hepatocellular swelling; +, vacuolar degeneration; ×, sinusoidal congestion. H&E, hematoxylin and eosin; APAP, acetaminophen; NAC, N-acetylcysteine. Original magnification, ×200; scale bar = 200 µm. Please click here to view a larger version of this figure.
| Parameter (U/L) | Control | APAP | APAP + NAC | APAP + Guarana | APAP + NAC + Guarana | Overall p | Post-hoc analysis |
| AST | 123.22 ± 37.96a | 287.28 ± 70.34c | 167.26 ± 37.27ab | 209.40 ± 53.36bc | 133.71 ± 47.67ab | <0.001 | Tukey HSD; see superscript letters |
| ALT | 70.66 ± 10.77a | 162.92 ± 25.97d | 111.79 ± 31.37bc | 127.10 ± 28.55cd | 83.23 ± 14.06ab | <0.001 | Tukey HSD; see superscript letters |
| ALP | 185.60 (140.33) | 340.65 (47.45) | 242.24 (27.10) | 241.81 (74.72) | 189.55 (155.91) | 0.004 | Control vs APAP: pHolm = 0.004; APAP + NAC + Guarana vs APAP: pHolm = 0.015 |
Table 1: Comparison of serum AST, ALT, and ALP activities among the experimental groups.
Data are presented as mean ± standard deviation for AST and ALT and as median (interquartile range) for ALP. AST and ALT were compared using one-way analysis of variance, followed by Tukey’s test for significant differences. Within the same row, groups that do not share a common superscript letter differ significantly at P < 0.05. ALP was compared using the Kruskal–Wallis test followed by Dunn’s pairwise test with Holm correction. APAP, acetaminophen; ALP, alkaline phosphatase; ALT, alanine aminotransferase; AST, aspartate aminotransferase; NAC, N-acetylcysteine.
| Parameter | Control | APAP | APAP + NAC | APAP + Guarana | APAP + NAC + Guarana | Overall p | Post-hoc analysis |
| MDA (nmol/mL) | 12.30 (3.49) | 35.45 (43.30) | 13.99 (13.40) | 21.62 (18.09) | 13.36 (3.79) | 0.005 | Control vs APAP: p_Holm = 0.010; APAP + NAC + Guarana vs APAP: p_Holm = 0.030 |
| GSH (mmol/L) | 1.34 (0.34) | 1.08 (0.02) | 1.08 (0.06) | 1.06 (0.07) | 1.09 (0.11) | 0.027 | Control vs APAP + Guarana: p_Holm = 0.039 |
| CAT (U/mL) | 28.76 (31.15) | 552.76 (337.92) | 205.67 (116.71) | 204.46 (82.06) | 39.31 (28.64) | < 0.001 | Control vs APAP: p_Holm < 0.001; APAP + NAC + Guarana vs APAP: p_Holm < 0.001 |
| SOD (U/mL) | 244.88 ± 29.42a | 127.33 ± 46.40b | 178.43 ± 66.39ab | 128.45 ± 53.01b | 170.96 ± 35.09ab | 0.002 | Tukey HSD; see superscript letters |
Table 2: Comparison of circulating oxidative stress and antioxidant defense parameters among the experimental groups. Data are presented as median (interquartile range) for MDA, GSH, and CAT and as mean ± standard deviation for SOD. MDA, GSH, and CAT were compared using the Kruskal–Wallis test followed by Dunn’s pairwise test with Holm correction. SOD activity was compared using a one-way analysis of variance, followed by Tukey’s test for significant differences. Holm-adjusted P values for statistically significant pairwise comparisons are presented in the post hoc analysis column. Within the SOD row, groups that do not share a common superscript letter differ significantly at P < 0.05, whereas groups sharing at least one superscript letter do not differ significantly. APAP, acetaminophen; CAT, catalase; GSH, reduced glutathione; MDA, malondialdehyde; NAC, N-acetylcysteine; SOD, superoxide dismutase.
| Experimental group | TNF-α (ng/L) | IL-1β (ng/mL) |
| Control | 107.86 (81.77)a | 5.69 ± 2.24a |
| APAP | 207.10 (27.44)b | 14.51 ± 2.54c |
| APAP + NAC | 165.10 (17.91)ab | 9.52 ± 2.75ab |
| APAP + Guarana | 166.16 (23.66)ab | 10.46 ± 2.83bc |
| APAP + NAC + Guarana | 133.73 (72.30)a | 6.00 ± 2.17a |
| Overall p | < 0.001 | < 0.001 |
Table 3: Comparison of hepatic inflammatory markers among the experimental groups.
TNF-α data are presented as median (interquartile range), whereas IL-1β data are presented as mean ± standard deviation. TNF-α levels were compared using the Kruskal–Wallis test followed by Dunn’s pairwise test with Holm correction. IL-1β levels were compared using one-way analysis of variance followed by Tukey’s significant difference test. Within each column, groups that do not share a common superscript letter differ significantly at P < 0.05. APAP, acetaminophen; IL-1β, interleukin-1 beta; NAC, N-acetylcysteine; TNF-α, tumor necrosis factor alpha.
| Histopathological parameter | Control | APAP | APAP + NAC | APAP + Guarana | APAP + NAC + Guarana | H | P value |
| Hepatocellular necrosis | 0.00 (0.00–0.00)a | 4.00 (4.00–4.00)b | 1.00 (1.00–1.00)ab | 2.00 (2.00–2.00)b | 0.00 (0.00–0.00)a | 27.046 | <0.001 |
| Cellular swelling | 0.00 (0.00–0.00)a | 4.00 (4.00–4.00)b | 1.00 (1.00–1.00)ab | 2.00 (2.00–2.00)b | 0.00 (0.00–0.00)a | 27.046 | <0.001 |
| Vacuolar degeneration | 0.00 (0.00–0.00)a | 3.00 (3.00–3.00)b | 1.00 (1.00–1.00)ab | 2.00 (2.00–2.00)b | 0.00 (0.00–0.00)a | 26.027 | <0.001 |
| Sinusoidal congestion | 0.00 (0.00–0.00)a | 3.00 (3.00–3.00)b | 0.00 (0.00–0.00)a | 1.00 (1.00–1.00)ab | 0.00 (0.00–0.00)a | 26.488 | <0.001 |
| Inflammatory cell infiltration | 0.00 (0.00–0.00)a | 3.00 (3.00–3.00)b | 0.00 (0.00–0.00)a | 1.00 (1.00–1.00)ab | 0.00 (0.00–0.00)a | 26.488 | <0.001 |
| Architectural disruption | 0.00 (0.00–0.00)a | 3.00 (3.00–3.00)b | 0.00 (0.00–0.00)a | 1.00 (1.00–1.00)ab | 0.00 (0.00–0.00)a | 26.488 | <0.001 |
| Total liver injury score | 0.00 (0.00–0.00)a | 20.00 (19.25–20.75)b | 3.00 (3.00–3.00)ab | 9.00 (8.25–9.75)b | 0.00 (0.00–0.00)a | 28.384 | <0.001 |
| Note: Data are presented as median (first quartile–third quartile) for six animals in each experimental group. Overall group comparisons were performed using the Kruskal–Wallis test. Following a significant overall test, pairwise comparisons were conducted using Dunn’s test with Holm correction. Within each row, groups that do not share a common superscript letter differ significantly at Holm-adjusted P < 0.05, whereas groups sharing at least one superscript letter do not differ significantly. Histopathological parameters were scored from 0 to 4, where 0 indicated absence, 1 minimal, 2 mild, 3 moderate, and 4 severe involvement. The total liver injury score was calculated for each animal as the sum of the six individual parameter scores. H, Kruskal–Wallis test statistic; APAP, acetaminophen; NAC, N-acetylcysteine. | |||||||
Table 4: Semi-quantitative histopathological scores of liver injury among the experimental groups. Data are presented as median (first quartile–third quartile) for six animals in each experimental group. Overall group comparisons were performed using the Kruskal–Wallis test. Following a significant overall test, pairwise comparisons were conducted using Dunn’s test with Holm correction. Within each row, groups that do not share a common superscript letter differ significantly at Holm-adjusted P < 0.05, whereas groups sharing at least one superscript letter do not differ significantly. Histopathological parameters were scored on a scale from 0–4, where 0 indicated absence, 1 minimal, 2 mild, 3 moderate, and 4 severe involvement. For each animal, the total liver injury score was calculated as the sum of the six individual parameter scores. H, Kruskal–Wallis test statistic; APAP, acetaminophen; NAC, N-acetylcysteine.
DATA AVAILABILITY:
The supporting and underlying raw data are present in Supplementary File 1.
Supplementary File 1: The underlying raw data for the protocol. Please click here to download this file.
المناقشة
This study examined the post-exposure effects of NAC and guarana, administered separately or together, in Wistar rats with acute APAP-induced hepatotoxicity. APAP produced a clear hepatic injury profile characterized by increased serum liver enzyme activities, lipid peroxidation, serum CAT activity, hepatic pro-inflammatory cytokines, reduced SOD activity, and extensive centrilobular damage. NAC monotherapy improved selected biochemical and inflammatory outcomes and significantly reduced sinusoidal congestion, inflammatory cell infiltration, and architectural disruption relative to APAP. Guarana monotherapy showed lower median histopathological scores than APAP, but none of the histopathological pairwise comparisons between these groups remained significant after Holm correction. The combined regimen produced the broadest treatment-associated response and significantly lower histopathological scores than APAP across all evaluated parameters. However, these findings do not establish pharmacological synergy or consistent superiority over NAC because formal interaction testing was not performed. A key distinction of this model is that guarana administration began 4 h after APAP exposure, whereas a previous rat study evaluated guarana as a preventive treatment before intoxication16.
The untreated APAP group showed higher AST, ALT, ALP, CAT, MDA, TNF-α, and IL-1β levels, reduced SOD activity, and extensive centrilobular necrotic and degenerative changes. Rats are less susceptible to APAP hepatotoxicity than commonly used mouse strains and do not reproduce all mechanistic features observed in susceptible mice or humans; therefore, the Wistar rat model should be regarded as a controlled preclinical platform rather than a direct surrogate for human overdose1˒5. The 3 g/kg APAP dose should likewise be interpreted as a high experimental challenge dose rather than a clinically equivalent exposure. Similar doses have been used to generate hepatic injury in Wistar rat studies evaluating guarana and other plant-derived interventions16˒26. NAC monotherapy was associated with lower AST and ALT activities than untreated APAP exposure, whereas the combined regimen showed lower AST, ALT, and ALP activities than the APAP group. Guarana monotherapy showed no significant reduction in these enzymes. This differs from the reductions reported when guarana was administered before APAP exposure16. Comparable improvement in hepatic enzymes has also been reported when NAC-based treatment was initiated after APAP administration27. Because serum transaminase concentrations vary with the extent of necrosis and sampling time, these findings should be interpreted together with the tissue findings28.
The redox and inflammatory responses were not uniform across outcomes. Serum MDA was significantly lower in the combined-treatment group than in the untreated APAP group, while CAT activity shifted toward the Control value. However, because CAT was measured in serum rather than liver tissue, this finding should not be interpreted as direct restoration of hepatic antioxidant capacity. SOD activity was lower in the APAP and APAP + Guarana groups than in the Control group, but neither NAC nor the combined regimen produced a statistically confirmed increase relative to untreated APAP exposure. Studies using liver homogenates have reported reductions in MDA together with increases in SOD and GSH after antioxidant treatment, but these tissue-specific findings cannot be transferred directly to circulating measurements26. Likewise, hepatic GSH preservation reported after preventive guarana administration was measured in liver tissue rather than whole blood16. Guarana has documented radical-scavenging activity related to tannin- and proanthocyanidin-rich fractions, although this did not translate into significant improvement in the measured redox variables when administered alone after APAP exposure19. APAP exposure also produced marked increases in TNF-α and IL-1β, consistent with previous high-dose paracetamol rat models26. NAC significantly reduced IL-1β, whereas the combined regimen was associated with lower concentrations of both cytokines than APAP alone. Guarana monotherapy did not differ significantly from untreated APAP animals for either cytokine. Experimental evidence supports anti-inflammatory effects of guarana constituents in other systems, but these findings provide mechanistic context rather than direct evidence of efficacy in acute APAP toxicity19˒29. Reductions in inflammatory mediators have also accompanied tissue protection in studies of other adjunctive treatments after APAP exposure30.
Histopathological findings were consistent with the characteristic centrilobular pattern of APAP hepatotoxicity2. Nonparametric analysis demonstrated significant overall group differences for all six histopathological parameters and the total liver injury score. APAP produced significantly greater injury than the Control group across all evaluated outcomes. The APAP + NAC + Guarana group had significantly lower scores than the APAP group for every individual parameter and the total injury score. NAC monotherapy significantly reduced sinusoidal congestion, inflammatory cell infiltration, and architectural disruption relative to APAP; however, its lower necrosis, cellular swelling, vacuolar degeneration, and total injury scores did not remain statistically significant after Holm correction. Similarly, although guarana monotherapy had numerically lower median scores than APAP, none of these pairwise differences reached statistical significance after multiplicity correction. Guarana scores for necrosis, cellular swelling, vacuolar degeneration, and total injury nevertheless remained significantly higher than those in the Control and combined-treatment groups. Thus, the histopathological analysis supports a treatment-associated benefit of the combined regimen but does not establish a statistically significant protective effect of guarana monotherapy relative to untreated APAP exposure. A previous Wistar rat study reported reduced necrotic area after guarana treatment, although guarana was administered before APAP exposure16. Differences between serum indices and tissue morphology may reflect the different kinetics of biochemical and histological injury during the injury and recovery phases28. Similar differences between serum and microscopic findings have been reported in Wistar rats treated with NAC and CoQ10 after paracetamol intoxication31. Overall, NAC produced a broader response than guarana monotherapy, while the combined regimen showed the widest cross-domain response. The known antioxidant and hepatoprotective properties of guarana constituents do not establish that these effects remain equally effective when treatment begins after APAP metabolism and cellular injury have progressed19˒32. Experimental combinations of NAC with CoQ10 or leuco-methylene blue have likewise shown broader response patterns without consistently demonstrating superiority over monotherapy30˒31.
Successful implementation of this model depended on consistency in suspension preparation, dosing, treatment timing, sample processing, and histopathological assessment. Continuous stirring of the APAP suspension and repeated mixing of the guarana suspension were important for limiting sedimentation and dose variability. Accurate body-weight-based dosing and consistent maintenance of the 4 h interval between APAP exposure and treatment were also important. During sample processing, hemolysis, delayed centrifugation, interruption of the cold chain, inconsistent tissue-to-buffer ratios, and variation in ELISA or histopathological procedures could introduce technical variability. Compared with previous experimental approaches, this protocol differed by initiating treatment 4 h after APAP exposure and repeating treatment over three days. The most closely related guarana study used the same 300 mg/kg guarana dose and 3 g/kg APAP challenge but evaluated preventive administration16. Other Wistar rat studies have initiated NAC-containing treatments within 1–3 h and collected samples within 24 h30˒31. The present protocol, therefore, provided a structured framework for comparing post-exposure interventions across biochemical, redox, inflammatory, and histopathological outcomes.
Several limitations should be considered. Wistar rats are relatively resistant to APAP hepatotoxicity, and the high challenge dose limits direct clinical extrapolation1˒5. The use of six male animals per group limited assessment of smaller treatment differences and sex-related variability. All outcomes were measured at a single terminal time point, although APAP metabolism, GSH depletion, inflammation, necrosis, and recovery evolve over time2˒28. Whole-blood GSH and serum MDA, SOD, and CAT also provide limited information regarding intrahepatic antioxidant status. CYP2E1 activity, APAP–protein adducts, mitochondrial function, Nrf2-related signaling, and tissue concentrations of NAC or guarana constituents were not assessed. In addition, the phytochemical composition of the guarana preparation was not independently quantified, although constituent concentrations may vary according to genotype, origin, processing, and extraction conditions29˒33. The absence of NAC-only and guarana-only groups, the relatively large NAC injection volume, the absence of a volume-matched intraperitoneal vehicle-Control group, and selection of the most severely affected field for histopathological scoring represent additional limitations. The study was also not designed as a factorial experiment and did not include formal interaction testing. Future studies should therefore incorporate earlier and later sampling, liver-specific mechanistic measurements, chemically characterized and batch-standardized guarana preparations, both sexes, larger group sizes, appropriate treatment controls, and prespecified interaction testing2˒9˒29˒33. Until such evidence is available, these findings support further investigation of guarana as a possible adjunct to NAC rather than establishing guarana monotherapy, superiority of the combination, or pharmacological synergy.
Conclusion
The present study demonstrated distinct post-exposure responses to NAC and guarana in Wistar rats with acute APAP-induced hepatotoxicity. NAC improved selected biochemical and inflammatory outcomes and significantly reduced selected histopathological scores. Guarana monotherapy had numerically lower histopathological scores than APAP, but the corresponding pairwise differences were not statistically significant after Holm correction. The combined regimen showed the broadest treatment-associated response and significantly lower histopathological injury than APAP across all evaluated parameters; however, consistent superiority over NAC and pharmacological synergy were not established. Further studies using standardized guarana preparations, liver-specific mechanistic measurements, and formal interaction analyses are required to determine its potential role as an adjunct to NAC after APAP exposure.
الإفصاحات
The authors declare that they have no competing interests. During the preparation of this manuscript, AI-assisted tools were used solely for language editing and grammar correction. No artificial intelligence tools were used for the generation, analysis, or interpretation of data, nor for the creation of any figures or graphical elements.
Author contribution:
Yahya Sahin, Canan Sahin, and Ozlem Kara contributed to the conception and design of the study. Yahya Sahin performed the experimental procedures and data collection. Ozlem Kara conducted the histopathological examinations. Yahya Sahin and Canan Sahin performed the statistical analysis and interpreted the data. Yahya Sahin drafted the manuscript. All authors critically revised the manuscript and approved the final version
شكر وتقدير
This study was supported by the Scientific Research Projects Coordination Unit of Kırşehir Ahi Evran University (Project No. PİLOT.TIP.26.25.007). The funding body had no role in the study design, data collection, data analysis, interpretation of the results, or preparation of the manuscript.
المواد
| الاسم | الشركة | رقم فهرسي | التعليقات |
|---|---|---|---|
| 10% Neutral Buffered Formalin | Merck | Not available | Liver tissue fixation for histopathology |
| 25-Gauge Needle | Not available | Not available | Intracardiac blood collection |
| 5 mL Syringe | Not available | Not available | Intracardiac blood collection |
| Acetaminophen (APAP) | Not available | Not available | Hepatotoxicity induction (3 g/kg, oral gavage) |
| Acid Alcohol | Not available | Not available | Differentiation during H&E staining |
| ALP Kit Universal | Otto Scientific | OttoBC124 | Colorimetric measurement of serum ALP activity |
| ALT Kit Universal | Otto Scientific | OttoBC128 | Colorimetric measurement of serum ALT activity |
| Ammonia Water | Not available | Not available | Bluing during H&E staining |
| Anticoagulant-Free Serum Tubes (Red-Top) | Not available | Not available | Blood collection for serum biochemical analyses |
| AST Kit Universal | Otto Scientific | OttoBC127 | Colorimetric measurement of serum AST activity |
| Benchtop Centrifuge | Nüve | NF048 | Sample preparation and centrifugation |
| CAT Kit Universal | Otto Scientific | Otto3051 | Two-step colorimetric measurement of serum catalase activity at 405 nm |
| Digital Homogenizer | Daihan Scientific | HG-15D | Liver tissue homogenization |
| EDTA-Containing Blood Collection Tubes (Purple-Top) | Not available | Not available | Whole-blood collection for GSH analysis |
| ELx50 Auto Strip Washer | Bio-Tek Instruments, USA | ELx50 | Automated ELISA plate washing |
| ELx800 Microplate Reader | Bio-Tek Instruments, USA | ELx800 | ELISA absorbance measurements at 450 nm (RRID: SCR_028651) |
| Eosin Y (Yellowish) | Merck | 1.15935.0025 | Hematoxylin and eosin staining |
| Ethanol (50%, 70%, 80%, 96%, and 100%) | Not available | Not available | Tissue dehydration and section rehydration |
| G*Power | Heinrich Heine University Düsseldorf | N/A | Power-analysis software used for a priori sample-size calculation; version 3.1 |
| GSH Kit Universal | Otto Scientific | Otto3055 | Colorimetric measurement of GSH in EDTA-anticoagulated whole blood |
| Guarana Seed Dry Extract | United States Pharmacopeia (USP) | 1302178 | Oral treatment (300 mg/kg) |
| Harris Hematoxylin Solution | BSLAB | BS-002 | Hematoxylin and eosin staining |
| JASP | University of Amsterdam | N/A | Statistical analysis software; version 0.19.0 |
| Ketamine Hydrochloride (Ketalar) | Pfizer, USA | Not available | General anesthesia before sample collection |
| Light Microscope (Nikon Eclipse) | Nikon | Ni-U | Histopathological examination and imaging (RRID: SCR_024835) |
| Magnetic Stirrer | Not available | Not available | Continuous mixing of the acetaminophen suspension |
| MDA Kit Universal | Otto Scientific | Otto1001 | Colorimetric measurement of MDA in serum |
| Mindray Chemistry Analyzer | Mindray | BS-400 | Colorimetric measurement of serum AST, ALT, ALP, SOD, and CAT activities |
| N-Acetylcysteine Injectable Formulation (300 mg/3 mL) | Not available | Not available | Intraperitoneal treatment (1.5 g/kg) |
| Paraffin Embedding Medium | Not available | Not available | Embedding of fixed liver tissue |
| Poly-L-Lysine-Coated Glass Slides | Not available | Not available | Mounting of 5 µm liver tissue sections |
| Protease Inhibitor Cocktail | Not available | Not available | Protease inhibition during liver tissue homogenization |
| Rat IL-1β ELISA Kit | BT Lab, China | E0119Ra | Measurement of IL-1β in liver tissue homogenate supernatants |
| Rat TNF-α ELISA Kit | BT Lab, China | E0764Ra | Measurement of TNF-α in liver tissue homogenate supernatants |
| RIPA Buffer | Not available | Not available | Preparation of liver tissue homogenates for cytokine analyses |
| Rotary Microtome | Not available | Not available | Preparation of 5 µm paraffin-embedded liver sections |
| SOD Kit Universal | Otto Scientific | Otto3047 | Colorimetric measurement of SOD activity in serum |
| SPSS Statistics | IBM Corp. | N/A | Statistical analysis software; version 29.0 |
| Stainless-Steel Feeding Needle (22-Gauge Oral Gavage Cannula) | Instech Laboratories, USA | Not available | Oral gavage administration |
| Standard Pelleted Rodent Chow (Optima) | Optima, Türkiye | Not available | Standard laboratory diet; lot no. 58931. Nutritional composition: 24% crude protein, 3.94% crude cellulose, 5.08% crude fat, 8.8% crude ash, 1.44% lysine, 0.61% methionine, 1.14% calcium, 0.89% phosphorus, and 0.28% sodium |
| Sterile 0.9% Physiological Saline | Not available | Not available | Vehicle for acetaminophen and guarana preparations |
| Synthetic Mounting Medium | Not available | Not available | Mounting of stained histological sections |
| Vortex Mixer | Not available | Not available | Homogenization of acetaminophen and guarana suspensions |
| Xylene | Not available | Not available | Tissue clearing and section deparaffinization |
| Xylazine Hydrochloride (Rompun) | Bayer, Germany | Not available | General anesthesia before sample collection |
المراجع
- Jaeschke H, Ramachandran A. The role of oxidant stress in acetaminophen-induced liver injury. Curr Opin Toxicol. 2020;20-21:9-14.
- McGill MR, Hinson JA. The development and hepatotoxicity of acetaminophen: reviewing over a century of progress. Drug Metab Rev. 2020;52(4):472-500.
- Bessems JG, Vermeulen NP. Paracetamol (acetaminophen)-induced toxicity: molecular and biochemical mechanisms, analogues and protective approaches. Crit Rev Toxicol. 2001;31(1):55-138.
- Li R, et al. Underlying mechanisms and treatment of acetaminophen-induced liver injury. Mol Med Rep. 2025;31:106. doi:10.3892/mmr.2025.13471.
- Jaeschke H, Xie Y, McGill MR. Acetaminophen-induced liver injury: from animal models to humans. J Clin Transl Hepatol. 2014;2(3):153-161.
- Yan M, Huo Y, Yin S, Hu H. Mechanisms of acetaminophen-induced liver injury and its implications for therapeutic interventions. Redox Biol. 2018;17:274-283.
- Athbhaiya G, Tiwari A, Choudhary R, Samal PK. Pharmacological and toxicological effects of paracetamol: current knowledge and a review. Drug Chem Toxicol. 2026;49(2):404-427.
- Heard KJ. Acetylcysteine for acetaminophen poisoning. N Engl J Med. 2008;359(3):285-292.
- Liao J, et al. Acetaminophen-induced liver injury: molecular mechanism and treatments from natural products. Front Pharmacol. 2023;14:1122632. doi:10.3389/fphar.2023.1122632.
- Jaeschke H, Knight TR, Bajt ML. The role of oxidant stress and reactive nitrogen species in acetaminophen hepatotoxicity. Toxicol Lett. 2003;144(3):279-288.
- Sinaga E, et al. Hepatoprotective effect of Pandanus odoratissimus seed extracts on paracetamol-induced rats. Pharm Biol. 2021;59(1):31-39.
- Coelho AM, et al. Piperine as therapeutic agent in paracetamol-induced hepatotoxicity in mice. Pharmaceutics. 2022;14(9):1800. doi:10.3390/pharmaceutics14091800.
- İçer M, et al. Is montelukast as effective as N-acetylcysteine in hepatic injury due to acetaminophen intoxication in rats? Exp Toxicol Pathol. 2016;68(1):55-59.
- Ahmad MM, Rezk NA, Fawzy A, Sabry M. Protective effects of curcumin and silymarin against paracetamol-induced hepatotoxicity in adult male albino rats. Gene. 2019;712:143966. doi:10.1016/j.gene.2019.143966.
- Schimpl FC, da Silva JF, Gonçalves JFDC, Mazzafera P. Guarana: revisiting a highly caffeinated plant from the Amazon. J Ethnopharmacol. 2013;150(1):14-31.
- Teixeira CD, et al. Preventive treatment with guarana powder (Paullinia cupana) mitigates acute paracetamol-induced hepatotoxicity by modulating oxidative stress. Toxicol Rep. 2025;14:101946. doi:10.1016/j.toxrep.2025.101946.
- Alfino MCZ, et al. Potential of native Brazilian fruits in modulating oxidative stress and inflammation: a focused review. Antioxidants. 2026;15(6):677. doi:10.3390/antiox15060677.
- Salomão-Oliveira A, et al. Benefits and effectiveness of using Paullinia cupana: a review article. J Food Nutr Res. 2018;6(8):497-503.
- Machado KN, et al. TNF-α inhibition, antioxidant effects and chemical analysis of extracts and fraction from Brazilian guarana seed powder. Food Chem. 2021;355:129563. doi:10.1016/j.foodchem.2021.129563.
- Zuanazzi Pasinato A, et al. Guarana, selenium, and L-carnitine supplementation improves the oxidative profile but fails to reduce tissue damage in rats with osteoarthritis. Antioxidants. 2025;14(7):881. doi:10.3390/antiox14070881.
- Mazaleuskaya LL, et al. PharmGKB summary: pathways of acetaminophen metabolism at the therapeutic versus toxic doses. Pharmacogenet Genomics. 2015;25(8):416-426.
- Rumack BH, Bateman DN. Acetaminophen and acetylcysteine dose and duration: past, present and future. Clin Toxicol (Phila). 2012;50:91-98.
- Xia Z, et al. N-acetylcysteine attenuates PKCβ2 overexpression and myocardial hypertrophy in streptozotocin-induced diabetic rats. Cardiovasc Res. 2007;73(4):770-782.
- Kleiner DE, et al. Design and validation of a histological scoring system for nonalcoholic fatty liver disease. Hepatology. 2005;41(6):1313-1321.
- Jamshidzadeh A, et al. Hepatoprotective effects of antioxidants in paracetamol-induced liver injury in rats. Pharmacol Rep. 2013;65(5):1232-1240.
- Bagchi A, et al. Hepatoprotective efficacy of Argemone mexicana L. root in paracetamol-induced hepatotoxicity in a rat model. J Ethnopharmacol. 2025;341:119329. doi:10.1016/j.jep.2025.119329.
- Nili-Ahmadabadi A, et al. Therapeutic potential of N-acetylcysteine immobilized polyrhodanine nanoparticles against acetaminophen-induced acute hepatotoxicity in rats. Chem Biol Drug Des. 2024;103(2):e14430. doi:10.1111/cbdd.14430.
- Dixon MF, et al. Serum transaminase levels after experimental paracetamol-induced hepatic necrosis. Gut. 1975;16(10):800-807.
- Torres EAFS, et al. Effects of the consumption of guarana on human health: a narrative review. Compr Rev Food Sci Food Saf. 2022;21(5):4384-4419. doi:10.1111/1541-4337.13006.
- Efati M, et al. Protective effect of leuco-methylene blue against acetaminophen-induced liver injury: an experimental study. Drug Chem Toxicol. 2025. doi:10.1080/01480545.2025.2485347.
- da Silva RHS, et al. Effects of coenzyme Q10 and N-acetylcysteine on experimental poisoning by paracetamol in Wistar rats. PLoS One. 2023;18(8):e0290268. doi:10.1371/journal.pone.0290268.
- Kober H, et al. Genoprotective and hepatoprotective effects of guarana (Paullinia cupana Mart. var. sorbilis) on CCl₄-induced liver damage in rats. Drug Chem Toxicol. 2016;39(1):48–52. doi:10.3109/01480545.2015.1020546.
- Marques LLM, et al. Paullinia cupana: a multipurpose plant—a review. Rev Bras Farmacogn. 2019;29(1):77–110. doi:10.1016/j.bjp.2018.08.007.