This protocol fabricates open, junction-rich Au nanowire networks from entangled VACNT canopies or CNT buckypaper, optionally inserts an alumina interlayer between Au and CNT, and evaluates concentration-dependent and spatial SERS responses at picomolar concentrations.
مقالة منهجية
Fabrication of Entangled Nanowire-Based Surface-Enhanced Raman Spectroscopy Substrates
في هذه المقالة
ملخص
الملخص
Surface-enhanced Raman spectroscopy (SERS) substrates require both strong electromagnetic enhancement and efficient access of analyte molecules to field-active hotspots. This study reports a protocol for fabricating entangled plasmonic nanowire substrates that address these requirements through an open network of wire-wire junctions. Vertically aligned carbon nanotube (VACNT) canopies and carbon nanotube buckypaper (CNTBP) provide two scaffold geometries in which numerous crossings are formed before metallization. Au deposition converts the CNT scaffolds into junction-rich plasmonic networks, while an optional alumina interlayer separates Au from the conductive CNT scaffold. Successful fabrication requires continuous metal coverage along individual fibers while preserving repeated crossings and open voids. Representative wire diameters were approximately 60 nm for the Au-coated VACNT-canopy network and approximately 25 nm for the CNTBP-based networks. Both architectures produced picomolar-level SERS responses. In the CNTBP comparison, Au/Al2O3/CNTBP showed an operational detection threshold of 50 pM, one decade lower than the 500 pM threshold of Au/CNTBP under identical acquisition conditions. At 5 pM acetaminophen, 83.1% of the responses in a 33 × 33 map of the Au-coated VACNT-canopy network remained within ±30% of the median, with most of the remaining variation arising from sparse high-response positions. The protocol provides two entangled nanowire scaffold routes for constructing open, junction-rich SERS substrates while preserving molecular access to the plasmonic surface.
المقدمة
Surface-enhanced Raman spectroscopy (SERS) requires a substrate to generate strong local electromagnetic fields while maintaining molecular access to the field-active volume. Nanogaps, high-curvature metallic features, and coupled junctions provide strong local enhancement. More broadly, three-dimensional metal-dielectric resonant cavities and patterned graphene structures can engineer plasmonic field confinement and spectral or angular response1,2,3. For SERS, however, field strength alone is insufficient: the measured response also depends on how many active sites lie within the laser-sampled area and how readily molecules can reach them. A densely packed structure may contain strong theoretical hotspots while limiting molecular access, whereas an open structure may expose a large adsorption surface but provide too few strongly coupled sites. The practical design problem is therefore to combine field confinement with molecular accessibility in the same architecture4,5,6.
Three-dimensional SERS substrates create accessible hotspots through different structural mechanisms. Ordered arrays and template-defined structures form nanoscale gaps by controlling particle or wire arrangement and spacing7,8. Porous metals generate field-active sites along internal ligaments and cavities9, whereas colloidal aggregates form them at interparticle gaps10. In each case, the substrate response depends on forming a sufficient population of field-active sites while keeping those sites accessible to analyte molecules. Randomly entangled plasmonic nanowires achieve this through metal-metal junctions formed wherever neighboring wires cross, touch, or approach one another. Experimental studies have demonstrated substantial SERS responses from randomly stacked or interwoven nanowire networks without precise control of individual junction geometry11,12. Numerical analysis further shows that crossing-nanowire junctions retain strong field enhancement over a broad range of mutual orientations13. This angular forgiveness allows the entangled network to retain numerous active junctions without precise alignment of individual nanowires, while its open structure preserves molecular access to the metal surfaces and junction vicinity.
Flexible carbon nanotubes (CNTs) provide two scaffold geometries for realizing this open junction network before depositing any plasmonic material: the bent upper canopy of a vertically aligned CNT (VACNT) forest11,14 and the randomly interwoven mat of carbon nanotube buckypaper (CNTBP)15. In both implementations, the CNT network establishes the wire geometry but does not serve as the plasmonic enhancing surface. A conformal high-k, wide-bandgap dielectric can be introduced to reduce direct Au-CNT coupling while retaining the preformed crossings11. Subsequent Au deposition converts the scaffold into an Au-coated VACNT-canopy or CNTBP network. The fabrication endpoint is a junction-preserving morphology in which individual fibers are continuously metalized while repeated crossings and open voids remain accessible. This protocol describes both routes and evaluates their concentration-dependent and spatial SERS responses.
البروتوكول
Use either the VACNT-canopy route or the CNTBP route to prepare the entangled scaffold. Apply the optional dielectric step when a dielectric barrier between Au and the conductive CNT core is required. The raw and processed data supporting the concentration-dependent SERS measurements, spatial Raman mapping, and beam-profile measurement have been deposited in Figshare and are publicly available at https://doi.org/10.6084/m9.figshare.33497296. The reagents and the equipment used are listed in the Table of Materials.
1. Preparation of the entangled carbon scaffold
- VACNT scaffold
- Obtain a preformed VACNT forest with a bent and entangled upper canopy
NOTE: The commercial VACNT scaffold used in this study had a forest height of 140.7 µm and a mean CNT diameter of 20.4 nm. According to the supplier, the VACNT forest was grown by plasma-enhanced chemical vapor deposition (PECVD); detailed growth conditions were not available to the authors. Preserve the canopy because it defines the junction geometry used in the final Au-coated network - Place the substrate in a tube furnace. Heat it to 500 °C and maintain this temperature for 6 h with the furnace tube under an argon atmosphere to reduce unintended sp3-type defects on the CNT surface16.
- Cool the furnace to room temperature under the same atmosphere.
- Reject a substrate if the upper canopy is visibly flattened, detached, or contaminated.
- Obtain a preformed VACNT forest with a bent and entangled upper canopy
- CNTBP scaffold
- Transfer 1 mL of the aqueous CNT dispersion into a centrifuge tube. Centrifuge the dispersion at 425 x g for 30 min.
- Collect 10 µL of the supernatant without disturbing the sediment. Add the collected supernatant to 100 mL of deionized water (DI water).
- Sonicate the diluted CNT dispersion for 5 min to redistribute the nanotubes before filtration.
- Vacuum-filter the full dispersion through an anodic aluminum oxide (AAO) membrane with a nominal pore diameter of 200 nm. Vacuum pressure was not independently measured or controlled during filtration.
- Dry the membrane-supported CNTBP at 80 °C for 3 h. Cool it to room temperature in a covered container. Retain the CNTBP on the AAO membrane during subsequent processing; no membrane-detachment step is performed. Handle the dried mat only at its edge or through the supporting membrane.
- Reject CNTBP specimens containing macroscopic cracks, folds, detached regions, or visibly nonuniform regions.
2. Deposition of the optional conformal dielectric interlayer
- Apply this section when introducing a dielectric barrier between the conductive CNT scaffold and the plasmonic metal.
- Load the scaffold into the thermal atomic layer deposition reactor and stabilize the stage at 130 °C.
- Run ALD at 130 °C using a 0.5 s TMA pulse, a 20 s purge with 500 sccm Ar, a 0.1 s H2O pulse, and a 20 s purge with 500 sccm Ar per cycle.
- Repeat the sequence for 35 cycles. Under the representative conditions, the nominal alumina thickness was approximately 2.4 nm on VACNT and 2.0 nm on CNTBP.
NOTE: These values are nominal coating-thickness estimates on the CNT structures and should not be interpreted as independent measurements of ALD growth per cycle. - Confirm that the fibrous scaffold morphology is retained after ALD and that no visible bridging or aggregation of neighboring fibers has occurred.
3. Conversion of the scaffold into entangled plasmonic nanowires
- Au deposition on the scaffold by electron-beam evaporation
- Mount the scaffold facing the metal source at normal incidence.
- Evacuate the chamber to 5 × 10⁻⁶ Torr.
- Deposit gold targeting 2.0 Å/s. Use the calibrated deposition amount that yields an approximately 18.1 nm radial Au shell under the representative condition.
- Vent the chamber and unload the sample.
- Acquire top-view scanning electron microscopy (SEM) images from at least three separate regions (Figure 1). Resolve individual coated wires, open voids, and wire-to-wire crossings.
- Accept the substrate when Au forms a continuous coating along individual fibers while the canopy remains open. Reject undercoated regions dominated by exposed CNTs or isolated Au domains, and reject overcoated regions in which neighboring fibers merge into broad film-like areas.
- Au deposition on the scaffold by sputtering
- Load the scaffold into the sputtering chamber with the exposed fibrous surface facing the Au target.
- Evacuate and stabilize the chamber at a deposition pressure of 5 × 10⁻²Torr.
- Deposit Au at 1-2 Å/s. Use a nominal Au thickness of 6.8 nm for Au/CNTBP and 4.6 nm for Au/Al2O3/CNTBP after the nominal 2.0 nm alumina coating.
- Vent the chamber and remove the substrate by its carrier edge without contacting the Au-coated fibrous surface.
- Acquire top-view SEM images from at least three separated regions. Confirm that the Au coating follows the CNT fibers while retaining repeated crossings and open voids throughout the mat.
- Reject isolated Au islands, exposed CNT-dominated regions, or extended coalesced areas that close the interwire voids.
4. Characterization of the SERS response
- Load the analyte in a liquid environment
- Prepare the analyte at the required concentration in a fixed solvent. Use the immersion configuration to maintain the analyte in a liquid environment during Raman measurement (Figure 1K).
- Place the fabricated substrate in a hybridization chamber, fill the chamber with analyte solution, and seal it to limit evaporation and maintain a constant liquid volume.
- Mount the chamber on a confocal Raman microscope equipped with a 20× objective and use 785 nm excitation.
- Measure the concentration-dependent response of the CNTBP substrates
- Prepare 1,2-bis(4-pyridyl)ethylene (BPE) in methanol at 5 mM and make successive 10-fold dilutions. Continue the series to 50 pM for Au/CNTBP and to 5 pM for Au/Al2O3/CNTBP. The resulting series is 5 mM, 500 µM, 50 µM, 5 µM, 500 nM, 50 nM, 5 nM, 500 pM, and 50 pM; include an additional 5 pM measurement for Au/Al2O3/CNTBP.
- For the concentration series in Figure 2A,B, use an incident power of 3.1 mW, an acquisition time of 5 s, and 3 accumulations per spectrum. Keep these settings fixed for all concentrations.
- Acquire spectra at three separate positions for each concentration under identical optical conditions. Extract the BPE intensity at 1200 cm-1 and report the mean and standard deviation.
- Compare the BPE band near 1200 cm-1 across the concentration series. Define the operational detection threshold as the lowest tested concentration at which the characteristic band remains spectrally distinguishable from the adjacent local spectral baseline, and the immediately lower tenfold dilution no longer shows a distinguishable band under the same acquisition conditions.
NOTE: This operational threshold is based on direct spectral discrimination rather than a predefined SNR or statistical 3σ criterion.
- Acquire and analyze the spatial Raman map
- Before mapping, acquire spectra at several separated positions and confirm that the selected analyte band remains stable without progressive spectral change, solution loss, or focal drift.
- Determine the laser sampling width using the knife-edge method or an equivalent calibrated beam-profile measurement. Translate a sharp edge across the focused beam along the mapping direction, fit the measured edge response with an error function, and obtain the corresponding Gaussian intensity profile15,17. Record both the full width at half maximum (FWHM) and the 1/e2 half-width. Under the optical configuration used for the representative map, the Gaussian-beam FWHM was 10.35 µm and the 1/e2 half-width was 8.79 µm, corresponding to a 1/e2 beam diameter of 17.58 µm.
- Define the two-dimensional mapping region and set the center-to-center scan interval relative to the measured beam profile. For the representative 33 × 33 map, use an 8.8 µm interval, which is approximately equal to the measured 1/e2 half-width of the beam. Accordingly, adjacent map positions partially overlap optically. When applying a different optical configuration, determine the beam profile again and select the scan interval relative to the measured sampling width.
- For the Figure 2C spatial map, use an incident power of 6.9 mW, an acquisition time of 1 s, and 5 accumulations at each position. Keep these settings fixed for all 1,089 positions.
- For acetaminophen, extract the band near 835 cm-1 and normalize it to the CNT G-band response near 1580 cm-1. Retain the full pointwise distribution rather than reporting only the map mean.
النتائج
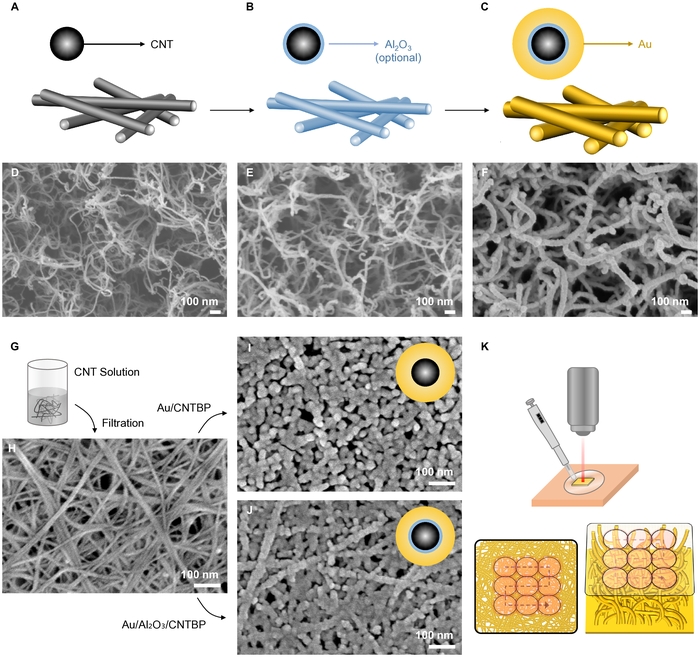
Figure 1: Fabrication of entangled plasmonic nanowire SERS substrates. (A–C) Schematics of the CNT scaffold before coating, after optional conformal alumina deposition, and after Au deposition. (D–F) SEM images of the VACNT canopy, the alumina-coated canopy, and the Au/Al2O3/VACNT nanowire network. (G) Formation of CNTBP by vacuum filtration of an aqueous CNT dispersion. (H) SEM image of the resulting CNTBP scaffold. (I) Direct Au-coated CNTBP network and (J) Au/Al2O3/CNTBP network. (K) Immersion loading and Raman mapping of the fabricated SERS substrates. The lower schematics illustrate laser sampling over the CNTBP mat and the VACNT canopy. All scale bars are 100 nm. Please click here to view a larger version of this figure.
The protocol preserves the entangled geometry through dielectric and metal deposition (Figure 1A–J). In the VACNT route, the bent canopy remained recognizable after alumina atomic layer deposition and Au evaporation (Figure 1D–F). Thirty-five ALD cycles corresponded to a nominal alumina thickness of approximately 2.4 nm, and the Au deposition produced an approximately 18.1 nm radial shell on CNTs with a mean diameter of 20.4 nm. The resulting outer wire diameter was approximately 60 nm, as determined previously from more than 45 measurements across three SEM images14. The as-fabricated structure retained a junction-preserving morphology with individually resolvable Au-coated wires, repeated crossings, and open voids rather than broad film-like regions.
The CNTBP route reached the same architectural endpoint at a smaller wire diameter (Figure 1G–J). Vacuum filtration formed a porous, randomly interwoven CNT mat that retained its fibrous architecture after either direct Au deposition or alumina-assisted Au deposition. Au/CNTBP had a mean wire diameter of 27.4 nm with a nominal Au thickness of 6.8 nm, whereas Au/Al2O3/CNTBP had a mean diameter of 25.9 nm with nominally 2.0 nm of alumina and 4.6 nm of Au. Representative SEM images acquired at the same magnification show similar overall network morphologies for the two structures, with individually resolvable fibers, repeated crossings, and open voids retained in both cases (Figure 1I–J). Both structures show the intended junction-preserving morphology, with continuous metal coverage along the fibers and without broad coalesced regions that close the original voids.
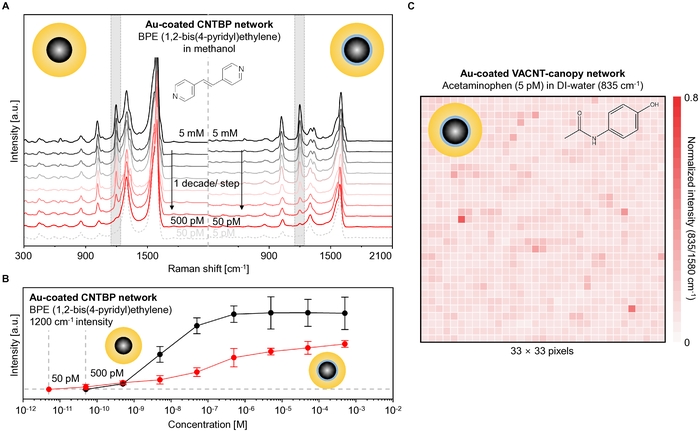
Figure 2: Concentration-dependent SERS response and spatial Raman mapping of entangled plasmonic nanowire designs. (A) Concentration-dependent spectra of BPE in methanol measured using Au/CNTBP and Au/Al₂O₃/CNTBP. The concentration series extends from 5 mM to 50 pM or 5 pM, respectively. By the operational spectral criterion defined in Section 4.2.4, the operational detection thresholds are 500 pM and 50 pM, respectively. Shaded regions mark selected representative BPE bands. (B) BPE intensity at 1200 cm-1 as a function of concentration for Au/CNTBP (black) and Au/Al2O3/CNTBP (red). Points and error bars represent the mean and standard deviation of three measurements. (C) A 33 x 33 Raman map of 5 pM acetaminophen in DI water acquired using the Au-coated VACNT-canopy network (Au/Al2O3/VACNT; shown in Figure 1F). The color scale reports the acetaminophen band near 835 cm-1 normalized to the CNT G band near 1580 cm-1. The scan interval is 8.8 µm. Values above 0.8 are displayed at the upper color limit. Please click here to view a larger version of this figure.
Both CNTBP structures produced concentration-dependent SERS responses extending into the picomolar range (Figure 2A,B). The BPE band near 1200 cm-1 increased across the measured concentration series. Using the operational spectral criterion defined in Section 4.2.4, the detection thresholds were 500 pM for Au/CNTBP and 50 pM for Au/Al2O3/CNTBP. The corresponding next lower tenfold dilutions, 50 pM and 5 pM, respectively, no longer showed a discernible BPE band under the same acquisition conditions. The operational threshold was one decade lower for Au/Al2O3/CNTBP than for Au/CNTBP. Notably, Au/CNTBP exhibited higher absolute BPE intensity over most of the measured concentration range despite the lower operational threshold of Au/Al2O3/CNTBP. The lower threshold is qualitatively consistent with reduced Au-CNT coupling reported for metal-dielectric-CNT nanowires11. However, the present comparison does not isolate this contribution from changes in Au nucleation, coating texture, or local junction geometry.
The 33 × 33 Raman map examined the spatial SERS response of the Au-coated VACNT-canopy network (Au/Al2O3/VACNT) at 5 pM acetaminophen (Figure 2C). The normalized 835/1580 cm-1 response had a mean of 0.112, a standard deviation of 0.043, and a median of 0.104. Of the 1,089 mapped positions, 905 (83.1%) remained within ±30% of the median. Most of the remaining variation arose from a small number of high-response positions rather than extended regions of weak signal. The response persisted across most of the mapped area, although its magnitude varied locally.
المناقشة
The most critical step is to preserve the entangled scaffold while converting it into a continuous Au network. The CNT geometry establishes the number and accessibility of wire crossings before metallization. Once the canopy is flattened, the CNTBP is cracked, or neighboring fibers are bridged by excess coating, the lost junction architecture cannot be recovered later. SEM provides a practical acceptance test for the fabricated network. A successful substrate contains continuously coated, individually resolvable fibers, open voids, and repeated interwire crossings. Isolated metal domains indicate undercoating, whereas extended film-like regions indicate overcoating.
The nominal alumina thicknesses were approximately 2.4 nm on VACNT and 2.0 nm on CNTBP. These values do not establish different intrinsic ALD growth rates because we did not independently measure growth per cycle on either scaffold. The two CNT architectures also provide different precursor-transport environments: the relatively open VACNT canopy and the more tortuous CNTBP network can experience different effective precursor exposure during ALD, as reported for porous and high-aspect-ratio fibrous substrates18. Such geometric differences could contribute to the small nominal thickness difference, but their contribution was not independently resolved here. In this report, we do not assign the small nominal thickness difference to a substrate-dependent ALD growth mechanism.
Au/CNTBP exhibits higher absolute BPE intensity over most of the measured concentration range, whereas Au/Al2O3/CNTBP retains a distinguishable response at a concentration one decade lower (Figure 2A,B). The lower operational threshold therefore does not represent a uniform increase in SERS signal magnitude. Reduced Au-CNT coupling may explain the lower threshold, consistent with previous metal-dielectric-CNT nanowires11,19. However, the similar network morphologies observed by SEM (Figure 1I,J) do not exclude differences in Au nucleation, coating morphology, or nanoscale junction geometry. The present data cannot distinguish electronic decoupling from morphology-induced effects. Cross-sectional TEM could resolve dielectric continuity and local junction morphology, while XPS of CNT/Al2O3/Au interfaces could probe changes in interfacial chemical and electronic states. Together with morphology-matched controls, these measurements would directly test the relative contributions of the two mechanisms.
The spatial map establishes consistency within the measured substrate. Local signal variations can arise from differences in wire-wire junctions, Au morphology, and molecular adsorption, although the present measurements do not resolve their individual contributions. Despite this variation, 83.1% of the mapped responses remained within ±30% of the median, and the remaining spread was dominated by sparse high-response positions rather than extended low-response regions for 5 pM acetaminophen in DI water (Figure 2C). The response was maintained across most of the mapped area. Because all measurements were obtained from a single substrate, between-substrate and between-batch reproducibility remain to be established using independently fabricated specimens under identical measurement conditions.
Ordered and template-defined substrates form controlled nanoscale gaps, whereas porous metals and colloidal aggregates generate hotspots along internal metallic features or at interparticle contacts. The present architecture instead forms wire-wire junctions through spontaneous nanowire encounters before metallization. Angular forgiveness allows crossing-nanowire junctions to retain strong field enhancement over a broad range of mutual orientations13, while the open network preserves molecular access to the junction vicinity. The corresponding limitation is that local junction number, junction separation, and metal coverage remain variable. CNT density can be varied to alter the number of wire-wire encounters20, whereas Au deposition determines whether individual wires remain incompletely coated, become continuously metalized, or merge with neighboring wires11. Future studies should determine whether controlling these parameters reduces spatial SERS variation and improves between-substrate and between-batch reproducibility.
The present study did not report an analytical enhancement factor (EF) because the liquid-cell measurements were not configured to provide the molecular normalization required for a paired SERS/normal-Raman comparison. A molecular Raman reference generally acquires sufficient signal at a substantially higher analyte concentration than the picomolar-to-micromolar SERS measurements. Although this bulk-concentration difference can be accounted for through molecule-number normalization, the molecular population sampled by SERS is also governed by concentration-dependent surface adsorption. Previous measurements of BPE on related entangled-nanowire substrates showed a nonlinear concentration dependence consistent with Langmuir-type adsorption behavior20, indicating that the SERS-active surface population cannot be assumed to scale directly with bulk concentration over the full concentration range. We therefore did not derive a retrospective order-of-magnitude analytical EF that would require an adsorption- or molecule-counting normalization not established in the present protocol.
الإفصاحات
The authors declare no competing interests. Generative artificial intelligence (AI) tools were used only for language editing, grammatical correction, and improvement of manuscript readability. The study design, methodology, data analysis, interpretation of the results, and all scientific and editorial decisions were independently developed, verified, and approved by the authors, who take full responsibility for the content of this manuscript.
شكر وتقدير
This work was funded by the National Research Foundation of Korea (NRF) grant funded by the Korean Government (MSIT) (No. 2020R1A3B2079741). A part of this work was supported by the Po-Ca Networking Groups funded by the Postech-Catholic Biomedical Engineering Institute (PCBMI) (No. 2.0080459.01, RS-2026-25510921).
المواد
| الاسم | الشركة | رقم فهرسي | التعليقات |
|---|---|---|---|
| 20x objective lens | Olympus | SLMPLN | Objective lens for concentration-dependent SERS measurements |
| 20x objective lens | Olympus | MPLFLN | Objective lens for spatial Raman mapping |
| Acetaminophen | Sigma-aldrich | 103-90-2 | Analyte for spatial Raman mapping |
| Anodisc aluminum oxide (AAO) membrane (200 nm pore size) | Whatman | 6809-5522 | Filtration membrane for CNTBP scaffold preparation |
| Ar (99.999%) | Donghae Gas IND.CO.,Ltd. | https://www.dhgi.co.kr/main.html | Gas for VACNT thermal treatment |
| Ar (99.999%) | Hanyoung Gas Technology | www.gasmaster.co.kr | Argon gas for purging during atomic layer deposition |
| Au (99.999%) | iTASCO | EAU0KI0001 | Gold source for electron-beam evaporation |
| Au (99.99%) | Madelab | https://www.madelab.net | Gold source for sputtering system |
| BPE (1,2-bis(4-pyridyl)ethylene) (97%) | Sigma-aldrich | 13362-78-2 | Analyte for concentration-dependent SERS measurements |
| Dream Plus MDM-0120 | Puleunlab | http://puleunlab.com/sub/product/view.php?projectSeq=24 | Water purification system for aqueous solution preparation |
| DST1 | Vaccoat | www.vaccoat.com/products/magnetron-sputter-coater-dst1-300/ | Sputtering system for Au deposition on CNTBP scaffolds |
| F 12/100/940 | Lenton | https://www.nature.com/articles/s41598-026-38497-5 | Tube furnace for thermal treatment of VACNT scaffolds |
| FEX-MD | WEVE | https://en.theweve.com/ | Raman spectrometer for concentration-dependent SERS measurements |
| H1850 | Cence | 203270008 | Centrifuge for CNT dispersion preparation |
| Invia confocal Raman microscope | Renishaw | www.renishaw.com | Confocal Raman spectrometer for spatial Raman mapping |
| JAC-3010 | KODO | U02-328-321 | Sonicator for CNT dispersion preparation |
| KVE-C3001160 | Korea Vacuum Tech | www.koreavac.com | Electron-beam evaporator for Au deposition on VACNT scaffolds |
| Methanol (99.5%) | Samchun | www.samchun.com/en/sub/product/list.asp | Solvent for concentration-dependent BPE SERS measurements |
| plus 200 | Quros | www.quros.co.kr | ALD system for oxide interlayer deposition |
| S-4800 | HITACHI | www.hitachi-hightech.com | SEM for nanowire morphology characterization |
| Secure-Seal™ Hybridization chamber (0.9 mm thick) | Electron Microscopy Sciences | 70333-32 | Hybridization chamber for liquidphase SERS measurements (CNTBP scaffold) |
| Secure-Seal™ Hybridization chamber (2.5 mm thick) | Electron Microscopy Sciences | 70333-36 | Hybridization chamber for liquid-phase SERS measurements (VACNT scaffold) |
| TNWDS 0.2 wt% | Timesnano | TNWDS | Single-wall CNT dispersion for CNTBP scaffold preparation |
| Trimethylaluminium(TMA) | UPChem | www.upchem.co.kr/eng/product/product.php | Alumina precursor for atomic layer deposition |
| VACNT with entangled canopy on top | Porifera Inc. | www.porifera.com | VACNT scaffold for entangled plasmonic nanowire fabrication |
المراجع
- Li YR, et al. 3D hybrid arrayed Ag/MOF multi-plasmon resonant cavity system for high-performance SPR sensing. Opt Laser Technol. 2023;167:109825.
- Ai Z, et al. Four peak and high angle tilted insensitive surface plasmon resonance graphene absorber based on circular etching square window. J Phys D Appl Phys. 2025;58(18):185305.
- Zha Y, Cheng S. Tunable high-sensitivity mid-infrared perfect absorber with five resonance peaks based on nested circular and elliptical ring graphene surface plasmons. Physica B Condens Matter. 2026;739:418929.
- Le Ru EC, Blackie E, Meyer M, Etchegoin PG. Surface enhanced Raman scattering enhancement factors: a comprehensive study. J Phys Chem C. 2007;111(37):13794-13803.
- Schlücker S. Surface-enhanced Raman spectroscopy: concepts and chemical applications. Angew Chem Int Ed Engl. 2014;53(19):4756-4795.
- Fan M, Andrade GF, Brolo AG. A review on the fabrication of substrates for surface-enhanced Raman spectroscopy and their applications in analytical chemistry. Anal Chim Acta. 2011;693(1-2):7-25.
- Chen S, et al. Assembly of long silver nanowires into highly aligned structure to achieve uniform "hot spots" for surface-enhanced Raman scattering detection. Spectrochim Acta A Mol Biomol Spectrosc. 2022;273:121030.
- Huang Z, et al. Large-area Ag nanorod array substrates for SERS: AAO template-assisted fabrication, functionalization, and application in detection PCBs. J Raman Spectrosc. 2013;44(2):240-246.
- Wu LP, et al. Highly sensitive, reproducible and uniform SERS substrates with a high density of three-dimensionally distributed hotspots: gyroid-structured Au periodic metallic materials. NPG Asia Mater. 2018;10(1):e462.
- Holler RPM, et al. Biomacromolecular-assembled nanoclusters: Key aspects for robust colloidal SERS sensing. ACS Appl Mater Interfaces. 2020;12(51):57302-57313.
- Altun AO, Youn SK, Yazdani N, Bond T, Park HG. Metal-dielectric-CNT nanowires for femtomolar chemical detection by surface-enhanced Raman spectroscopy. Adv Mater. 2013;25(32):4431-4436.
- Sun HM, et al. Hydrophilic-hydrophobic silver nanowire-paper based SERS substrate for in situ detection of furazolidone under various environments. Appl Surf Sci. 2021;556:149748.
- Lee J, Park K, Park HG. Nanowires proximity featured with angular forgiveness and far-reaching hotspots toward surface-enhanced Raman spectroscopy. ACS Omega. 2026;11(31):46820-46826.
- Kim H, Lee J, Kim SW, Park HG. Plasmonic artificial inspector for herbal medicines via surface-enhanced Raman spectroscopy and deep learning. Sci Rep. 2026;16(1):7425.
- Lee J, Park HG. Plasmon-driven dimerization reveals the propagation length of surface plasmon polaritons. Nano Lett. 2026;26(1):83-88.
- Guerra-Nuñez C, et al. The nucleation, radial growth, and bonding of TiO2 deposited via atomic layer deposition on single-walled carbon nanotubes. Appl Surf Sci. 2021;555:149662.
- Ok G, Choi SW, Park KH, Chun HS. Foreign object detection by sub-terahertz quasi-Bessel beam imaging. Sensors (Basel). 2013;13(1):71-85.
- Szmyt W, Guerra-Nuñez C, Huber L, Dransfeld C, Utke I. Atomic layer deposition on porous substrates: From general formulation to fibrous substrates and scaling laws. Chem Mater. 2022;34(1):203-216.
- Lightner CR, Altun AO, Park HG. Molecular sensing by SERS using entangled nanofibers. In: Nanotube Superfiber Materials. Elsevier; 2019. p. 795-823.
- Altun AO, Bond T, Pronk W, Park HG. Sensitive detection of competitive molecular adsorption by surface-enhanced Raman spectroscopy. Langmuir. 2017;33(28):6999-7006.
إعادة الطباعة والأذونات
تم نشر هذه المقالة
الفيديو قريباً