An erratum was issued for: Visual Classical Conditioning in Wood Ants. The Acknowledgments section was updated, and a supplemental figure was added.
Erratum: Visual Classical Conditioning in Wood Ants
358 vues
⸱
28 août 2024
Dans cet article
Résumé
Résumé
An erratum was issued for: Visual Classical Conditioning in Wood Ants. The Acknowledgments section was updated, and a supplemental figure was added.
The Acknowledgments sections was updated from:
The authors thank Tom Collett and Cornelia Buehlmann for sharing valuable information regarding collection and maintenance of wood ant colonies. The authors also thank Justine Crevel for commenting on previous versions of this article.
to:
The authors thank Tom Collett and Cornelia Buehlmann for sharing information regarding collection and maintenance of wood ant colonies. The authors also thank Justine Crevel for commenting on previous versions of this article, and Nora Nevala for measuring the spectrum intensity of the visual stimulus. This work was supported by a BBSRC grant to JEN (grant number BB/R005036/1). All the data pertaining to this manuscript are published in the University of Sussex Research Data Repository online database (10.25377/sussex.5794386).
The following supplemental figure was added to the end of the Representative Results section:
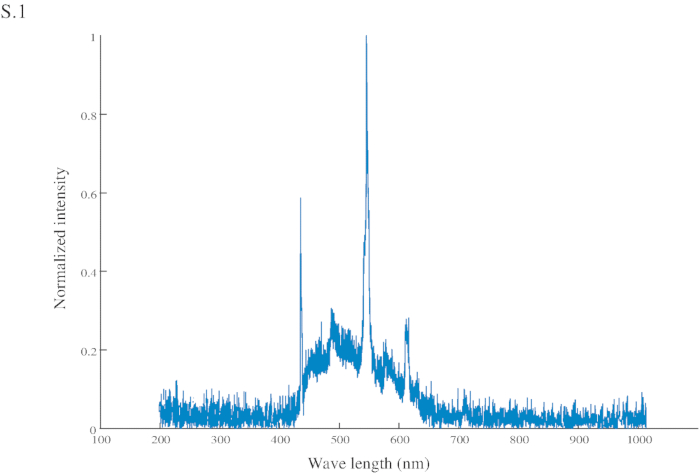
Figure S1: Normalized intensity of the conditional stimuli (CS). The CS has a peak intensity at 545 nm (in the green range) and another at 435 nm (in the blue range).
Protocole
An erratum was issued for: Visual Classical Conditioning in Wood Ants. The Acknowledgments section was updated, and a supplemental figure was added.
The Acknowledgments sections was updated from:
The authors thank Tom Collett and Cornelia Buehlmann for sharing valuable information regarding collection and maintenance of wood ant colonies. The authors also thank Justine Crevel for commenting on previous versions of this article.
to:
The authors thank Tom Collett and Cornelia Buehlmann for sharing information regarding collection and maintenance of wood ant colonies. The authors also thank Justine Crevel for commenting on previous versions of this article, and Nora Nevala for measuring the spectrum intensity of the visual stimulus. This work was supported by a BBSRC grant to JEN (grant number BB/R005036/1). All the data pertaining to this manuscript are published in the University of Sussex Research Data Repository online database (10.25377/sussex.5794386).
The following supplemental figure was added to the end of the Representative Results section:
Figure S1: Normalized intensity of the conditional stimuli (CS). The CS has a peak intensity at 545 nm (in the green range) and another at 435 nm (in the blue range).
Déclarations de divulgation
No conflicts of interest declared.