In a single-center retrospective cohort of 571 patients, a Cox nomogram incorporating preoperative RBP4 and clinical features predicted postoperative recurrence of intrahepatic bile duct stones. Temporal validation demonstrated good calibration and improved predictive performance at 1 and 3 years (AUC 0.72–0.78).
Article de recherche
Prediction Model with Serum RBP4 and Clinical Features for Postoperative Recurrence of Intrahepatic Bile Duct Stones: A Retrospective Cohort Study
Dans cet article
Résumé
Résumé
Postoperative recurrence of intrahepatic bile duct stones is common and is influenced by biliary stricture, cholangitis, and metabolic inflammation; however, a validated preoperative prediction tool is lacking. A nomogram combining serum retinol-binding protein 4 (RBP4) with clinical and imaging features was constructed and temporally validated to assess individualized recurrence risk. In a single-center retrospective cohort of 571 patients with complete stone clearance (2015–2022), split into development (n = 357) and temporal validation (n = 214) cohorts, the outcome was imaging-confirmed recurrence ≥6 months after surgery. A Cox nomogram with RBP4 modeled using restricted cubic splines, adjusted for age, albumin, eGFR, history of cholangitis, bilobar involvement, biliary stricture, stone diameter, and diabetes, was internally validated using 1,000 bootstrap resamples. Model performance was assessed using the C-index, time-dependent AUC, Brier score, calibration, and decision curve analysis and was compared with that of a clinical-only model. Over 1,695 person-years of follow-up, 184 recurrences occurred (1-year and 3-year recurrence rates: 8.96% and 31.84%, respectively). RBP4 showed an independent nonlinear association with recurrence (P < 0.001) and consistent results in sensitivity analyses. The nomogram provided clear risk stratification (log-rank P < 0.001) and good calibration. AUCs were 0.78 and 0.76 in the development cohort and 0.74 and 0.72 in the validation cohort at 1 and 3 years, respectively; corresponding C-indices were 0.76 and 0.72. Adding RBP4 significantly improved model fit (P < 0.001) and yielded net benefit across threshold probabilities ranging from 10% to 30%. Preoperative RBP4, combined with clinical and imaging features, may facilitate individualized estimation of 1-year and 3-year recurrence risk, with acceptable performance in temporal validation, although external validation remains necessary.
Introduction
Intrahepatic bile duct stones are common in East Asia and are often accompanied by biliary stricture, cholestasis, and recurrent cholangitis, which can lead to serious consequences such as liver abscess, biliary sepsis, and secondary biliary cirrhosis1,2. Definitive stone-clearance surgery and, when necessary, hepatectomy and biliary reconstruction can relieve symptoms; however, postoperative recurrence remains the central challenge in long-term management. Patients often require repeated imaging examinations, interventional procedures, or repeat surgery, thereby increasing hospital readmissions and the healthcare burden3,4. Previous studies suggest that recurrence is closely related to biliary anatomical abnormalities, a history of infection, and stone burden and is also influenced by hepatic and renal function and systemic inflammatory status, indicating that recurrence risk is determined by both local and host factors5. In current clinical practice, follow-up and re-examinations largely rely on clinical experience or individual risk factors, resulting in marked heterogeneity in recurrence risk among patients6. Quantifiable estimation of individual recurrence risk at the preoperative stage remains difficult, limiting the ability to guide the frequency of follow-up examinations, anti-infective strategies, and patient education7. Reported predictors have focused mainly on biliary stricture, bilobar involvement, and a history of cholangitis, whereas evidence supporting biomarkers that reflect host metabolic and inflammatory phenotypes remains limited8.
Retinol-binding protein 4 (RBP4), a protein secreted by the liver and adipose tissue, is associated with insulin resistance, low-grade inflammation, and hepatic and renal metabolic pathways9. Theoretically, RBP4 may contribute to recurrent stone formation by altering bile composition and the biliary mucosal microenvironment; however, its role in predicting postoperative recurrence of intrahepatic bile duct stones has not been systematically evaluated10. Existing prediction models also commonly treat continuous variables as linear or categorize them into arbitrary groups and often lack calibration assessment and temporal validation, thereby limiting clinical implementation.
A single-center retrospective cohort was therefore established using consecutive hospitalized patients and a biobank, enrolling patients with intrahepatic bile duct stones who met the stone-clearance criteria and following them until recurrence or a prespecified censoring date. A Cox proportional hazards model with restricted cubic splines was used to characterize the nonlinear effect of RBP4, and a nomogram incorporating key clinical and imaging features was developed. Bootstrap optimism correction, temporal split validation, and comprehensive evaluation of discrimination, calibration, overall prediction error, and clinical net benefit were performed, and model performance was compared with that of a clinical-only model. The resulting model is intended to provide an individualized preoperative recurrence-risk assessment tool to support risk-stratified follow-up and resource allocation. The study hypothesis was that preoperative serum retinol-binding protein 4 is independently associated with postoperative recurrence beyond traditional anatomical, infectious, renal, and nutritional predictors; that this association is nonlinear; and that incorporating retinol-binding protein 4 into clinical and imaging predictors improves individualized estimation of 1-year and 3-year recurrence risk.
Protocole
The study was approved by the Medical Ethics Committee of Tianjin Hospital of Integrated Traditional Chinese and Western Medicine, Nankai Hospital (NKYY_YXKT_IRB_2025_164_01), with a waiver of written informed consent because of the retrospective study design and the use of de-identified data. The research tools used in this protocol are listed in the Table of Materials.
1. Study design
This single-center retrospective cohort study was conducted in the Department of Hepatobiliary Surgery, Tianjin Hospital of Integrated Traditional Chinese and Western Medicine, and Nankai Hospital. Consecutive adult patients who underwent surgery for intrahepatic bile duct stone clearance between January 1, 2015, and December 31, 2022, were screened. Follow-up continued until the first recurrence event, death, loss to follow-up, or the administrative censoring date of June 30, 2025.
2. Study population
Patients were eligible if they were aged ≥18 years, had intrahepatic bile duct stones confirmed by preoperative imaging, underwent surgery with the intention of complete stone clearance, and had no residual stones confirmed by intraoperative choledochoscopy or imaging within 30 days after surgery. Preoperative fasting serum RBP4, measured within 7 days before surgery or from stored serum for subsequent measurement, was also required.
Patients were excluded if they had isolated extrahepatic bile duct stones without intrahepatic involvement, hepatobiliary malignancy, previous liver transplantation, Child-Pugh class C liver failure, baseline eGFR <30 mL/min/1.73 m2, pregnancy, sepsis at admission, hemodynamic instability requiring support, unverifiable key baseline variables, or less than 6 months of follow-up without recurrence. Patients with stones detected within 6 months after surgery were considered to have residual stones and were excluded from the primary analysis.
Patients with an eGFR of 30–59 mL/min/1.73 m2 were retained in the primary analysis. Subgroup analysis of patients with an eGFR ≥60 mL/min/1.73 m2 was performed solely to assess whether the association between RBP4 and recurrence persisted among patients with relatively preserved renal function.
3. Data collection and candidate predictors
Clinical, laboratory, imaging, operative, and follow-up data were extracted from electronic medical records, laboratory information systems, imaging archives, operative records, and biobank records. Two investigators independently extracted the data using a predefined variable dictionary. Discrepancies were resolved through review of the original records and adjudication by a third investigator.
Candidate predictors were selected based on clinical relevance, previous literature, and availability before surgery or before discharge. These included age, sex, body mass index, diabetes, albumin, total bilirubin, γ-glutamyl transferase, eGFR, C-reactive protein, prior episodes of cholangitis, bilobar involvement, biliary stricture, maximal stone diameter, and serum RBP4. Operative variables, including hepatectomy, biliary reconstruction, operative duration, intraoperative blood loss, and postoperative complications, were recorded for descriptive and sensitivity analyses but were not included in the primary model because the intended application of the model was preoperative or early perioperative risk estimation.
4. Measurement of serum retinol-binding protein 4 (RBP4)
Serum retinol-binding protein 4 (RBP4) was measured using fasting venous blood collected within 7 days before surgery. All RBP4 values were expressed uniformly as mg/L. When a quantitative preoperative RBP4 result was available in the laboratory information system, that value was used. For patients without a historical laboratory result but with available stored serum, RBP4 was measured using samples that had been aliquoted and stored at −80 °C immediately after collection. The maximum storage interval before assay was 36 months; samples exceeding this interval were not used.
To minimize protein degradation and repeated freeze-thaw artifacts, each sample underwent no more than one freeze-thaw cycle before analysis. Samples were thawed at 4 °C for 30 min and then brought to room temperature before assay. RBP4 was quantified using a validated double-antibody sandwich immunoassay according to the manufacturer's instructions. Briefly, 100 µL of diluted serum (1:200 in assay diluent) and standards were added to microtiter plates pre-coated with anti-human RBP4 antibody, incubated for 2 h at 37 °C, washed, and subsequently incubated with detection antibody and streptavidin-HRP for 1 h at 37 °C. After color development with TMB substrate for 15 min at room temperature in the dark, the reaction was terminated with 2 M H₂SO₄, and absorbance was measured at 450 nm with a reference wavelength of 570 nm using a microplate reader.
Each plate included a seven-point standard curve (0.156–10 mg/L) and two levels of commercially available quality-control materials (low and high). Assay runs were accepted only when control values were within ±15% of their expected ranges, and the coefficient of variation of duplicate samples was < 10%. All measurements were performed in duplicate, and the mean value was used for analysis.
5. Biosafety and waste handling
All blood samples and associated reagents were handled in accordance with institutional biosafety protocols for human biological materials. Serum processing and ELISA procedures were performed in a biosafety level 2 (BSL-2) laboratory. All contaminated materials (pipette tips, microplates, and serum residues) were decontaminated by immersion in 0.5% sodium hypochlorite for at least 30 min before disposal as biohazardous waste and were subsequently autoclaved at 121 °C for 20 min before final disposal. Sharps and other disposable equipment were discarded in puncture-proof containers. Personal protective equipment, including gloves, laboratory coats, and safety goggles, was used throughout the procedure.
6. Imaging assessment and diagnostic criteria for recurrence
Preoperative imaging included abdominal ultrasonography, contrast-enhanced computed tomography, magnetic resonance cholangiopancreatography, or a combination of these modalities. The imaging predictors included in the model were bilobar involvement, biliary stricture, and maximal stone diameter. Bilobar involvement was defined as the presence of stones in both the left and right intrahepatic duct systems. Biliary stricture was defined as localized narrowing of the intrahepatic or hilar bile duct with upstream ductal dilatation. Maximal stone diameter was defined as the longest diameter of the largest intrahepatic stone measured on preoperative imaging.
Postoperative recurrence was diagnosed when one or more newly detected intrahepatic duct stones with a maximal diameter of at least 5 mm were identified at least 6 months after surgery. Recurrent stones were defined as intraductal echogenic foci with posterior acoustic shadowing on ultrasonography, hyperattenuating intraductal foci on computed tomography, or filling defects (signal voids) within the intrahepatic bile ducts on magnetic resonance cholangiopancreatography. Both single and multiple stones were classified as recurrence if they met the above criteria.
Two radiologists independently reviewed the imaging data while blinded to the RBP4 values. Disagreements were resolved through review by a senior radiologist. Inter-rater agreement was assessed using Cohen's κ for categorical variables and the intraclass correlation coefficient for maximal stone diameter.
7. Missing data
The proportion of missing data was assessed before model development. Variable-specific missingness was low, ranging from 0% to 5.1% across the candidate predictors. Patients with key baseline information that could not be verified from the source records were excluded during cohort construction. For the remaining analytic cohort, variables with limited missingness were handled using multiple imputation by chained equations, assuming missingness was at random.
The imputation model included all candidate predictors, the recurrence indicator, and the Nelson-Aalen estimate of the cumulative baseline hazard to account for the time-to-event outcome. Twenty imputed datasets were generated with 10 iterations each. Convergence was assessed using trace plots, and the distributions of observed and imputed values were compared to confirm that the imputed values were clinically plausible. A complete case analysis was performed as a sensitivity analysis to assess the robustness of the results. Missingness for individual variables is summarized in Supplementary Table 1.
8. Model development and LASSO penalization
Patients were divided into development and temporal validation cohorts according to the year of surgery. Patients treated between 2015 and 2019 comprised the development cohort, whereas those treated between 2020 and 2022 comprised the temporal validation cohort. Follow-up time was calculated from discharge to recurrence or censoring.
The primary prediction model was developed in the development cohort using Cox proportional hazards regression. RBP4 was modeled using restricted cubic splines with knots placed at the 5th, 35th, 65th, and 95th percentiles to allow for a nonlinear association with recurrence, as recommended for modeling nonlinear relationships in epidemiological data11. The overall association and nonlinear component of RBP4 were evaluated using joint tests of the spline terms. Because individual spline basis coefficients do not have direct clinical interpretation, the effect of RBP4 was summarized using the overall P value, the P value for nonlinearity, and the hazard ratio comparing the 75th and 25th percentiles of RBP4.
LASSO penalization was applied within the prespecified candidate predictor set to reduce overfitting and improve model stability. The use of LASSO was prespecified when the effective number of model parameters approached the commonly recommended range of 10–20 recurrence events per parameter, particularly after accounting for spline terms and clinically relevant covariates. The penalty parameter was selected by cross-validation in the development cohort. Predictors with nonzero coefficients after penalization were retained in the final model. Although LASSO penalization was applied, all variables retained in the final model were also clinically prespecified. Therefore, the penalization procedure was used primarily for coefficient stabilization rather than exploratory variable selection.
The final model included RBP4, age, albumin, estimated glomerular filtration rate, prior episodes of cholangitis, bilobar involvement, biliary stricture, maximal stone diameter, and diabetes. Variance inflation factors were calculated to assess collinearity, and the proportional hazards assumption was evaluated using Schoenfeld residuals.
9. Nomogram construction and risk stratification
A nomogram was constructed from the final penalized Cox model to estimate individual 1-year and 3-year recurrence probabilities. The baseline survival function was estimated using the Breslow method. In the nomogram, the RBP4 axis displays raw serum RBP4 values in mg/L. Points assigned to RBP4 were derived from the restricted cubic spline transformation used in the Cox model; therefore, the point scale for RBP4 is nonlinear. Users should locate the patient's raw RBP4 value on the nomogram and read the corresponding point value directly.
Patients were stratified into low-, intermediate-, and high-risk groups according to tertiles of the predicted 3-year recurrence risk in the development cohort. The same cutoff values were applied to the temporal validation cohort. Recurrence-free survival across the risk groups was estimated using Kaplan-Meier curves and compared using the log-rank test.
10. Model validation and prediction error
Internal validation was performed using 1,000 bootstrap resamples in the development cohort to estimate optimism in model performance. Temporal validation was subsequently performed in the 2020–2022 cohort using the model developed in the development cohort.
Model discrimination was assessed using Harrell's C-index and the time-dependent area under the receiver operating characteristic curve at 1 and 3 years. Calibration was evaluated using calibration curves, calibration intercepts, and calibration slopes. Overall prediction error was assessed using inverse probability of censoring-weighted Brier scores. To facilitate interpretation, the model Brier scores were compared with the corresponding null-model Brier scores estimated from the marginal recurrence probability at each time point.
Clinical utility was evaluated using decision curve analysis at 1 and 3 years over threshold probabilities ranging from 5% to 40%, a range selected to reflect clinically plausible decision thresholds and current guidance for evaluating prediction models in medical decision-making12. Net benefit was compared with treat-all and treat-none strategies. Model utility was interpreted with particular attention to the intermediate threshold range because the observed net benefit was concentrated primarily between threshold probabilities of approximately 10% and 30%.
11. Incremental value of RBP4
To evaluate the incremental value of RBP4, the full model was compared with a clinical-only model that included the same clinical and imaging predictors but excluded RBP4. The two models were compared using changes in Harrell's C-index, time-dependent AUC, Brier score, decision curve analysis, net reclassification improvement, integrated discrimination improvement, and likelihood ratio testing. Because integrated discrimination improvement represents an absolute change in average predicted risk separation, small IDI values were interpreted cautiously and in conjunction with the calibration and decision-curve findings.
12. Sensitivity, surgical heterogeneity, and competing-risk analyses
Several sensitivity analyses were performed. First, the model was refitted among patients with an eGFR ≥60 mL/min/1.73 m2 to assess whether the association between RBP4 and recurrence persisted in those with relatively preserved renal function. Second, the model was refitted among patients with a C-reactive protein concentration ≤10 mg/L to evaluate whether the association between RBP4 and recurrence remained consistent in patients without marked systemic inflammation. For these subgroup analyses, patients were additionally restricted to those with complete information for all variables required in the corresponding sensitivity models. The final analytical sample sizes are reported in Table 7. Third, assay source was added as a covariate to assess the influence of the measurement platform. Fourth, a complete-case analysis was performed to evaluate the impact of multiple imputation.
Because surgical heterogeneity may influence recurrence risk, operative variables, including hepatectomy and biliary reconstruction, were summarized descriptively. Biliary reconstruction was additionally evaluated in a sensitivity analysis to determine whether adjustment for the surgical approach materially altered the association between RBP4 and recurrence. These operative variables were not included in the primary model because they are not purely preoperative predictors, and the model was intended for preoperative or early perioperative risk estimation.
Death without recurrence was analyzed as a competing event using Fine-Gray regression. The Cox model was retained as the primary prediction model for recurrence-free surveillance, whereas Fine-Gray analysis was performed as a prespecified secondary analysis to determine whether competing mortality materially altered the association between RBP4 and recurrence. Sub-distribution hazard ratios and 95% confidence intervals were reported.
13. Statistical analysis
Continuous variables were summarized as the mean ± standard deviation or median (interquartile range), depending on their distribution. Categorical variables were summarized as counts and percentages. Between-group comparisons were performed using the independent-samples t test or the Wilcoxon rank-sum test for continuous variables and the χ2 test or Fisher's exact test for categorical variables, as appropriate. All statistical tests were two-sided, and P < 0.05 was considered statistically significant. Analyses were performed using a statistical software with the survival, rms, mice, timeROC, riskRegression, glmnet, and related packages.
Résultats
Study population and data quality
A total of 1,036 surgical patients who underwent procedures intended to clear stones were screened, and 571 were ultimately included, divided by calendar year into a development cohort (n = 357) and a temporal validation cohort (n = 214) (Figure 1). Patients with a baseline eGFR of 30–59 mL/min/1.73 m2 were retained in the primary analysis. Among patients eligible for the eGFR ≥60 mL/min/1.73 m2 subgroup, those with complete information required for the sensitivity model were included in the final sensitivity analysis (n = 432).
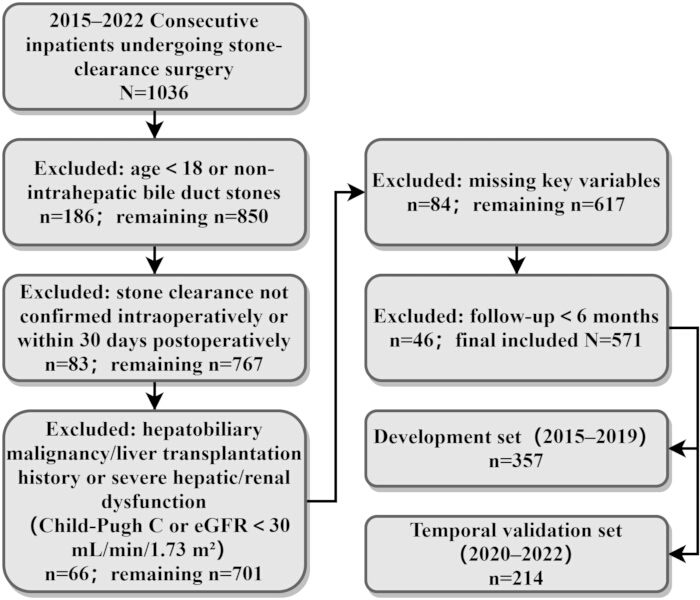
Figure 1: Patient selection flowchart. Consecutive surgical cases at this hospital between January 1, 2015, and December 31, 2022, were screened according to the prespecified inclusion and exclusion criteria, and 571 patients were ultimately included. Patients were divided by year of enrollment into a development cohort (2015–2019, n = 357) and a temporal validation cohort (2020–2022, n = 214). Follow-up continued until recurrence or the administrative censoring date of June 30, 2025. Recurrence was defined as new or recurrent intrahepatic bile duct stones confirmed by imaging at least 6 months after surgery. Patients lost to follow-up after cohort entry were retained in the time-to-event analysis and censored at the date of their last confirmed recurrence-free contact. Please click here to view a larger version of this figure.
Compared with the non-recurrence group (n = 387), the recurrence group (n = 184) was older and had a higher proportion of males, a higher body mass index, and a higher prevalence of diabetes. The recurrence group also had more prior episodes of cholangitis, lower albumin concentrations, higher serum RBP4, C-reactive protein, total bilirubin, and γ-GT levels, lower eGFR, more frequent bilobar involvement and biliary stricture, and a larger maximal stone diameter (all P < 0.05) (Table 1). Continuous variables are presented as the mean ± SD.
Table 1: Baseline characteristics (mean ± SD, n [%], or median [IQR]). For symmetrically distributed continuous variables, the independent-samples t test was used. For skewed continuous variables, the Wilcoxon rank-sum test was used. For categorical variables, the χ2 test or Fisher's exact test was used. Please click here to download this file.
Overall follow-up totaled 1,695.38 person-years, with a median follow-up of 33.1 months. A total of 184 recurrences occurred, corresponding to an incidence rate of 10.85 per 100 person-years. The 1-year and 3-year cumulative recurrence probabilities were 8.96% and 31.84%, respectively. The median time to recurrence among patients who experienced recurrence was 17.9 months. Forty-one patients were lost to follow-up and were censored at the date of their last confirmed recurrence-free contact, whereas 34 patients died without recurrence and were treated as competing events in the Fine-Gray analysis (Table 2).
Inter-rater consistency analyses for the imaging variables demonstrated substantial agreement for bilobar involvement and biliary stricture (both Cohen's κ > 0.70) and excellent agreement for maximal stone diameter (ICC [2,1] = 0.94) (Table 3; n = 571). Adjustment for the RBP4 assay source did not materially alter the association between RBP4 and postoperative recurrence, suggesting that the measurement platform did not substantially influence the primary model results.
Table 2: Overview of follow-up and outcomes. Recurrence was defined as imaging-confirmed new or recurrent intrahepatic bile duct stones occurring at least 6 months after surgery. Patients lost to follow-up were censored at the date of their last confirmed recurrence-free contact. Death without recurrence was treated as a competing event in the Fine-Gray analysis. Please click here to download this file.
Table 3: Inter-rater consistency of imaging variables. Cohen's κ was used for binary variables. ICC (2,1) (two-way random-effects, absolute agreement) was used for the continuous variable. Ninety-five percent confidence intervals were calculated using standard methods. Please click here to download this file.
Predictor effects and model development
A multivariable adjusted restricted cubic spline analysis (n = 571) showed a significant nonlinear association between RBP4 and recurrence risk, with risk increasing as RBP4 increased (Poverall < 0.001, Pnonlin = 0.017) (Figure 2). The increase in risk was more apparent in the upper‑middle range of the RBP4 distribution, although no specific clinical cutoff was derived from the curve.
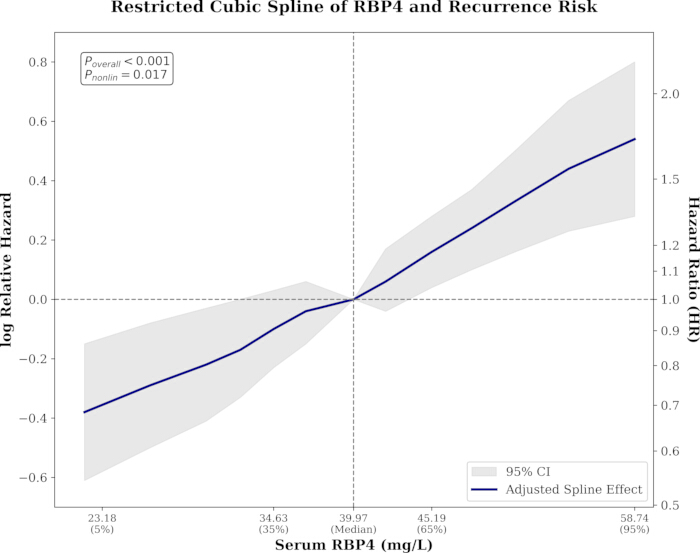
Figure 2: Restricted cubic spline analysis of RBP4 and recurrence risk. RBP4 was modeled using a multivariable Cox proportional hazards model with restricted cubic splines, adjusting for age, albumin, estimated glomerular filtration rate (eGFR), prior episodes of cholangitis, bilobar involvement, biliary stricture, maximal stone diameter, and diabetes. Ninety-five percent confidence intervals were estimated using robust standard errors. The median RBP4 value served as the reference. The curve suggests a nonlinear increase in recurrence risk at higher RBP4 levels; however, no specific clinical cutoff was predefined or derived from this analysis.Please click here to view a larger version of this figure.
LASSO penalization retained the clinically prespecified predictors included in the final model. In the final Cox model after bootstrap optimism correction and uniform shrinkage (development set, n = 357), in addition to RBP4, older age, more prior episodes of cholangitis, bilobar involvement, biliary stricture, and larger stone diameter were associated with higher risk; higher albumin and higher eGFR were associated with lower risk (all P < 0.05); diabetes did not reach significance (P = 0.066) (Table 4).
Table 4: Final multivariable penalized Cox regression model. RBP4 was modeled using restricted cubic splines with knots at the 5th, 35th, 65th, and 95th percentiles. Individual spline basis coefficients are not interpreted separately and are provided in Supplementary Table 2. The effect of RBP4 is summarized by the P75-versus-P25 hazard ratio, the joint test for overall association, and the test for nonlinearity. HR, hazard ratio; CI, confidence interval; eGFR, estimated glomerular filtration rate; RBP4, retinol-binding protein 4. Please click here to download this file.
Nomogram and risk stratification
Based on the penalized and optimism-corrected Cox model (development cohort, n = 357), a nomogram was constructed to estimate individualized 1-year and 3-year recurrence risks (Figure 3A). In the nomogram, RBP4 is displayed as the raw serum value (mg/L), whereas the corresponding point values reflect the restricted cubic spline transformation and therefore follow a nonlinear scale.
After stratification into tertiles of the predicted 3-year recurrence risk, recurrence-free survival curves for the low-risk (n = 119), intermediate-risk (n = 119), and high-risk (n = 119) groups showed clear separation. Higher total point scores corresponded to a higher recurrence risk, with the high-risk group exhibiting a more rapid decline in recurrence-free survival than the low-risk group (log-rank P < 0.001) (Figure 3B).
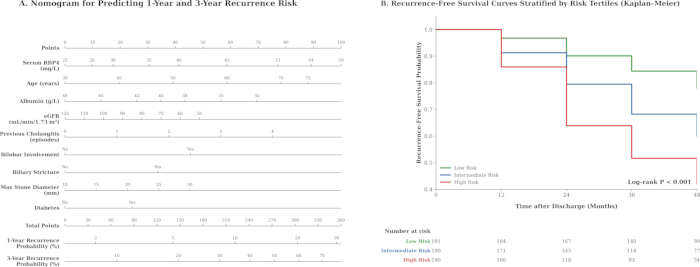
Figure 3: Nomogram and risk stratification for recurrence. (A) Nomogram for predicting 1-year and 3-year recurrence risk. The nomogram is based on the penalized, optimism-corrected Cox model shown in Table 4 (Breslow-estimated S0). Scores for each variable are summed to obtain the total points, from which the corresponding 1-year and 3-year recurrence probabilities can be determined. Higher total point values indicate a higher risk of recurrence. The RBP4 axis displays raw serum RBP4 values (mg/L), whereas the assigned point values are derived from the restricted cubic spline transformation used in the Cox model; therefore, the point scale for RBP4 is nonlinear. (B) Recurrence-free survival curves stratified by risk tertiles (Kaplan-Meier). Patients were divided into low-, intermediate-, and high-risk groups according to the nomogram-derived tertiles of predicted 3-year recurrence risk. Recurrence-free survival was estimated using the Kaplan-Meier method, and the groups were compared using the log-rank test. Numbers at risk and censoring are shown below the plot.Please click here to view a larger version of this figure.
Internal validation and model performance
In both the development cohort (n = 357) and the temporal validation cohort (n = 214), the 1-year and 3-year calibration curves were closely aligned with the ideal diagonal (intercept near 0 and slope near 1), indicating good overall model calibration (Figure 4A).
In the inverse probability of censoring-weighted time-dependent ROC analysis, the model achieved AUCs of 0.78 and 0.76 at 1 and 3 years, respectively, in the development cohort and 0.74 and 0.72, respectively, in the temporal validation cohort, indicating acceptable discrimination in both cohorts (Figure 4B). Harrell's C-index was 0.76 in the optimism-corrected development cohort and 0.72 in the temporal validation cohort. The slightly lower AUCs and C-index in the temporal validation cohort suggest mild optimism or temporal drift, possibly reflecting differences in case mix, surgical practice, or follow-up patterns over time.
The 1-year and 3-year Brier scores were compared with the corresponding cohort-specific null-model Brier scores to facilitate interpretation of the absolute prediction error (Table 5; development cohort, n = 357; validation cohort, n = 214). Model Brier scores were lower than the corresponding null-model values in the development cohort, whereas the difference was smaller in the temporal validation cohort.
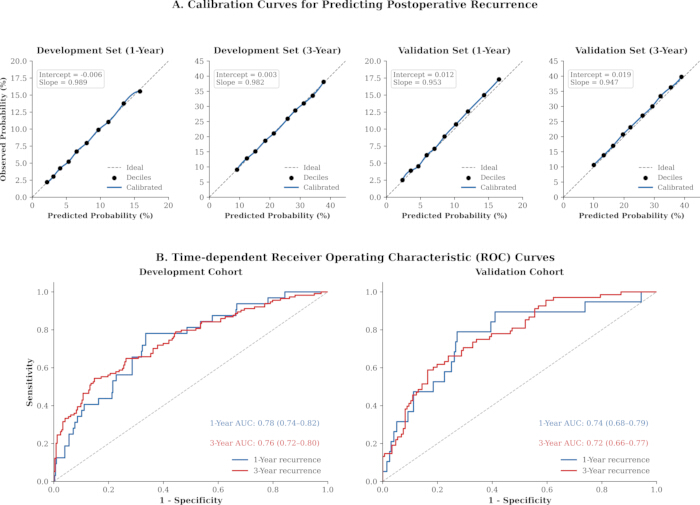
Figure 4: Calibration and discrimination of the prediction model. (A) Calibration curves for predicting postoperative recurrence at 1 and 3 years. The left panel shows the development cohort (2015–2019, n = 357), and the right panel shows the temporal validation cohort (2020–2022, n = 214). The diagonal dashed line represents ideal calibration (intercept = 0, slope = 1). (B) Time-dependent receiver operating characteristic (ROC) curves. The left panel shows the development cohort (n = 357) at 1 year (AUC = 0.78) and 3 years (AUC = 0.76). The right panel shows the temporal validation cohort (n = 214) at 1 year (AUC = 0.74) and 3 years (AUC = 0.72). Inverse probability of censoring weighting (IPCW) was used to account for censoring during follow-up.Please click here to view a larger version of this figure.
Table 5: Model performance in the development and temporal validation cohorts. The C-index for the development cohort was optimism-corrected. Brier scores were estimated using inverse probability of censoring weighting. Null-model Brier scores were estimated from the marginal recurrence probability at each time point and are provided as reference values for interpreting absolute prediction error. AUC, area under the time-dependent receiver operating characteristic curve. Please click here to download this file.
Clinical net benefit, incremental value, and sensitivity analyses
Decision curve analysis demonstrated a positive net benefit primarily across threshold probabilities of approximately 10%–30% in both the development cohort (n = 357) and the temporal validation cohort (n = 214) (Figure 5). When the threshold probability exceeded approximately 35%, the net benefit approached zero or became negative, indicating limited clinical utility in high-threshold decision scenarios.
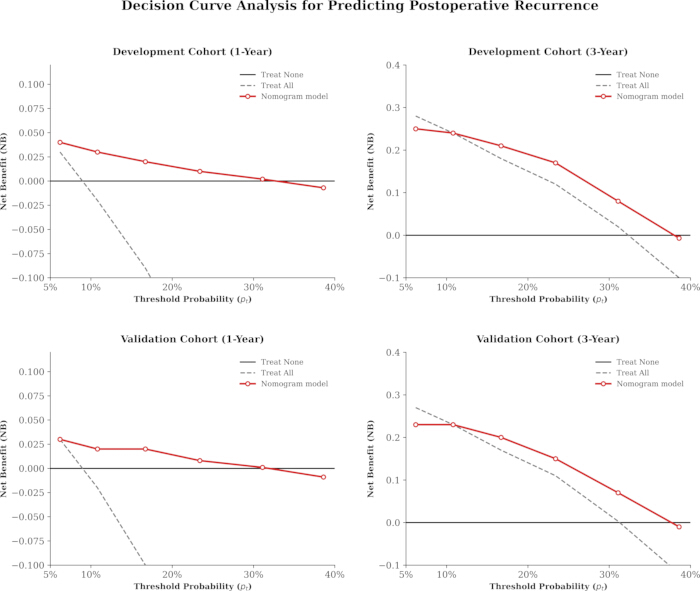
Figure 5: Decision Curve Analysis for Predicting Postoperative Recurrence. The threshold range was selected according to clinically acceptable risk intervals. The upper left panel shows the development cohort (n = 357) at 1 year after surgery, and the upper right panel shows the development cohort at 3 years after surgery. The lower left panel shows the temporal validation cohort (n = 214) at 1 year after surgery, and the lower right panel shows the temporal validation cohort at 3 years after surgery. Net benefit was observed primarily across threshold probabilities of approximately 10%–30%, whereas the benefit diminished at threshold probabilities exceeding approximately 35%.Please click here to view a larger version of this figure.
Compared with the clinical-only model (development cohort, n = 357; validation cohort, n = 214), incorporation of RBP4 provided incremental predictive value. Both reclassification and discrimination improved (NRI approximately 0.14–0.22; IDI approximately 0.02–0.04), and the likelihood ratio test demonstrated a significant improvement in model fit in the development cohort (P < 0.001), with this improvement maintained in the temporal validation cohort (Table 6). Given the small absolute IDI values, the incremental value of RBP4 should be interpreted as complementary to, rather than as a replacement for, established clinical and imaging predictors.
Table 6: Evaluation of the incremental predictive value of adding RBP4. Net reclassification improvement (NRI) and integrated discrimination improvement (IDI) are time point-specific measures. The likelihood ratio test provides an overall comparison between the full model (including RBP4) and the clinical-only model. Please click here to download this file.
In sensitivity analyses, the final analytical populations consisted of patients with complete information for the corresponding models. Among these patients, the eGFR ≥60 mL/min/1.73 m2 subgroup (n = 432) and the C-reactive protein concentration ≤10 mg/L subgroup (n = 389) were analyzed. RBP4 remained associated with increased recurrence risk, and both overall association and nonlinearity tests remained statistically significant (both P < 0.05). In the Fine-Gray competing-risk analysis accounting for 34 deaths without recurrence (n = 571), the association between RBP4 and recurrence remained consistent with that observed in the primary Cox model (sHR 1.35, 95% CI 1.12–1.63). The 3-year cumulative incidence estimate was similar to the Kaplan-Meier estimate, suggesting that competing mortality had limited influence on the recurrence estimate in this cohort (Table 7). Additional adjustment for biliary reconstruction did not materially alter the association between RBP4 and recurrence.
Table 7: Sensitivity and subgroup analyses. Sample sizes represent the final analytical populations after applying subgroup eligibility criteria and restricting analyses to patients with complete information for all variables required in the corresponding sensitivity models. Percentiles were calculated from the RBP4 distribution within each analysis population. Poverall and Pnonlinear were obtained using likelihood ratio tests. The competing-risk analysis reports the sub-distribution hazard ratio (sHR). Please click here to download this file.
DATA AVAILABILITY:
The datasets and R scripts generated and analyzed during the current study, including the raw and cleaned patient-level data, intermediate datasets, source data for all figures and tables, and executable code required to reproduce the reported results, are available as Supplementary File 1.
Supplementary Table 1: Missing data by candidate predictor. Missingness was low across the candidate predictors, with an overall proportion of approximately 5%. Multiple imputation by chained equations was used for variables with limited missingness. Please click here to download this file.
Supplementary Table 2: Restricted cubic spline coefficients for serum RBP4. RBP4 was modeled using restricted cubic splines with knots at the 5th, 35th, 65th, and 95th percentiles. Individual spline basis coefficients are provided for model transparency but are not interpreted separately. Clinical interpretation of RBP4 is based on the overall association, the nonlinear component, and the P75-versus-P25 effect estimate. Please click here to download this file.
Supplementary File 1: The datasets used for this study. Please click here to download this file.
Discussion
After multivariable penalization and correction, RBP4 remained independently associated with postoperative recurrence risk and showed a nonlinear dose-response, indicating that it provides additional risk signals beyond traditional clinical and imaging information. This association was reproducible under relatively normal renal function and low inflammatory status, and showed the same direction in a competing-risk framework, suggesting that the predictive information is unlikely to be explained solely by a decline in renal clearance or by acute inflammation. RBP4 is secreted by the liver and adipose tissue and, in addition to participating in retinol transport, is associated with insulin resistance, dyslipidemia, and low-grade inflammation13. RBP4 may reflect a host of metabolic and inflammatory factors relevant to postoperative recurrence rather than acting as a direct causal factor. As a protein closely associated with hepatic and adipose metabolism, insulin resistance, lipid handling, and low-grade inflammation, elevated RBP4 may reflect systemic conditions that favor recurrent stone formation after surgery. These conditions could interact with local biliary factors, such as cholestasis, bacterial colonization, and chronic cholangitis, thereby contributing to a microenvironment prone to stone recurrence14. However, the present study was not designed to determine the biological mechanism of RBP4 in hepatolithiasis. Further experimental and prospective studies are needed to clarify whether RBP4 directly participates in changes in bile composition, biliary epithelial injury, or inflammatory remodeling of the bile ducts. The nonlinear feature suggests threshold or saturation effects, with a more pronounced increase in risk at higher levels, supporting the avoidance of linear assumptions or simple categorization in the prediction model to preserve dose information and reduce instability arising from threshold selection. Clinically, the RCS curve suggested that recurrence risk became more apparent in the upper-middle range of RBP4 distribution. However, this observation should be interpreted as a risk gradient rather than a validated cutoff, because no prespecified threshold analysis was performed. The sampling window for RBP4 is fixed and the measurement can be standardized, making it more suitable for incorporation into the preoperative assessment process to identify people who require more intensive imaging re-examinations and follow-up management15. Previous recurrence prediction has mostly focused on structural factors such as biliary stricture, bilobar involvement, history of infection, and stone burden, with limited incorporation of quantifiable preoperative biomarkers16. Studies in populations with metabolic syndrome and fatty liver disease have suggested that RBP4 can reflect the metabolic inflammatory state17. Combining it with clinical features may complement the host susceptibility dimension, improve the pathway for recurrence risk assessment, and provide a biological anchor for subsequent external validation and dynamic updating.
Beyond serum RBP4, the model still indicated that prior episodes of cholangitis, bilobar involvement, biliary stricture, and stone burden were independently associated with recurrence; recurrence was not uncommon, suggesting that risk assessment needs to cover both biliary structure and infection history. Biliary stricture and bilobar involvement represent restricted drainage pathways and a wide extent of disease; cholestasis and increased local pressure lead to biliary sludge deposition and promote bacterial colonization and biofilm formation; recurrent inflammation can cause fibrosis of the bile duct wall and restenosis, constituting a self-reinforcing process of recurrent stone formation. The number of episodes of cholangitis reflects long-term microbiome imbalance and inflammatory exposure, consistent with infection-related lithogenic mechanisms18. An increase in stone diameter often indicates higher burden and a basis of mucosal injury; even after excluding residual stones, it may still represent a susceptible state of ductal dilatation and microdeposition19. Higher albumin and higher eGFR were associated with lower risk, suggesting that nutritional status and organ reserve influence postoperative repair and infection control; reduced renal function may also affect the pharmacokinetics of anti-infective therapy and immune responses20. The effect of diabetes was attenuated after multivariable adjustment, supporting that its risk is more indirectly expressed through metabolic and inflammatory phenotypes21. Imaging indicators showed good inter-rater consistency, reducing bias in risk estimation caused by measurement error and making these structural data more suitable for inclusion in a reproducible preoperative tool. The existing literature generally regards stricture, bilobar disease, and cholangitis as key to recurrence, and many models rely on intraoperative or postoperative information22; reproducing this risk spectrum using only preoperative or before-discharge features enhances interpretability and facilitates implementation in clinical follow-up decision-making scenarios.
Based on variables available preoperatively or before discharge, the constructed nomogram provided individualized estimates of 1-year and 3-year recurrence risk and enabled patients to be divided into risk strata with graded separation in recurrence-free survival, indicating operable risk-stratification capability. After optimism correction in the development set, the model maintained stable performance and showed similar calibration and discrimination in the temporal validation set, with prediction errors in a low range, suggesting that both absolute risk scaling and relative ranking were reliable. Net benefit analysis suggested that, within clinically acceptable probability thresholds, the model-guided strategy yielded superior or comparable benefit relative to “treat-all” and “treat-none,” indicating that the tool not only distinguishes risk but also supports individualized configuration of follow-up intensity, imaging re-examination frequency, and health management strategies. Using a time-to-event framework, combined with bootstrap optimism correction and uniform shrinkage, helps suppress overfitting and improve robustness to temporal drift; the high inter-rater consistency of key imaging variables also reduces the impact of measurement error on model reproducibility23. Compared with the clinical-only control model, adding RBP4 improved both reclassification and discrimination, with a clear improvement in model fit in the development set, suggesting that the biomarker complements traditional structural and infection-related information by adding a host susceptibility dimension to prediction24. Prior recurrence prediction has often been limited by small sample sizes, neglect of nonlinearity, or reliance on intraoperative/postoperative information, and has frequently reported only a single discrimination metric without an evidence chain for calibration, error, and decision dimensions25; reporting discrimination, calibration, overall error, and net benefit within the same study framework, together with temporal validation and incremental value evaluation, is more conducive to advancing prediction models from statistical significance to clinical usability.
Surgical heterogeneity may also influence recurrence. In particular, biliary reconstruction can alter bile drainage, bacterial colonization, and long-term cholangitis risk. In this study, biliary reconstruction was not included in the primary model because the model was intended for preoperative or early perioperative risk assessment. However, additional adjustment for biliary reconstruction did not materially change the association between RBP4 and recurrence, suggesting that the metabolic-inflammatory signal captured by RBP4 was not fully explained by the surgical approach.
Limitations
This model was based on a single-center retrospective cohort; case mix, surgical strategies, and follow-up patterns may be institution-specific, and unmeasured confounding and selection bias cannot be fully excluded, so cross-center generalization should be undertaken with caution. RBP4 measurements came from both prior laboratory records and biobank ELISA; although procedures were controlled, batch or platform differences may affect comparability; harmonized assays with consistency assessment and calibration are warranted in future work. Recurrence was defined as ≥6 months postoperatively, and residual stones were excluded, which increased outcome purity but limited interpretability of early risk and may be affected by differences in imaging re-examination frequency. Important intraoperative and postoperative factors, including detailed surgical technique, anti-infective regimens, bile culture results, and stone composition, were not incorporated into the primary model. These factors may influence bacterial persistence, bile drainage, reinfection, and stone re-formation, and their omission may have left residual confounding. Although temporal validation was performed, external multicenter validation and real-world impact studies are still lacking. Therefore, the model should not yet be considered ready for routine clinical implementation. Future work could conduct prospective validation in independent populations, recalibrate and update parameters by center or year, embed predefined intervention thresholds into the electronic medical record to generate automated stratification prompts, evaluate whether model-guided follow-up and imaging surveillance can improve clinical outcomes, reduce recurrence-related complications, and inform resource allocation, and establish processes for regular monitoring of calibration drift. It is also possible to explore the incremental value of postoperative dynamic RBP4 and inflammatory markers, build a prediction framework that can be updated over time, and evaluate cost-effectiveness and patient acceptability.
Conclusion
Preoperative serum retinol-binding protein 4, combined with clinical and imaging features, may help estimate individual recurrence risk after intrahepatic bile duct stone-clearance surgery. The nomogram showed acceptable discrimination, good calibration, and potential clinical utility for predicting 1- and 3-year recurrence. The incremental value of retinol-binding protein 4 was measurable but modest, suggesting that it complements rather than replaces established clinical and imaging predictors. Given the single-center retrospective design and lack of external validation, prospective multicenter studies are needed before clinical implementation. The model may be most useful for patients with intermediate predicted risk, as its net benefit was mainly observed at threshold probabilities of approximately 10%-30%.
Déclarations de divulgation
The authors declare that they have no conflicts of interest.
Remerciements
The authors thank all patients who participated in this study and the clinical staff involved in patient care, data collection, and follow-up.
Matériaux
| Nom | Entreprise | Numéro de catalogue | Commentaires |
|---|---|---|---|
| Electronic medical record system (EMR) | Hospital-specific internal system | N/A | Source for demographics, clinical history, perioperative records, and follow-up information. |
| General laboratory analyzers | Roche Diagnostics | N/A | Used to measure CRP, albumin, total bilirubin, γ-GT, eGFR. |
| Human RBP4 ELISA Kit | Elabscience | E-EL-H1581 | Used to measure serum RBP4. |
| Imaging archive system / PACS | Hospital-specific internal system | N/A | Source for preoperative imaging features (bilobar involvement, biliary stricture, maximal stone diameter) and outcome imaging for recurrence adjudication. |
| Laboratory information system (LIS) | Hospital-specific internal system | N/A | Source for preoperative laboratory indices (e.g., albumin, total bilirubin, γ-GT, eGFR, CRP, and serum RBP4 when available as historical records). |
| Not applicable (retrospective observational study; no experimental materials/consumables) | Hospital-specific internal system | N/A | Single-center retrospective cohort; data obtained from existing electronic medical records, laboratory information system, and imaging archive system; no experimental intervention. |
| R (version 4.3.2) | R Foundation for Statistical Computing | The Comprehensive R Archive Network (CRAN) | Statistical analysis and model development. |
| R packages (survival, rms, mice, timeROC, riskRegression, glmnet) | CRAN | CRAN | survival/rms for Cox modeling and nomogram; mice for MICE; timeROC and riskRegression for time-dependent ROC/AUC and IPCW metrics; glmnet used when penalized regression was applied. |
| Rstudio | Posit Software, PBC | Posit | Project management and script execution (version not specified). |
Références
- Motta RV, Saffioti F, Mavroeidis VK. Hepatolithiasis: epidemiology, presentation, classification and management of a complex disease. World J Gastroenterol. 2024;30(13):1836-50.
- Dilek ON et al. Hepatolithiasis: clinical series, review and current management strategy. Turk J Surg. 2020;36(4):382-92.
- Lin DX et al. Laparoscopic vs open surgery for complex hepatolithiasis: a retrospective comparative study. World J Hepatol. 2025;17(11):110050.
- Hakuta R et al. Balloon endoscopy-assisted endoscopic retrograde cholangiopancreatography for hepatolithiasis in patients with hepaticojejunostomy. Surg Endosc. 2024;38(5):2423-32.
- Pu T et al. Clinical online nomogram for predicting prognosis in recurrent hepatolithiasis after biliary surgery: a multicenter, retrospective study. World J Gastroenterol. 2022;28(7):715-31.
- Ye YQ et al. Evolution of surgical treatment for hepatolithiasis. World J Gastrointest Surg. 2024;16(12):3666-74.
- Li Z et al. Correlation analysis and recurrence evaluation system for patients with recurrent hepatolithiasis: a multicentre retrospective study. Front Digit Health. 2024;6:1510674.
- Li EL et al. Intrahepatic bile duct exploration lithotomy is a useful adjunctive hepatectomy method for bilateral primary hepatolithiasis: an eight-year experience at a single centre. BMC Surg. 2019;19(1):16.
- Steinhoff JS, Lass A, Schupp M. Biological functions of RBP4 and its relevance for human diseases. Front Physiol. 2021;12:659977.
- Tang W, Kang X, Zhou C, Chen C. The predictive value of the combination of serum RBP4, ALP, IL-1β for postoperative recurrence of intrahepatic bile duct stones. Ther Clin Risk Manag. 2025;21:1277-85.
- Schuster NA et al. Modeling non-linear relationships in epidemiological data: the application and interpretation of spline models. Front Epidemiol. 2022;2:975380.
- Van Calster B et al. Evaluation of performance measures in predictive artificial intelligence models to support medical decisions: overview and guidance. Lancet Digit Health. 2025;7(12):100916.
- Flores-Cortez YA et al. Interplay of retinol binding protein 4 with obesity and associated chronic alterations. Mol Med Rep. 2022;26(1):244.
- Jalan-Sakrikar N et al. Central role for cholangiocyte pathobiology in cholestatic liver diseases. Hepatology. 2025;82(4):834-54.
- Zhang ZH et al. Serum retinol-binding protein levels are associated with nonalcoholic fatty liver disease in Chinese patients with type 2 diabetes mellitus: a real-world study. Diabetes Metab J. 2022;46(1):129-39.
- Liang YR et al. Factors influencing recurrence and model development for recurrence of minimally invasive percutaneous transhepatic lithotripsy: a single-center retrospective study. Am J Transl Res. 2024;16(5):1740-8.
- Hu R, Yang X, He X, Song G. The relationship between NAFLD and retinol-binding protein 4: an updated systematic review and meta-analysis. Lipids Health Dis. 2023;22(1):8.
- Xiao Z et al. The imbalance of biliary microflora in hepatolithiasis. Microb Pathog. 2021;157:104966.
- Nakamura K et al. Comparative study of therapeutic outcomes in patients who developed hepatolithiasis after hepaticojejunostomy: balloon-assisted enteroscopic approach versus percutaneous transhepatic approach. Surg Endosc. 2025;39(2):1160-8.
- Gomi H et al. Tokyo Guidelines 2018: antimicrobial therapy for acute cholangitis and cholecystitis. J Hepatobiliary Pancreat Sci. 2018;25(1):3-16.
- Wu Y, Xu CJ, Xu SF. Advances in risk factors for recurrence of common bile duct stones. Int J Med Sci. 2021;18(4):1067-74.
- Park JS et al. Risk factors for long-term outcomes after initial treatment in hepatolithiasis. J Korean Med Sci. 2013;28(11):1627-31.
- Granzier RWY et al. MRI-based radiomics in breast cancer: feature robustness with respect to inter-observer segmentation variability. Sci Rep. 2020;10(1):14163.
- Huang C et al. Performance metrics for the comparative analysis of clinical risk prediction models employing machine learning. Circ Cardiovasc Qual Outcomes. 2021;14(10):e007526.
- Moons KGM et al. PROBAST: a tool to assess risk of bias and applicability of prediction model studies: explanation and elaboration. Ann Intern Med. 2019;170(1):W1-W33.